Review Article
DEVELOPMENT AND VALIDATION OF STABILITY INDICATING RP-HPLC METHOD FOR
NATAMYCIN IN BULK AND OPHTHALMIC DOSAGE FORMS.
JIGAR CHAUDHARI
1, G. S. CHHABRA
21M.Pharm. (Quality Assurance), SVKM’s School of Pharmacy and Technology Management, NMIMS Shirpur, Dhule, Maharashtra, India. 2Assistant Professor, SVKM’s School of Pharmacy and Technology Management, NMIMS Shirpur, Dhule, Maharashtra, India.
Email: [email protected]
,
[email protected]Received: 28 March 2014, Revised and Accepted: 25 April 2014
ABSTRACT
Objective: This study was aimed to develop stability indicating RP-HPLC method for analysis of Natamycin and its dosage form according to theICH Q1A (R2) guidelines.
Methods: Successful separation of drug from degradation products formed under stress conditions was achieved by a gradient HPLC method,performed onSeries 200 UV–visible detector by using Kromasil C18(100 x 4.6 mm, 5 µm) column; the flow rate was 1 ml/min, injected volume 20μL,
the optimised mobile phases consist of Solvent A (Methanol) and Solvent B (Phosphate Buffer pH 3.5, adjusted pH with o-phosphoric acid) and UV detection was carried out at 304 nm.
Results: The retention time of Natamycin was 8.96±0.10 minutes.The method was validated with respect to system suitability, linearity, precision, accuracy, limit of detection (LOD), limit of quantification (LOQ) and robustness. Linearity (20–100 μg/ml), LOD and LOQ was found to be 1.2 and 3.66 μg/ml respectively.The RSD for intra-day (0.59-0.86) and inter-day (0.44-0.96) precision were found to be less than 1 %. The mean percentage recovery was 100±2% which shows good agreement with the labelled amount in the ophthalmic formulations.Natamycin was exposed to acid-base hydrolytic, oxidative, thermal and photolytic stress conditions. The forced degradation studies were performed by using 0.01 N HCl (8.62%), 0.01 N NaOH (9.18 %), 15 % H2O2(24.13 %), thermal (100 °C, 5.13%) and sunlight (29.41%).
Conclusion: Natamycin issusceptible towards acidic, basic, oxidative and photolytic conditions in comparison to unaffected by thermal degradations.The method is simple, specific, precise, robust and accurate for the determination of Natamycin in ophthalmic formulations.
Keywords: Natamycin, RP-HPLC, Stability Indicating Method, Validation, Forced degradation.
INTRODUCTION
Stability indicating methods have become an important aspect of any analytical method validation. Natamycin(figure 1) is amphoteric macrolide antifungal antibiotic drug from Streptomyces natalensis or
Streptomyceschattanoogensis. It is chemically (1R,3S,5R,7R,12R,22R,24S,25R,26S)-22-{[(3S,4S,5S,6R)-4-amino- 3,5-dihydroxy-6-methyloxan-2-yl]oxy}-1,3,26-trihydroxy-12- methyl-10-oxo-6,11,28-trioxatricyclo[22.3.1.0^{5,7}]octacosa-8,14,16,18,20-pentaene-25-carboxylic acid, used for a variety of fungal infections, mainly topically.[1, 2] The Reverse-Phase High performance liquid Chromatography (RP-HPLC) is very useful for the determination of Natamycin drug substance in ophthalmic dosage form.
Stability-Indicating Method (SIM) for formulation is defined as a validated analytical procedure that accurately and precisely identifiedactive Pharmaceutical ingredients (API), free from interferences like degraded product, process impurities, excipients. SIM is a quantitative analytical procedure which is used for the detection of decrease in the amount ofAPI present due to degradationby applying various stress conditions. For developing SIM, a forceddegradation study is normally carried out under more
severe conditions than those used in accelerated
studies.Approximately 5-20% degradation of the drug substance has been considered as reasonable and acceptable forvalidation of chromatographic assays [3, 4].
Literature survey revealed that very few analytical methodshave been reportedfor the determination of Natamycin in Doogh-refreshingdrink, rabbitandhumanplasma and wines by HPLC[5],LC MS/MS[6-8] and UPLC-tandem mass Spectrometry[9]method. The reported HPLCmethodswere considered to beuneconomical, time
consuming and having poorsymmetry [10, 11].Natamycin 5 % w/v eye drops is available in the market butthe Natamycin has not been adopted by any official pharmacopoeia(USP, BP or EP etc.), there is no reported stability indicatingmethod using HPLC in bulk drug or formulation.So in the present research workattempt was taken to develop andvalidate RP HPLC method which was cost effective and having short analysis time in order to increase efficiency and also performed forced degradation study of Natamycin for developing Stability Indicating Method.
MATERIALS AND METHODS
Chemicals and Reagents
Natamycin working standard and Drug product (5 % w/v Ophthalmic Suspension) were procured from the market. Methanol procured fromMerck India was of HPLC grade. GR grade potassium di-hydrogen orthophosphate from Molychem, o-phosphoric acid, hydrochloric acid (HCl), Hydrogen peroxide (H2O2) 15% w/v were
from Merck India, sodium hydroxide (NaOH) pellets were from RFCL limited SQ grade. HPLC grade water was obtained through milli Q water purification system.Allchemicals were of analytical grade and used as received.
Fig.1: Chemical structure and UV spectrum (λmax= 304 nm)of (USA), aSeries 200 UV–visible detector using total chrome navigator software for data handling using C18(100 x 4.6 mm, 5 µm) column. Samples
were injected through a Rheodyne injector valve with 20-μL sample loop.
Chromatographic Conditions
The chromatographic separation was carried outat room temperature on a kromasil C18(100 mm × 4.6 mm) analytical column under
RP-HPLC conditions.In order to select a suitable mobile phase for the analysis of Natamycin, various combination of solvents were tried on the basis of trial and error considering the system suitability parameters like retention time, tailing factor, number of theoretical plates and HETP.
Preparation of Stock Standard Solution
Accurately weighed 10 mg of Natamycin was transferred to a 10 ml volumetric flask, sufficient amount of diluent (Methanol: Water, 1:1) was added to dissolve it and volume was made up to 10 ml (Stock A; 1000 μg/ml). Aliquots of stock A were further diluted with diluent up to 10 ml to get concentration of 20, 40, 60, 80, and 100 μg/ml for the linearity study.
Selection of Mobile Phase
The mobile phases consist of two solvent:Solvent A, Methanol and Solvent B, Buffer pH 3.5 was prepared by using 1.36 gm of potassium di-hydrogen phosphate dissolved in 1000 ml of water, pH was adjusted to 3.5 with o-phosphoric acid (HPLC Grade). Beforeproceedingfor analysis the mobile phase was degassed by use of a sonicator (Oscar) and filtered through a 0.45 μm HPLC filtration assembly. The diluents used to attain the final concentration consist of a mixture of water: methanol (1:1). Flow rate was 1 ml/min, injected volume 20μL, wavelength of detection is 304 nm. The system was equilibrated before each injection. Gradient elution system was performed which consist of solvent A and Solvent B The program of gradient elution is shown in Table 1 below.
Table 1: Gradient Elution (Solvent Programming) Runs
Time (min) Solution A (%) Solution B (%)
The proposed method is validated according to the ICH guideline.
System Suitability:
The stock solution of the drug was prepared at strength of 100 µg/ml. It was diluted to prepare solutions containing 40, 60and 100
μg/ml of the drug Natamycin, and 3 replicate injection of each concentration were inserted into the HPLC system.
Linearity Curve (Calibration Curve):
Aliquots of standard Natamycin stock solution were taken in five different volumetric flasks and diluted up to the mark with the diluents such that the final concentrations of Natamycin are 20, 40, 60, 80 and 100 µg/ml. Each of these drug solutions was injected 20μl into the injector and recorded the peak area.
Accuracy
The accuracy of the method was determined bycalculating percentage recovery of Natamycin.Recovery studies were carried out by applying the spikingmethod in which known amount of Natamycin corresponding to 80, 100 and 120% of label claim wasadded (standard addition method) to the placebo. Ateach level of the amount three determinations were performed andfitting these values to the linear equation of the calibration curve.
Precision:
Precision study of sample (Natamycin) was carried out on Intraday and Interday by estimating corresponding responses 3 times each for 40, 60 and 80% target concentration.
LOD and LOQ
The limit of detection (LOD) is defined as the smallest quantities of Natamycin clearly distinguishable from baseline, which has a signal to noise ratio of 3:1. LOD was calculated using following formula,LOD=3.3(SD)/S, where SD= standard deviation of response (peak area) and S= average of the slope of the calibration curve. Limit of Quantification (LOQ) was determined at a signal to noise ratio (S/N), which experimentally verified by diluting known concentrations of Natamycin until the average responses were approximately 10 times the standard deviation of the responses for six replicate determinations, LOQ was calculated using following formula, LOQ=10(SD)/S.
Robustness
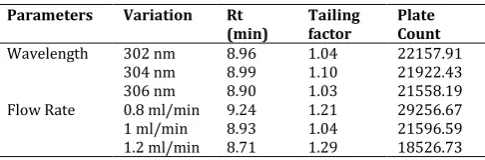
Robustness is the measure of method capacity to retain unaffected by deliberate small changes in the chromatographic conditions like detection wavelength and flow rate. Detection wavelength was changed from 304 nm to 304 ±2 nm and flow rate was changed from 1ml/min to 1±0.2ml/min. Effect of these changed parameters was studied by injecting the sample in to the system.
Assay for Ophthalmic Suspension
For the assay of marketed formulation, 1 mLof the marketed sample (5% w/v Natamycin Ophthalmic Suspension USP - NATACIN) was pipetted out usinga volumetric pipette and transferred to a 100 mL ofvolumetric flask and diluted with methanol-water mixer (50:50) to get the concentration of 500 μg/ml. Again diluted it to prepare 50 μg/ml solution.Sample was inject in to column and peak areas of the bands were measured at 304 nm. The amount of drug present in sample wasestimated from the calibration curve. Procedure wasrepeated six times for the analysis of homogenoussample.
Forced Degradation study of Natamycin
Forced degradation studies of Natamycin was carried out under conditions of acid-alkali hydrolysis, dry heat, oxidation and photolysis.A minimum 10% degradation of the initial concentration is permissible for various stress degradation studies. Natamycin was weighed (10 mg) and transferred into 10 ml volumetric flask and added 10 ml of methanol – water mixture of equal ratio (1000 ppm stock solution). Three such sets wereprepared for acid, alkali and peroxide degradation.
Acid Degradation
mixture to prepare 50 ppm sample solution. Samples were collected at 30 min, 1hr, 2hr and 4hr time interval respectively.
Base Degradation
Forced degradation in basic media was performed byadding 9ml of 0.01 N NaOH to 1 ml above stock solution and mixed it in one set of flasks and these mixtures were heated forup to 4h at 80°C. Then the solution was cooled anddiluted with 1:1 ratio of methanol - water mixture to prepare 50 ppm sample solution. Samples were collected at 30 min, 1hr, 2hr and 4hr time interval respectively.
Oxidative Degradation
Forced degradation in oxidative media was performed by adding 9ml of 15%H2O2 to 1 ml above stock solution and mixed it in one set
of flasks and these mixtures were heated for up to 4h at 80°C. Then the solution was cooled and diluted with 1:1 ratio of methanol - water mixture to prepare 50 ppm sample solution. Samples were collected at 1hr and 4hr time intervalrespectively.
Thermal Degradation
For Thermal degradation, solid drugs (20 mg Standard powder) were kept in petri-dish in oven at 100°C for 24 h. Thereafter, 10 mg of drug wastransferred to 100 ml volumetric flasks and diluted upto the mark with methanol-water mixture. Again diluted it to prepare 50 μg/ml solution.
Photolytic Degradation
For photo stability, solid drugs (20 mg Standardpowder) were kept in Petri-dish indirect sunlight in summer days for 4hr. on a woodenplank. Thereafter, 10 mg of drug was transferred to 100 ml volumetric flasks and diluted up to the mark with methanol-water mixture. Again diluted it to prepare 50 μg/ml solution.
RESULTS AND DISCUSSION
As shown in figure 2
Method validation
System Suitability
The system suitability parameters were evaluated from standard chromatograms obtained by calculating the %RSD of retention times, tailing factor and peak area from 3 replicate injections, It should not be more than 2%. The number of theoretical plates for Natamycin peaks should not be less than 2000.The system suitability parameters are shown in Table 2. These values were well within the limits.
Figure 2: Chromatogram of Natamycin
Table 2: System Suitability data
Retention time 8.96 min
Theoretical Plate 21996.73
Tailing Factor 1.03
LOD 1.825
LOQ 5.308
Peak area 8646012.55
% RSD 0.49
Remarks: **Mean of three determinations
Linearity
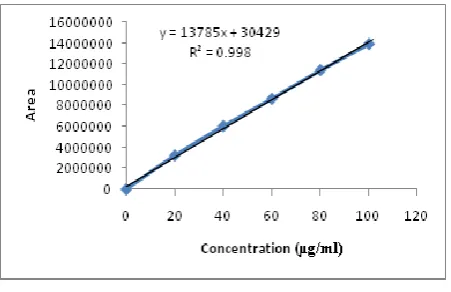
The prepared standard solutions of five different concentrations levels ranging from 20 to 100 μg/ml were injected in triplicate into the HPLC column, keeping the injection volume constant (20 μl) and Chromatograms was recorded at 304 nm (Figure 2) and calibration curve was plotted between the mean peak area vs. respective concentration (Table 3 and Figure 3). The regression equation of calibration curves was obtained as y = 137856x + 304299 with a correlation coefficient of 0.9983. Where slope (m) is 137856 and intercept (c) is 304299.
Fig.3: Linearity Plot of Natamycin
Accuracy
The accuracy of the method was carried out by adding known amounts of Natamycin corresponding to three concentration levels; 80%, 100%, and 120% of the label claim in triplicate. The percentage recoveries of Natamycin at each level and each replicate were determined. The recoveries found to be 98.37 to 100.01 for Natamycin (Table 4). It was confirmed from results that the method is highly accurate.
Precision
The precision (intra-day repeatability) was established by analysing three replicates over three concentrations of Natamycin shown in Table 4 and day to day precision (inter-day) was carried out by three concentrations with three replicates. Percentage relative standard deviation (%RSD) is calculated, shown in Table 4 and Table 5 which are within the acceptable criteria of not more than 2.0%.
Table 3: Linearity Data of Natamycin
Concentration μg/ml Area 1 Area 2 Area 3 Mean
0 0 0 0 0
20 3483440.42 3095140.13 3080320.21 3219633.587
40 5954665.14 6348651.91 5842436.39 6048584.48
60 8810413.12 8596269.39 8531355.14 8646012.55
80 11200369.88 11564803.59 11405988.79 11390387.42
Table 4: Accuracy-Recovery Study of Natamycin by Standard-Addition Method
Sr. no. Initial Conc. µg/ml
Amt. added
μg/ml
Area Amt. found
μg/ml
Amt. Recover
μg/ml
% Recovery Mean % %RSD
1 60 0 8646012.57 60.51 60.51 99.16 99.34 0.38
2 8594322.45 60.14 60.14 99.77
3 8650482.25 60.54 60.54 99.10
1 60 48 15146012.57 107.66 47.66 99.29 99.02 0.24
2 15122457.25 107.49 47.49 98.94
3 15115478.24 107.44 47.44 98.83
1 60 60 16712025.14 119.02 59.02 98.37 99.01 0.89
2 16847644.9 120.00 60.00 100.01
3 16735472.2 119.19 59.19 98.65
1 60 72 18399245.88 131.26 71.26 98.97 99.31 0.53
2 18406481.61 131.31 71.31 99.04
3 18492457.2 131.94 71.94 99.91
Table 5: Precision of Natamycin (Intraday)
Sr. Conc. (μg/ml)
Area1 Area2 Area3 Mean SD RSD%
1 40 6325342.22 6222331.21 6245889.21 6264520.88 53973.80 0.86
2 60 8622567.21 8557381.32 8656814.31 8612254.28 50512.34 0.59
3 80 11604955.83 11416234.59 11493641.89 11504944.10 94866.92 0.82
Table 6: Precision of Natamycin (Interday)
Sr. Conc. (μg/ml)
Area1 Area2 Area3 Mean SD RSD%
1 40 6325462.22 6222181.21 6325742.22 6291128.55 59710.31 0.96
2 60 8622687.21 8557231.32 8622967.21 8600961.91 37872.06 0.44
3 80 11605075.83 11416084.59 11605355.83 11542172.08 109195.07 0.95
LOD and LOQ
The LOQ was found to be 1.2 μg/ml and the LOD was found to be 3.66 μg/ml.Lower values of these parameter indicates more sensitivity of the method.
Robustness
The results obtained from assay of the test solutions were not affected by varying the conditions and were in accordance with the results for original conditions. The value of assay determined for the same sample under original conditions and robustness conditions indicates that the developed method was robust for effect of changed wavelength (± 2 nm) and impact of flow rate (± 0.2), that evaluation were based on the system suitability parameters such as retention time, tailing factor and theoretical plates. Results were
shown in Table 7. Assay for Natamycin Ophthalmic Suspension.
Assay procedure wasrepeated six times for the analysis of homogenoussample of marketed formulation and results are compare with that of the standard. The % Assay was calculated as 98.38 % which was with in the acceptable range of 98.0 to 102 %.
Forced Degradation Study
Natamycin standard were found to be less stable under oxidative, alkaline, acidic and photolytic conditions.A chromatogram of acid hydrolysisperformed at 80 °C for 4 hr showed twomajor degradant havingRt 8.40 min and 13.37(Figure4).A chromatogram of basic hydrolysisperformed at 80 °C for 4 hr showed twomajor degradant havingRt of 6.97 min and 7.57 respectively (Figure 5). A chromatogram of oxidised degradation performed at 80 °C for 4 hr showed major degradant having Rt of 6.67 min (Figure 6). A chromatogram of photolytic degradation performed to sunlight at normal temperature for 4 hr showed threemajor degradant havingRt of 4.57, 6.39 and 10.80 min respectively (Figure 7). A slight
decomposition was seen on exposure of Natamycin drug solution to thermal degradation, 5.13 % of the drug was decomposed (Figure 8). The freealcoholic–OH, amino NH2 and carboxyl -COOH group present
in itschemical structure might be responsible for the reported degradation. The drug has undergone photolysis (29.41) oxidative (24.13 %), alkaline (9.18 %) acidic (8.62%) degradation in 4 hr.(Table 8)
Fig.4: Chromatogram of 0.01 N HCl treated Natamycin at 80 °C temperature for 4 h.
Table 7: Robustness data for Natamycin
Parameters Variation Rt (min)
Tailing factor
Plate Count
Wavelength 302 nm 8.96 1.04 22157.91
304 nm 8.99 1.10 21922.43
306 nm 8.90 1.03 21558.19
Flow Rate 0.8 ml/min 9.24 1.21 29256.67
1 ml/min 8.93 1.04 21596.59
Table 8: Assay of 5 % w/v Natamycin Ophthalmic Formulation
Area Mean %Assay
Sample 1 7389564.23 7291812.377 98.38 %
2 7299447.11
3 7312685.19
4 7328699.48
5 7279826.14
6 7299895.83
Std. 50 ppm 1 7411248.89 7412025.263
2 7431268.17
3 7393558.73
Fig.5: Chromatogram of 0.01 N NaOH treated Natamycin at 80 °C temperature for 4h.
Fig. 6: Chromatogram of 0.1 N H2O2 treated Natamycin at 80 °C
temperature for 4 h.
Fig.7: Chromatogram of Natamycin treatedPhotolysisfor4 hr.
Fig.8: Chromatogram of Natamycin at Thermal condition for 24 h.
Table 9: Force Degradation Data for Natamycin at Different Condition
Degradation Condition Time % Degradation
Base, 0.01 N NaOH 30 min 5.51
1 hr. 6.98
2 hr. 8.36
4 hr. 9.18
Acid, 0.01 N HCl 30 min 3.89
1 hr. 5.03
2 hr. 6.28
4 hr. 8.62
Oxidative, 15% H2O2 1 hr. 15.19
4 hr. 24.13
Thermal Degradation 24 hr. 5.13
CONCLUSION
The validated RP-HPLC Methodemployed here provedto be simple, precise, specific, robust, accurate and stability indicating.The developed method was found to be sensitive and selective for analysis of Natamycin in 5% w/v Ophthalmic Solution without any interference from the excipients. The stability-indicating method determined the API peak and also the peaks of degradation products formed under variability of conditions. After exposure of Natamycin to stress conditions, it was established that the drug is susceptible to acid, base hydrolysis; oxidation, and photolytic degradation with maximum degradation observed in photolysis followed by oxidative degradation. Therefore this method can be employed for monitoring the stability of Natamycin drug substance commercially.
REFERENCES
1. http://www.rxlist.com/natacyn-drug.htm Accessed Date:
01-01-2014.
2. http://www.drugbank.ca/drugs/DB00826 Accessed Date
02-01-2014.
3. ICH, Q1A (R2),Stability Testing of New Drug Substances and Products.In: Proceeding of the International Conference on Harmonization, Geneva, 2003; 1-13.
4. ICH, Q2 (R1),Validation of analytical procedures: Text and methodology,In: Proceeding of the International Conference on Harmonization, Geneva, November 2005; 4-11.
5. Thangabalan B, Vijayaraj KP,Analytical method development
and validation of Natamycin in eye drop by RP-HPLC, Asian Journal of Pharmaceutical and Clinical Research. 2013; 6(1): 133-135.
6. Bhatta RS, Chandasana H, Rathi C, Kumar D, Chhonker YS, Jain
GK,Bioanalytical method development and validation of natamycin in rabbit tears and its application to ocular pharmacokinetic studies.Journal of Pharmaceutical Analysis. 2011; 54: 1096-1100.
7. Fahim NK, Beheshti HR, Feizy J, Janati SSF,LC determination of
Natamycin in Doogh with UV detection,GIDA dergisi; 2012, 37: 127-132.
8. Alberts P, Stander MA, Villiers AD,Development of a fast, sensitive and robust LC-MS/MS method for the analysis of Natamycin in Wine.South African Journal of Enology and Viticulture, 2011; 32: 51-59.
9. Vierikovaa, M, Hrnciarikovaa E, Lehotayb J,Determination of Natamycin content in cheese using Ultra Performance Liquid
Chromatography-Mass Spectrometry,Journal of Liquid
Chromatography and Related Technologies 2013, 36(20), 2933-2943.
10. Becket AS, Stenlake JB,Practical Pharmaceutical Chemistry. Part-2, 4th edition.New Delhi: The Athlone Press, 1997; 281(2): 284-98.
11. Chatwal G, Anand S.Instrumental Methods of Chemical
Analysis.Mumbai: Himalaya Publishing House, 2005; 180-92 12. Snyder, L.R., Kirkland, J.J., Glajch, J.I.,Practical HPLC Method
Development. 2nd ed.
13. 1997, 21-173.
14. ICH, Q1A (R2)Validation of Analytical Procedure: Methodology,
ICH Harmonized Tripartite Guidelines.In: Proceeding of the International Conference on Harmonization, Geneva 1996; 1-8. 15. ICH, Q2 (R1)Text on validation of analytical procedures,
![Fig.1: Chemical structure and UV spectrum (λmaxNatamycin-4- amino-3,5-dihydroxy-6-methyloxan-2-yl]oxy} -1,3,26-trihydroxy = 304 nm)of ((1R,3S,5R,7R,12R,22R,24S,25R,26S) -22- {[(3S,4S,5S,6R) -12- methyl -10- oxo-6,11,28-trioxatricyclo [22.3.1.0^{5,7}] octacosa-8,14,16,18,20-pentaene-25-carboxylic acid)](https://thumb-us.123doks.com/thumbv2/123dok_us/1013051.1125537/2.595.46.295.639.690/chemical-structure-lmaxnatamycin-dihydroxy-methyloxan-trihydroxy-trioxatricyclo-carboxylic.webp)