A number of radio experiments were conducted at Ahmedabad (23◦N, 73◦E) with the aim of studying the iono-spheric effects of the total solar eclipse of 11 August 1999. Rapid radio soundings from the ionosonde were made on the eclipse day and on control days. A riometer was operating at 30 MHz, and eld strength measurements along the three oblique incidence paths of Colombo-Ahmedabad (11905 kHz), Bombay-Ahmedabad (558 kHz) and Rajkot-Ahmedabad (810 kHz) were also made. A reduction of about 20% was observed in the minimum frequency of reection from the ionosonde (fmin), which indicates a reduction in D-region ionization. The critical frequency of the E-layer was not measurable beyond 1600 h IST on eclipse day due to the strong blanketing sporadic-E, but there is a 20% decrease in the critical frequency of the F1-layer. Although there was no change in the minimum virtual height of the F-layer on eclipse day, there appears to have been a decrease in the height of maximum ionization (hpF2) during the eclipse, indicating a reduction in the thickness of the F-layer. The signal strength of the Colombo-Ahmedabad path shows an initial rapid increase with the start of the eclipse (indication of a decrease in ionization in the D- and lower E-regions), but subsequently decreases until the maximum of the eclipse (excessive deviative absorption because of the wave penetrating to the E-region). The eld strength measurements of the Bombay-Ahmedabad path show a large fading after sunset as the sky wave also appeared. On eclipse day the fading started about an hour earlier. Riometer recordings also show a higher signal during eclipse day, which again indicates an eclipse-associated decrease in ionization.
Key words:Solar eclipse, ionosphere.
1.
Introduction
A total solar eclipse provides a unique opportunity for studying several atmospheric processes. Ionospheric effects of the solar eclipse have been studied for many events, and decreases in the ionization of different layers (E, F1and F2) in the ionosphere have been reported from radio-sounding data. Effects in the D-region ionization have been stud-ied using ionospheric absorption data or eld strength mea-surements. Rishbeth (1968) described the eclipse effects in ionospheric E- and F-regions taking theoretical factors into consideration. The lag between ionization and pro-duction depends on the loss coefcients and, consequently, while the changes in the E-region almost follow the eclipse function, there is a lag in F-region effects. Regular radio soundings have been made over Ahmedabad since 1953, and solar eclipse effects have been studied for the events of 30 June 1954 (maximum obscuration of 93% at 1929 h IST), 14 December 1955 (47% at 1240 h), 16 February 1980 (75% at 1540 h) and 24 October 1995 (83% at 0830 h). Chandraet al.(1997) summarized the observed effects from these events, with the study of the last two events based on the true height analysis of rapid ionograms (Chandraet al., 1981, 1997).
The path of totality for the solar eclipse of 11 August
Copyright cThe Society of Geomagnetism and Earth, Planetary and Space Sci-ences (SGEPSS); The Seismological Society of Japan; The Volcanological Society of Japan; The Geodetic Society of Japan; The Japanese Society for Planetary Sci-ences; TERRAPUB.
1999 was about 100 km south of Ahmedabad, with a max-imum obscuration of 99.4% at 1801 h (IST). A number of radio experiments were conducted from Ahmedabad (23◦N, 73◦E) where the Physical Research Laboratory (PRL) oper-ates a digital KEL ionosonde. Rapid radio soundings (ev-ery 2 min) were made on the eclipse day and control days (10 and 12 August 1999). A riometer operating at 30 MHz was set up by the Indian Institute of Geomagnetism (IIG) at the Thaltej campus of PRL, located 5 km west of the main campus; this riometer was functional during the pe-riod 7–13 August 1999. Field strength measurements were made along the three oblique incidence paths of Colombo-Ahmedabad (11905 kHz), Bombay-Colombo-Ahmedabad (558 kHz) and Rajkot-Ahmedabad (810 kHz) by the Physics Depart-ment, Gujarat University, Ahmedabad during the eclipse day and on control days. In this paper, we report on the ionospheric effects of the total solar eclipse of 11 August 1999 observed from Ahmedabad that were determined by a series of different experiments.
2.
Eclipe Geometry
The path of the totality, which was about 100 km south of Ahmedabad, along with the magnitude of the solar eclipse in India are shown in Fig. 1. The maximum obscuration was 99.4% at 1801 h, with rst contact (beginning) occurring at 1656 h and fourth contact (end) at 1859 h. The obscuration of 99.4% was much higher than that for the earlier events of February 1980 (75%) and October 1995 (83%).
60 H. CHANDRAet al.: IONOSPHERIC MEASUREMENTS DURING THE TOTAL SOLAR ECLIPSE OF 11 AUGUST 1999
Fig. 1. Path of totality and the maximum obscuration over India during the total solar eclipse of 11 August 1999. The locations of Ahmedabad and the three transmitting stations along with the midpoints of transmission paths for field strength measurements are also shown.
Fig. 2. Daily variations of the H-, D- and Z-components of the geomag-netic field at Alibag for the period 8–13 August 1999.
ever, the event occurred late in the evening. The locations of the transmitters for field strength measurements with the midpoint of the ray path are also shown in Fig. 1. The max-imum obscuration was 97%, 87% and 99%, respectively, over the midpoints of the Mumbai-Ahmedabad, Colombo-Ahmedabad and Rajkot-Colombo-Ahmedabad transmission paths.
The period of observations was geomagnetically quiet, with normal geomagnetic variations recorded at the Alibag Observatory of IIG. The H-, D- and Z-components recorded at Alibag for 5 days (8–13 August 1999) are shown in Fig. 2.
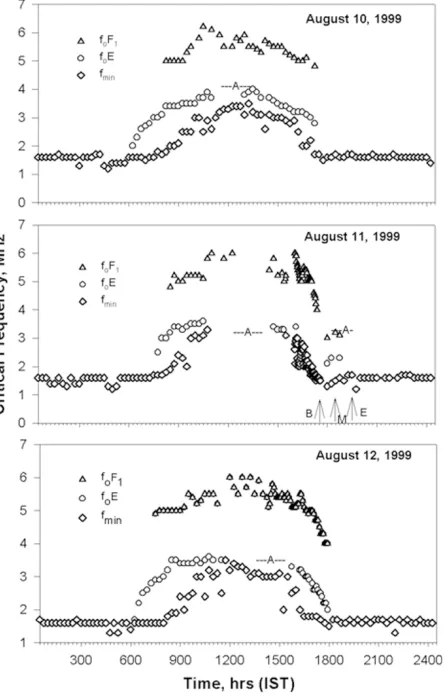
Fig. 3. Daily variations of fmin, foE and foF1over Ahmedabad on the
eclipse day (11 August 1999) and control days (10, 12 August 1999). The times of the beginning (B), maximum phase (M) and end (E) of the eclipse are also marked.
3.
Results
3.1 Ionosonde
The variations in the fmin parameter (the minimum
fre-quency of reflection) and the critical frequencies of the E-and F1-layers (foE and foF1, respectively) are shown in
Fig. 3 for both the eclipse day and the control days. On the control day of 10 August 1999, fmin values are close to
1.6 MHz from 1700 h to 1900 h. On the eclipse day, the fminvalue is 1.7 MHz at 17 h, but decreases to 1.3 MHz at
1800 h, then increases to 1.6 MHz at 1830 h, a decrease of about 20%. The fminparameter is a measure of the D-region
ionization; therefore, the decrease indicates a reduction in D-region ionization. The critical frequency of the E-layer was not measurable beyond 16 h on the eclipse day due to the presence of a blanketing type of sporadic-E. The critical frequency of the F1-layer was lower on the eclipse day than
on control days. The foF1value was 5.0 MHz at 1730 h on
both 10 and 12 August, but only 4.0 MHz on 11 August. This amounts to a decrease of 20% in the critical frequency or a decrease of 36% in the maximum F1layer ionization.
The day was marked with a strong blanketing type of sporadic-E. It must be noted that the period coincided with the Perseid meteor shower. The fbEsparameter is a measure
Fig. 4. Daily variation in fbEs(blanketing frequency of sporadic-E) over
Ahmedabad on the eclipse day of 11 August 1999.
Fig. 5. Daily variation in fbEsover Ahmedabad on the eclipse day of 11
August 1999 between 1600 h and 1930 h based on 5-min values.
sporadic-E. Figure 4 shows the variation in fbEswith time
from 0830 h to 1930 h based on quarter-hourly ionograms. The ‘A’ at 1115 h, 1230 h, 1245 h and 1330 h denotes entire F-region traces blanketed by the sporadic-E. The value of fbEs increases from the morning up until noon and then
decreases towards the evening hours. There is a second increase from 1845 h to 1915 h. In addition to this gradual change, there are periodic variations with a periodicity of approximately 1 h.
The ionosonde was operated in rapid sounding mode dur-ing the afternoon and evendur-ing hours, and the values of fbEs,
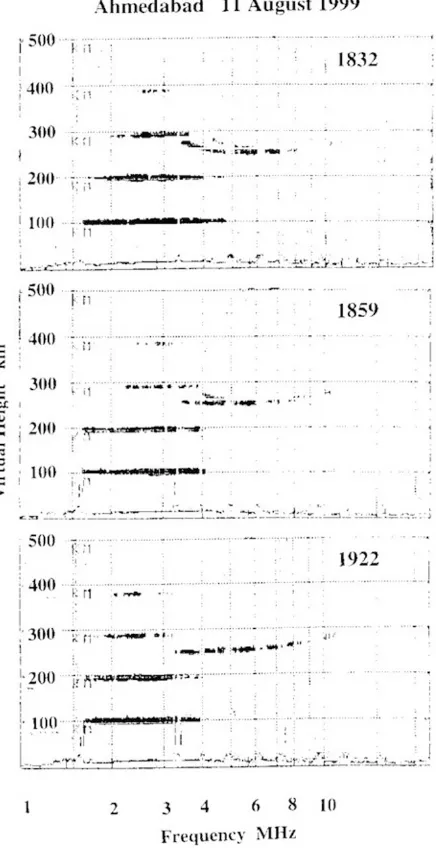
with 5-min intervals, for the period from 1600 h to 1930 h are shown in Fig. 5. The beginning (B), maximum phase (M) and end time (E) of the eclipse are also denoted in Fig. 5, indicating the presence of periodic variations with very high values at 1740 h, 1835 h and 1915 h. The inten-sification of the sporadic-E is thus seen for a small duration (less than 5 min). Examples of ionograms with a strong blanketing type of sporadic-E are shown in Fig. 6. These
Fig. 6. Examples of ionograms recorded over Ahmedabad on the eclipse day at 1832 h, 1859 h and 1922 h showing strong blanketing-type Es with high multiples.
three examples (1832, 1859 and 1922 h) show four mul-tiples of the sporadic-E reflection and fbEs values of near
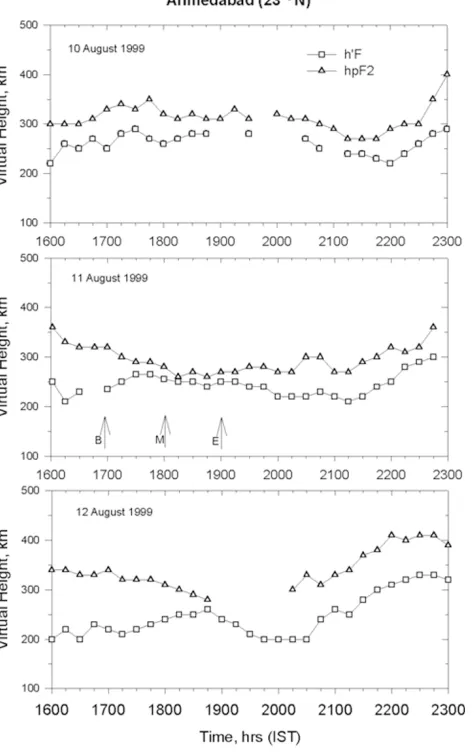
3.5 MHz. An examination of the possible eclipse-induced changes in the height of the F-layer was also attempted us-ing the quarter-hourly ionograms. Figure 7 shows the time variations in h’F (base height) and hpF2(peak height)
dur-ing the period from 1600 h to 2300 h on 10, 11 and 12 Au-gust 1999. Both h’F and hpF2are lower on eclipse day than
on 10 August. However, the h’F values are also lower on 12 August. The hpF2values are therefore lower on eclipse day,
as is the the difference with h’F, implying smaller values of layer thickness.
3.2 Field strength measurements
3.2.1 Colombo-Ahmedabad (11905 khz) The field
62 H. CHANDRAet al.: IONOSPHERIC MEASUREMENTS DURING THE TOTAL SOLAR ECLIPSE OF 11 AUGUST 1999
Fig. 7. Daily variations in h’F and hpF2over Ahmedabad on eclipse day
(11 August 1999) and control days (10, 12 August 1999). The beginning (B), maximum phase (M) and end (E) of the eclipse are also marked.
shows an initial rapid increase with the start of the eclipse (around 1706 h), rising to a maximum at 1722 h, following which time the signal strength decreases continuously until the maximum of the eclipse. The initial increase in the sig-nal strength is due to the decrease in ionization in the D- and lower E-regions, while the subsequent decrease is due to the wave penetrating into the E-region, which leads to excessive deviative absorption. Following the maximum phase of the eclipse, the signal initially rises sharply for 15 min, there-after it continues at near constant value till the end of the eclipse. The initial rise is due to ionization formation as the solar disc opens and thereby reduces deviative absorption. However, later on the reduction in the solar zenith angle ra-diation decreases and acts in the opposite direction, leading to constant signal strength. The signal strength during the regress of eclipse was lower than on the control day, while during the post eclipse period during the night on eclipse day, it was considerably higher than on control day.
3.2.2 Bombay-Ahmedabad (558 KHz) The field
strength records of the Bombay-Ahmedabad transmission on 11 and 12 August 1999 are shown in Fig. 8(b). The eclipse started at 1658 h, while the radio transmission started at 1730 h. Up to 1745 h, the signal strength remains
Fig. 8. Field strength recordings of (a) 11905 kHz (Colombo-Ahmedabad) and (b) 558 kHz (Bombay-Ahmedabad) transmissions during eclipse day (11 August 1999) and control day (12 August 1999).
Fig. 9. Field strength recordings of 810 kHz (Rajkot-Ahmedabad) trans-mission during eclipse day (11 August 1999) and control day (12 August 1999).
constant, which is due to the ground wave. After 1745 h the sky wave also started reaching the receiver and as a re-sult slow fading is observed. Such fading was also observed each control day, but it started almost on hour later. At the maximum phase of the eclipse a peak in signal strength is seen. During the regress of the eclipse the sky wave contin-ues to reach receiver, but with lesser strength, which leads to reduced peak strengths of the fading signals. Following the end of eclipse, there is a rapid increase in the strength of the signals and the fading. Throughout the night a large sig-nal strength accompanied by heavy fading continues, which is also seen on normal days. Thus, we can conclude that night-like field strength started to emerge almost 1 h earlier on the eclipse day than on the control days.
3.2.3 Rajkot-Ahmedabad (810 kHz) The field
Fig. 10. Daily variations in the signal strength of the riometer recorded over Ahmedabadon eclipse day (11 August 1999) and control days (10, 12 August 1999).
is found on control days at 1920 h, suggesting that as the eclipse progressed to a maximum, the sky wave also reached the receiver, leading to fading. It is also likely that deviative absorption increased during this period. After the eclipse had reached its maximum, within 10 min the signal strength rose suddenly. A unique record of signal strength record was obtained throughout the regress of the eclipse. The strength of the ground wave signal is maintained, but there is a heavy fading compared to control days. A normal night-type recording is obtained later at night, but it shows heavier fading than that on the control days. Thus, on the eclipse day a decreased signal with fading occurred during the main phase of eclipse (1730–1810 h). A similar recording occurs at the beginning of night on the control days.
3.2.4 Riometer The riometer signal strength
record-ings made at Ahmedabad are shown in Fig. 10. The signal strength decreases slowly from 1700 h to about 2000–2100 h on the control days (10 and 12 August). However, on the eclipse day, the recordings show an increase between 1730 to 1800 h. A higher signal is also seen on the eclipse night.
4.
Discussion
Field strength measurements of a 15.07-MHz transmis-sion from BBC (London) were made at Ahmedabad for the solar eclipse of 30 June 1954. An increase in the field strength was observed following the solar eclipse, and the time of maximum field strength matched with the time cor-responding to the maximum phase of the eclipse at the mid-point of the transmission path (Rastogi and Sherrif, 1955). For the solar eclipse of 16 February 1980, the field strength (11.8 MHz) measurements for the Colombo-Ahmedabad path showed an increase of about 23 db above the nor-mal value during the totality (Jani et al., 1982). Multi-frequency absorption measurements at Ahmedabad showed decreases of 40–45% (Patelet al., 1986). Phase and field measurements at VLF (16 kHz, Rugby) and HF (10 MHz ATA, New Delhi) and the field strength at LF (164 kHz, Tashkent) were also made at Kavalur in India during this event (Dixitet al., 1980). For the VLF transmission there was an increase in phase, with the maximum phase anomaly occurring at the eclipse maximum. This is due to the in-crease in the VLF reflection height that results from the de-crease in D-region ionization. The amplitudes of the LF
and HF signals also increased during the same time be-cause of the lower absorption as a result of the decrease in D-region ionization. For the solar eclipse of 24 Octo-ber 1995, measurements of absorption at 2.5 and 2.8 MHz at Ahmedabad showed a decrease that was associated with the eclipse (Lele et al., 1997a), and the field strength for the Colombo-Ahmedabad path (11.8 MHz) also showed an increase (Leleet al., 1997b). Ionspheric absorption mea-surements at 2.5 MHz at Delhi were also at a minimum during the eclipse of 24 October 1995 (Abraham et al., 1998). Thus, the ionosonde, LF/HF field strength and ri-ometer measurements reveal an eclipse-associated decrease of ionization in the ionospheric D-, E- and F1-regions.
Muller-Wodarg et al. (1998) modelled the effects of the total solar eclipse event of 11 August 1999 on the thermosphere-ionosphere using the Coupled-Thermosphere-Ionosphere-Plasmasphere Model (CTIP). Simulations were made for a height of 240 km, assuming a solar flux index of 190 and a magnetic activity index Kp of 2+. A decrease of about 45◦K in neutral temperature near the totality (50◦N) was predicted with a lag of 30 min. Neutral winds up to 26 m/s would be generated as a con-sequence. The generation of a gravity wave was also pre-dicted. For the region of 50◦N, 0◦longitude, an increase in [O] and an initial increase, followed by decreased level for several hours of [N2] were shown. These will result in an
increase of foF2by 0.2 MHz during the eclipse.
Fargeset al.(2001) reported results for the solar eclipse of 11 August 1999 from Western Europe based on a chain of 12 ionosondes within 5◦W and 5◦E longitudes. A 37% decrease in foF1was noted for a station with 100%
obscura-tion, while a decrease of 24%, was noted for a station with 71.6% obscuration. The decrease in foF2 was weak at all
the stations. The maximum decrease in foF1 at both
sta-tions occurred at the time of maximum obscuration, while the maximum decrease in foF2occurred with a delay of 20
64 H. CHANDRAet al.: IONOSPHERIC MEASUREMENTS DURING THE TOTAL SOLAR ECLIPSE OF 11 AUGUST 1999
maximum altitude was observed at 220 km. As the day was geomagnetically quiet, the source of gravity waves was assumed to be of eclipse origin. Ionosonde measurements were also made at Helston, Cornwall in UK for the total so-lar eclipse of 11 August 1999 (Daviset al., 2000). Sound-ings were made every 3 min from the Lowell DPS 1 digital ionosonde. When the electron concentration in the E-region on the control day (10 August 1999) is compared to that on eclipse day, there is a decrease of about 50% at the time of maximum obscuration.
A study of the eclipse-induced effects near the magnetic equator was also made using ionosonde, VHF radar and HF radar observations at Trivandrum for the solar eclipse event of 11 August 1999 (Sridharanet al., 2002). Audden intensification of the blanketing type of sporadic-E layer, an increase in h’F and distinctly different spatial and tem-poral structures in the irregularities of drift velocities (HF radar) were reported. The increase in h’F was attributed to the eclipse-induced reduction in ionization in the E-layer, thereby decreasing the conductivity of the conjugate E-region in the path of totality connected to the F-E-region over the magnetic equator along the magnetic field lines. As such, the local conditions reduced the E-region loading of the F-region dynamo, resulting in a larger post-sunset in-crease of the F-region. An examination of the results also show that high values of fbEs at Thumba between 1615 h
and 1630 h. The period of 1 h between the two sudden in-tensifications of sporadic-E is similar to the periodicity of about 1 h observed over Ahmedabad.
5.
Conclusion
1. The ionosonde, LF/HF field strength and riometer measurements show an eclipse-associated decrease in ion-ization in the D-, E- and F1-regions of the ionosphere.
2. A strong blanketing type of sporadic-E was noted throughout the day. The wave-like features with a period of about 1 h is visible in the variation of fbEs.
3. There is no significant variation in h’F on the eclipse day and control days. However, there is an indication of lower hpF2 (height of maximum ionization), suggesting a
decreased thickness of F2layer.
Acknowledgments. The authors would like to thank Prof. G. S. Agarwal, ex-Director of the PRL for permission and providing the logistics to install and operate the Riometer at the Thaltej campus of PRL. Thanks are due to Shri M. B. Dadhania, Mrs. Bharati Bhatt and Mrs. Manisha Pandya for maintenance of the ionosonde
and the scaling of ionograms and to Prof. R. G. Rastogi for his valuable discussions. The work at PRL was supported by the Department of Space, Government of India.
References
Abraham, S., S. K. Dhaka, N. Nath, and K. L. Baluja, Ionospheric absorp-tion on October 24, 1995 solar eclipse,Geophy. Res. Lett.,25, 2945– 2947, 1998.
Altadill, D., J. G. Sole, and E. M. Apostolov, Vertical structure of a gravity wave like oscillation in the ionosphere generated by the solar eclipse of August 11, 199,J. Geophys. Res.,106, 21419–21428, 2001.
Chandra, H., G. Sethia, G. D. Vyas, M. R. Deshpande, and H. O. Vats, Ionospheric effects of the total solar eclipse of 16 February 1980 ob-served over Ahmedabad,Indian J. Radio Space Phys.,10, 45–48, 1981. Chandra, H., G. D. Vyas, and S. Sharma, Ionospheric effects of the total solar eclipse of 24 October 1995 over Ahmedabad,Indian J. Radio Space Phys.,26, 30–35, 1997.
Davis, C. J., M. Lockwood, S. A. Bell, J. A. Smith, and E. M. Clarke, Ionospheric measurements of relative coronal brightness during the total solar eclipses of 11 August, 1999 and 9 July, 1945,Ann. Geophys.,18, 182–190, 2000.
Dixit, P. S., P. K. Rao, R. V. Bhonsle, G. Sethia, M. R. Deshpande, and H. Chandra, Phase and field measurements at VLF, LF and HF during the solar eclipse of February 16, 1980—Preliminary results,Bull. Astron. Soc. India,8, 145–148, 1980.
Farges, T., J. C. Jadogne, R. Bamford, Y. Le Roux, F. Gauthier, P. M. Vila, D. Altadill, J. G. Sole, and G. Miro, Disturbances of the western European ionosphere during the total solar eclipse of 11 August 1999 measured by a wide ionosonde and radar network,J. Atmos. Solar-Terrest. Phys.,63, 915–924, 2001.
Jani, K. G., G. Datta, D. B. Patel, and K. M. Kotadia, Ionospheric radio effects of the solar eclipse on 16 February 1980,Proc. Ind. Natn. Acad. Sci.,48A, 316–324, 1982.
Lele, P. D., K. G. Jani, and A. P. Patel, Multifrequency vertical incidence (A-1 method) absorption measurements at Ahmedabad during total so-lar eclipse of October 1995,Kodaikanal Obs. Bull.,13, 209–212, 1997a. Lele, P. D., K. G. Jani, and A. P. Patel, Field strength measurements A-3 method (Oblique incidence) absorption at Ahmedabad during total solar eclipse of October 1995,Kodaikanal Obs. Bull.,13, 213–216, 1997b. Muller-Wodarg, I. C. F., A. D. Aylward, and M. Lockwood, Effects of
a mid-latitude solar eclipse on the thermosphere and ionosphere—A modelling study,Geophys. Res. Lett.,25, 3787–3790, 1998.
Patel, D. B., K. M. Kotadia, P. D. Lele, and K. G. Jani, Absorption of radio waves during a solar eclipse,Proc. Indian Acad. Sci.,95, 193– 200, 1986.
Rastogi, R. G. and R. M. Sheriff, A note on radio field strength obser-vations made at Ahnmedabad during the total solar eclipse on 30 June 1954,J. Sci. Indust. Res.,14A, 159–161, 1955.
Rishbeth, H., Solar eclipses and ionospheric theory,Space Sci. Rev,8, 543– 554, 1968.
Sridharan, R., C. V. Devasia, N. Jyoti, D. Tiwari, K. S. Viswanathan, and K. S. V. Subbarao,Ann. Geophys.,20, 1977–1985, 2002.