Possible TCRM acquisition of the Kilauea 1960 lava, Hawaii: failure of the
Thellier paleointensity determination inferred from equilibrium
temperature of the Fe-Ti oxide
Yuhji Yamamoto∗
Geological Survey of Japan, AIST, Tsukuba, Ibaraki 305-8567, Japan
(Received February 17, 2006; Revised April 14, 2006; Accepted April 15, 2006; Online published September 16, 2006)
Natural rock samples may not always be the ideal material for the Thellier-type method as they occasionally result in high paleointensities. The Kilauea 1960 lava, Hawaii, is one such example. Several previous studies have suggested that one of the possible causes for this undesirable behavior is an acquisition of thermochemical remanent magnetization (TCRM) during lava formation. In order to examine this possibility quantitatively, equilibrium temperatures of titanomagnetite grains, which are associated with samples previously subjected to Thellier experiments, are estimated by a Fe-Ti oxide geothermometer. The results show that two specimens from the rock magnetic group giving relatively ideal Thellier paleointensities have clustered equilibrium temperatures of about 800–900 and 700–800◦C. In contrast, two swarmed temperatures around 300 and 700◦C were observed for the specimen from a group yielding high paleointensities. Although these are semi-quantitative estimates, when the time scales of Fe-Ti interdiffusion and lava cooling are taken into consideration, the last specimen could have acquired the TCRM during its formation. For such specimens, simple calculation predicts that TCRM/TRM (thermoremanent magnetization) ratios could be 1.19–1.72 for the blocking temperature range of 400–480◦C, assuming a grain-growth model. The extent of this overestimation (20–70%) is comparable to the magnitude of the observations. It is therefore suggested that attention be paid to titanomagnetite grains with well-developed ilmenite lamellae, as these could be potential sources of overestimations of Thellier paleointensities of up to a few tenths of percentage points.
Key words: Thermochemical remanent magnetization (TCRM), Thellier method, Hawaii, high temperature oxidation, geothermometer.
1.
Introduction
The ability to make precise determinations of absolute paleointensities is an essential criterion for investigating the evolution of the geodynamo, as this in turn provides in-formation on the Earth’s core. To date, the Thellier-type method (e.g. Thellier and Thellier, 1959; Coe, 1967) has been the most frequently used method and the one consid-ered to be the most reliable by many paleomagnetists (e.g. Valet, 2003). However, natural rock samples may not al-ways be the ideal material for this method: evidence is ac-cumulating which indicates that the Thellier-type method is not always robust for historical lava flows, resulting in systematic high paleointensities (e.g. Hill and Shaw, 2000; Calvoet al., 2002; Yamamotoet al., 2003; Mochizukiet al., 2004; Oishiet al., 2005). New protocols or strict criteria for obtaining reliable Thellier paleointensities have been pro-posed, and the outcomes obtained with these protocols ap-pear to be successful (e.g. Biggin and Thomas, 2003; Chau-vinet al., 2005; Yu and Tauxe, 2005).
∗Now at: Geomagnetism Laboratory, The University of Liverpool,
Liverpool L69 7ZE, UK.
Copyright cThe Society of Geomagnetism and Earth, Planetary and Space Sci-ences (SGEPSS); The Seismological Society of Japan; The Volcanological Society of Japan; The Geodetic Society of Japan; The Japanese Society for Planetary Sci-ences; TERRAPUB.
Independent of these improvements, it is important to investigate the cause of the high Thellier paleointensities. Several possibilities have been proposed: multi-domain (MD) or pseudo-single domain (PSD) effects (e.g. Levi, 1977; Kosterov and Prev´ot, 1998; Calvo et al., 2002; Xu and Dunlop, 2004), cooling-rate effect (e.g. Dodson and McClelland, 1980; Fox and Aitken, 1980; Tauxe, 2006), magnetic interaction between particles (e.g. Mank-inen and Champion, 1993; Mochizukiet al., 2004), among others. One possible cause which has been proposed is the acquisition of thermochemical remanent magnetization (TCRM), which is the magnetization acquired when slow cooling is accompanied by volume growth of a magnetic phase below its Curie temperature (Dunlop and ¨Ozdemir, 1997). Gromm´eet al.(1969) first pointed out that in some basaltic lavas the magnetic minerals may form through subsolidus reactions at temperatures well below their fi-nal Curie temperatures, resulting in a mixture of thermore-manent magnetization (TRM) and TCRM. Kellog et al. (1970) subsequently concluded that paleointensity experi-ments could give reasonable values even if TCRM provided a considerable part of the natural remanent magnetization (NRM). However, McClelland (1996) numerically showed that grain-growth CRM (crystallization remanent magneti-zation) at high temperatures could result in an overestima-tion of the paleointensity.
50 μm
3) TM44, C3
66.7 μm 50 μm
5) TM59, C2 9) TM61, C2
Fe map
50 μm 66.7 μm 133.3 μm
3) ILM90, R1 4) ILM94, R2 5) ILM92, R2 (A) BEIs of titanomagnetite grains
(B) BEIs of titanohematite grains
Ti map
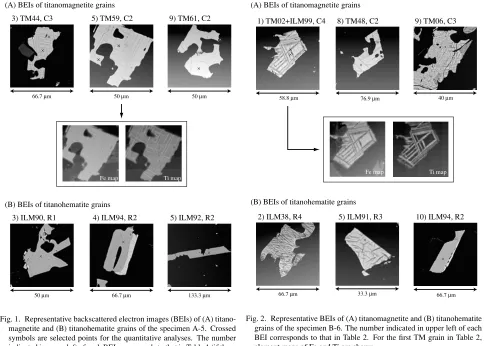
Fig. 1. Representative backscattered electron images (BEIs) of (A) titano-magnetite and (B) titanohematite grains of the specimen A-5. Crossed symbols are selected points for the quantitative analyses. The number indicated in upper left of each BEI corresponds to that in Table 1 (if there are two analyzed points in each BEI, averaged chemical compositions are indicated in the table). The Ti-rich component in the titanomag-netite (TM) or titanohematite (TH) phase and the identified oxidation index (C1–C7 or R1–R7 by Haggerty (1991)) are also shown. For the fifth TM grain in Table 1, element maps of Fe and Ti are displayed.
Yamamotoet al.(2003) obtained a number of high Thel-lier paleointensities from the Kilauea 1960 lava, Hawaii. Their samples showed different degrees of high temperature oxidation and, consequently, could be classified into rock magnetic groups of A, B, and C based on increasing levels of oxidation. The group B samples were characterized by an abundance of Ti-poor titanomagnetites (TMs) with well-developed ilmenite lamellae. Since these samples showed particularly high paleointensities, Yamamotoet al.(2003) suggested that the anomalous paleointensities could origi-nate from the TCRM.
It is important to examine this hypothesis in a more quan-titative fashion. One possible approach is to estimate the equilibrium temperature of iron-titanium (Fe-Ti) oxides us-ing a geothermometer. A probable pre-condition for ac-quisition of the TCRM is if the temperature for a certain TM grain coexisting with exsolved ilmenite lamellae is be-low its Curie temperature. Although several types of Fe-Ti oxide geothermometers are available (e.g. Buddington and Lindsley, 1964; Ghiorso and Sack, 1991), that of Ghiorso (1997) is the only one incorporating a concept of mag-netic ordering. For example, an equilibrium temperature for coexisting Fe2.95Ti0.05O4(TM05, 5 mol% of ulv¨ospinel)
and Fe1.04Ti0.96O3(ILM96, 96 mol% of ilmenite) is 290◦C
1) TM02+ILM99, C4 8) TM48, C2 9) TM06, C3
2) ILM38, R4 5) ILM91, R3 10) ILM94, R2 (A) BEIs of titanomagnetite grains
(B) BEIs of titanohematite grains
76.9 μm 40 μm
66.7 μm 66.7 μm 33.3 μm
Fe map Ti map
Fig. 2. Representative BEIs of (A) titanomagnetite and (B) titanohematite grains of the specimen B-6. The number indicated in upper left of each BEI corresponds to that in Table 2. For the first TM grain in Table 2, element maps of Fe and Ti are shown.
(Ghiorso, 1997), which is about 250◦C lower than the Curie temperature of TM05 (estimated from a formula by Nagata (1962)), indicating a probable condition of the TCRM ac-quisition.
In this paper, I attempt to estimate the equilibrium tem-peratures of TM grains involved in the samples used in the paleointensity study by Yamamoto et al. (2003) (Kilauea 1960 lava, Hawaii). Based on the results, I discuss the re-lationship between the equilibrium and Curie temperatures of the samples. These estimations require that the chemi-cal compositions of both TM hosts and coexisting ilmenite lamellae be determined and are undertaken by a combined approach of analyses by an electron probe micro-analyzer (EPMA) and measurements of magnetic susceptibilities at both low and high temperatures.
2.
Samples
The samples subjected to the present analyses had been collected for the study of Yamamotoet al. (2003). They were drilled from an outcrop of the Kilauea 1960 lava, Hawaii, and were classified into three groups (A, B, and C) according to increasing high temperature oxidation states (C1–C3, C2–C4, and C4–C7; Haggerty (1991)). Haggerty (1991) defined the stages of high-temperature oxidation in TM and titanohematite (TH) grains as follows.
<Titanomagnetite grains>
C1: Optically homogeneous ulv¨ospinel-rich magnetite solid solutions (ss);
“ex-Table 1. EPMA analytical results for the specimen A-5. Results are shown for the TM phase of 11 titanomagnetite grains (1–11) and the TH phase of nine titanohematite grains (1–9). As for the latter, average composition (Ave.) is also shown. Compositions of Fe2O3 and FeO are calculated
from total Fe following Carmichael (1967). Molecular fractions of ulv¨ospinel or ilmenite in titanomagnetite or titanohematite (Ti-rich comp.) are determined by a procedure by Anderson (1968).
Titanomagnetite
1) 2) 3) 4) 5) 6) 7) 8) 9) 10) 11)
SiO2 0.18 0.20 0.16 0.21 0.19 0.19 0.22 0.22 0.19 0.16 0.24
TiO2 19.39 16.28 14.17 17.18 20.44 19.25 19.06 17.75 21.29 20.76 16.02
Al2O3 1.65 2.24 2.24 1.59 1.78 1.55 1.66 1.86 1.75 1.92 2.12
MnO 0.26 0.27 0.26 0.32 0.25 0.29 0.28 0.31 0.21 0.30 0.29
MgO 1.23 0.83 0.58 0.80 1.22 1.20 0.97 0.90 1.37 1.21 0.80
CaO 0.03 0.20 0.08 0.14 0.09 0.12 0.05 0.25 0.13 0.12 0.35
Cr2O3 0.09 0.09 0.10 0.06 0.07 0.03 0.06 0.03 0.01 0.03 0.09
FeO 69.65 70.45 73.81 73.12 70.90 72.41 71.51 72.22 69.60 71.03 74.03
Total 92.48 90.54 91.39 93.40 94.94 95.04 93.81 93.53 94.56 95.54 93.93
Fe2O3 26.39 30.44 35.34 31.48 25.87 28.74 27.83 30.13 24.04 25.58 33.53
FeO 45.91 43.05 42.00 44.79 47.62 46.54 46.47 45.11 47.97 48.01 43.86
Total 95.12 93.59 94.93 96.56 97.53 97.92 96.60 96.55 96.97 98.11 97.28
Ti-rich comp. 0.57 0.52 0.44 0.52 0.59 0.55 0.55 0.54 0.61 0.59 0.49
Titanohematite
1) 2) 3) 4) 5) 6) 7) 8) 9) Ave.
SiO2 0.09 0.11 0.12 0.08 0.15 0.16 0.09 0.14 0.13 0.12
TiO2 47.32 46.93 46.86 49.00 48.26 48.82 49.17 49.28 50.71 48.48
Al2O3 0.15 0.13 0.21 0.16 0.16 0.19 0.18 0.17 0.12 0.16
MnO 0.26 0.35 0.32 0.33 0.33 0.40 0.24 0.42 0.42 0.34
MgO 1.47 1.81 1.53 1.97 1.51 1.62 1.45 1.50 2.13 1.66
CaO 0.10 0.26 0.07 0.09 0.09 0.19 0.10 0.12 0.07 0.12
Cr2O3 0.06 0.05 0.05 0.00 0.00 0.04 0.01 0.07 0.04 0.04
FeO 47.15 47.04 47.62 45.77 47.66 46.95 47.35 47.12 46.45 47.01
Total 96.59 96.66 96.78 97.41 98.15 98.36 98.59 98.81 100.08 97.94
Fe2O3 8.32 9.55 9.41 6.19 7.99 7.09 6.64 6.52 5.56 7.47
FeO 39.66 38.44 39.15 40.20 40.46 40.57 41.38 41.26 41.45 40.29
Total 97.42 97.62 97.72 98.03 98.95 99.07 99.26 99.46 100.63 98.69
Ti-rich comp. 0.91 0.90 0.90 0.94 0.92 0.93 0.93 0.93 0.94 0.92
solved” ilmenite lamellae parallel to 111 of the host; C3: Ti-poor titanomagnetitesswith densely crowded
“ex-solved” ilmenite lamellae parallel to 111;
C4: The first sign of additional oxidation; optically, an indistinct mottling of the ilmenomagnetite intergrowth is observed;
C5: Rutile+titanohematite develop extensively within the “exsolved” metailmenite lamellae;
C6: Incipient formation of pseudobrookitess(Psbss) from
rutile+titanohematite;
C7: Assemblage of Psbss +hematitess; most advanced
stage of oxidation of original spinels.
<Titanohematite grains> R1: Homogenous ilmenite;
R2: Onset of fine wisp-like sigmoidal lenses of ferrian rutile;
R3: The lenses become thicker and more abundant; R4: Marked reflectivity in both the host and the lamellar components;
R5: Extensive development of rutile and titanohematite; R6: Development of Psbssfrom the R5 assemblage;
R7: Predominance of pseudobrookite.
In Yamamotoet al.(2003), the Coe’s version of the Thel-lier method (ThelThel-lier and ThelThel-lier, 1959; Coe, 1967) was applied to 19 core samples. These paleointensities (av-erages and standard deviations) resulted in 41.9±4.2 μT (n =4), 56.0±7.6μT (n =9), and 40.6±3.2μT (n =4) for the A, B, and C groups, respectively (Yamamoto et al., 2003). All of the values exceeded the expected value (36.2μT), and the group B samples gave particularly high Thellier paleointensities. The analyses reported here were mainly conducted on a representative sample from each group. Unheated parts of samples A-5, B-6, and C-1 were cut into several pieces and subjected to the EPMA analyses or the susceptibility measurements.
3.
EPMA Analyses
Table 2. EPMA analytical results for the specimen B-6. Results are shown for the coexisting TM and TH phases of six titanomagnetite grains (1–6), the TM phase of seven titanomagnetite grains (7–13), and the TH phase of 16 titanohematite grains (1–16).
Titanomagnetite+Titanohematite
1) TM TH 2) TM TH 3) TM TH 4) TM TH 5) TM TH 6) TM TH
SiO2 0.17 0.19 0.17 0.20 0.15 0.18 0.12 0.18 0.13 0.12 0.17 0.23
TiO2 1.51 48.76 2.58 29.42 1.71 45.62 1.25 32.89 14.40 48.74 8.15 45.47
Al2O3 1.01 0.44 4.32 1.27 2.98 0.37 1.54 2.08 1.83 0.05 2.85 0.27
MnO 0.16 0.34 0.03 0.19 0.08 0.48 0.99 0.32 0.26 0.44 0.05 0.35
MgO 0.73 1.16 1.48 0.82 0.84 1.48 1.57 1.51 0.61 1.55 0.54 1.41
CaO 0.05 0.06 0.15 0.25 0.13 0.33 0.05 0.14 0.14 0.25 0.11 0.32
Cr2O3 0.08 0.11 0.08 0.09 0.10 0.05 0.06 0.02 0.07 0.01 0.12 0.00
FeO 85.78 41.91 79.79 57.75 82.15 44.78 84.48 53.72 74.86 45.35 78.48 45.28
Total 89.48 92.95 88.59 89.99 88.13 93.28 90.05 90.87 92.29 96.51 90.47 93.33
Fe2O3 61.82 0.34 55.20 36.70 58.03 7.85 62.76 30.14 36.19 5.43 46.30 8.19
FeO 30.15 41.61 30.12 24.73 29.93 37.71 28.01 26.60 42.29 40.47 36.82 37.90
Total 95.67 92.98 94.12 93.67 93.95 94.07 96.34 93.88 95.92 97.05 95.11 94.15
Ti-rich comp. 0.02 1.00 0.09 0.60 0.05 0.92 0.04 0.66 0.44 0.95 0.26 0.91
Titanomagnetite Titanohematite
7) 8) 9) 10) 11) 12) 13) 1) 2) 3) 4) 5)
SiO2 0.17 0.17 0.14 0.18 0.12 0.15 0.17 0.08 0.11 0.13 0.08 0.12
TiO2 1.96 15.16 1.95 10.71 1.09 16.05 8.15 46.21 23.15 39.56 45.02 46.88
Al2O3 3.48 1.98 3.01 2.13 3.38 1.80 2.85 0.10 0.18 0.15 0.15 0.12
MnO 0.09 0.20 0.22 0.31 1.31 0.26 0.05 0.53 0.59 0.67 0.90 0.62
MgO 0.81 0.65 1.38 0.47 2.57 0.81 0.54 2.28 3.11 3.06 3.72 2.13
CaO 0.11 0.13 0.00 0.03 0.14 0.20 0.11 0.12 0.05 0.25 0.20 0.11
Cr2O3 0.10 0.08 0.08 0.10 0.06 0.11 0.12 0.06 0.01 0.07 0.01 0.05
FeO 82.58 71.95 83.55 76.95 80.10 73.16 78.48 46.12 62.70 50.12 44.05 45.37
Total 89.29 90.31 90.32 90.87 88.77 92.54 90.47 95.49 89.90 93.99 94.13 95.41
Fe2O3 57.67 32.88 59.46 42.14 60.40 33.02 46.30 10.23 53.28 23.15 12.51 8.48
FeO 30.69 42.37 30.05 39.03 25.75 43.45 36.82 36.92 14.76 29.29 32.80 37.74
Total 95.07 93.61 96.28 95.10 94.82 95.84 95.11 96.52 95.24 96.31 95.38 96.26
Ti-rich comp. 0.06 0.48 0.06 0.33 0.03 0.49 0.26 0.89 0.38 0.74 0.86 0.91
Titanohematite
6) 7) 8) 9) 10) 11) 12) 13) 14) 15) 16)
SiO2 0.19 0.09 0.11 0.08 0.12 0.21 0.08 0.10 0.06 0.11 0.10
TiO2 1.64 20.41 42.08 48.11 48.94 0.51 47.11 47.90 49.43 44.83 49.27
Al2O3 0.06 0.16 0.17 0.12 0.13 0.13 0.06 0.14 0.08 0.15 0.12
MnO 0.02 0.55 0.42 0.22 0.38 0.00 0.86 0.34 0.56 0.58 0.41
MgO 0.13 2.21 2.53 1.59 1.77 0.07 3.48 1.71 2.28 2.63 1.88
CaO 0.12 0.09 0.19 0.12 0.09 0.05 0.08 0.16 0.11 0.16 0.08
Cr2O3 0.00 0.00 0.03 0.01 0.03 0.03 0.08 0.00 0.04 0.06 0.10
FeO 84.30 65.88 49.07 46.79 45.25 85.74 44.42 46.03 44.76 44.77 45.96
Total 86.46 89.37 94.60 97.04 96.71 86.74 96.17 96.36 97.32 93.29 97.91
Fe2O3 92.25 57.80 18.07 7.35 5.27 94.70 10.13 7.11 5.55 10.87 5.98
FeO 1.29 13.87 32.81 40.17 40.51 0.52 35.31 39.63 39.77 34.99 40.57
Total 95.70 95.16 96.41 97.78 97.24 96.23 97.19 97.07 97.87 94.38 98.51
Ti-rich comp. 0.03 0.35 0.80 0.93 0.94 0.01 0.89 0.93 0.94 0.88 0.94
(BEIs) were captured. Several points were selected in each grain and these were subjected to analyses of chemical com-position. Quantitative analyses were performed using a WDS (wavelength dispersive X-ray spectrometer) with a focused beam (15 kV accelerating voltage and 12 nA
Mn and Cr was 30 s. Fe2O3 and FeO constituents were
calculated from total Fe following Carmichael (1967), as-suming stoichiometry of TM or TH phases. The molecu-lar fractions of ulv¨ospinel and ilmenite were determined by a procedure developed by Anderson (1968). These com-putations were processed using ILMAT (Lepage, 2003). In subsequent sections of this article the chemical com-positions of TM and TH solid solutions are expressed as TMx (Fe3−0.01x-Ti00.01x-O4) and ILMy (Fe2−0.01y-Ti0.01
y-O3), respectively. Although some of the assumptions used
in Carmichael (1967) have been called into question in more recent studies (e.g. Stormer, 1983), the recalculations re-ported in this article did not result in significant differences in Fe2O3compositions.
Eleven TM and nine TH grains were observed on the A-5 slice. Representative BEIs are shown in Fig. 1. All of the TM grains showed low-grade high temperature ox-idation (C2–C3), which is visually recognizable from the element maps of Fe and Ti for a C2-class grain (Fig. 1, A5). The compositions of the hosts corresponded to TM44– TM61 (Table 1), while associated ilmenite lamellae were too narrow to be analyzed by the focused beam. The TH grains also exhibited low-grade high temperature oxidation (R1–R2), the compositions of which were determined to be ILM90–ILM94 (Table 1).
Observations were made on 13 TM and 16 TH grains of the B-6 slice. High-temperature oxidation states were in-termediate in degree, typically C2–C4 and R1–R4. Repre-sentative BEIs and element maps of Fe and Ti are shown in Fig. 2. Quantitative analyses revealed that the compo-sitions of the TM hosts ranged between TM02 and TM49, although about one-half of these resulted in TM02–TM09. The widths of the exsolved ilmenite lamellae of six of the 13 TM grains appeared to be large, and their compositions were determined to be ILM91–ILM100, with the exception of two grains. For the TH grains, 12 grains resulted in com-positions of ILM74–ILM94, with the remainder showing more oxidized compositions. These analytical results are summarized in Table 2.
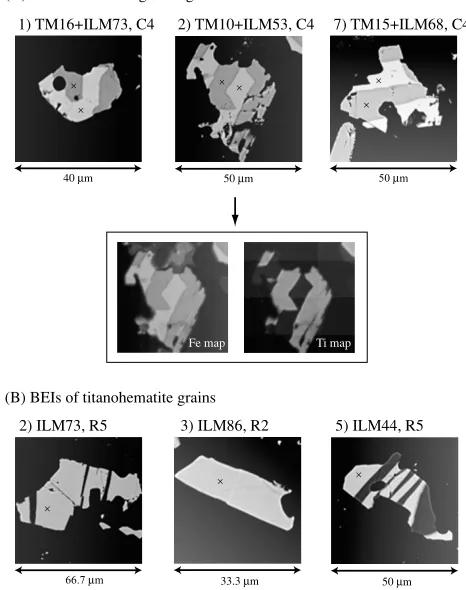
Both seven TM and TH grains were observed for the slice of C-1. Although there are many TM and TH grains with C6–C7 and R6–R7 oxidation, these were excluded from the present analysis because the pseudobrookite phase (generally involved in C6–C7 TM and R6–R7 TH grains) does not contribute to the Fe-Ti oxide geothermometry. All of the TM grains observed showed a sandwich-type high-temperature oxidation: large TM hosts associated with broad ilmenite lamellae (Fig. 3A). The compositions of the hosts and the lamellae were determined to be TM10– TM16 and ILM53–ILM73, respectively (Table 3). Element maps of Fe and Ti indicate that the host is almost free of Ti (Fig. 3A, 2). It is difficult to simply classify the oxidation indices of these grains. However, they could be categorized as a C4 oxidation state if the lamellae compositions were to be taken into account (in a mid-course of hematization). The TH grains exhibited two groups of oxidations: R1–R2 for three grains and R5–R7 for four grains. The chemical compositions are ILM44–ILM96 (Table 3).
The quality of the analytical results presented here is not actually that good because they show relatively low totals.
1) TM16+ILM73, C4 2) TM10+ILM53, C4 7) TM15+ILM68, C4
2) ILM73, R5 3) ILM86, R2 5) ILM44, R5 (A) BEIs of titanomagnetite grains
(B) BEIs of titanohematite grains
50 μm 40 μm
50 μm 33.3 μm
Fe map Ti map
Fig. 3. Representative BEIs of (A) titanomagnetite and (B) titanohematite grains of the specimen C-1. The number indicated in upper left of each BEI corresponds to that in Table 3. For the second TM grain in Table 3, element maps of Fe and Ti are shown.
Even after redistributing iron as Fe3+ and Fe2+, the total
resulted in 93.6–98.1% and 93.0–100.6% for the TM and TH phase, respectively (Tables 1–3). There are two possi-ble explanations for this. One is a moderate stability of the WDS equipment at the time of the analyses. A once-a-day quantitative analysis was performed on a laboratory stan-dard sample (hornblende) in the present study. A series of results is listed in Table 4. While an average of five mea-surements almost corresponds to a reference value (which is determined from a wet analysis), there is a standard devi-ation (1σ) of 1.4% in a total value, which means that there is approximately a 3% uncertainty (2σ) in the present an-alytical results. Recalculations of iron can further propa-gate this error, possibly yielding the low total. The sec-ond explanation is that dehydration of the slices might be insufficient at a sample preparation stage. In this case, a small amount of H2O may remain on the surface of the
slices. The samples contained a very small proportion of H2O (few percentage), which could cause the low total. The
extent of the uncertainties could produce approximately a 1 and 2 mol% error in the calculation of ulv¨ospinel and il-menite content in the TM and TH solid solutions, respec-tively. However, if the extent of these errors is taken into account, semi-quantitative discussions using the present re-sults would seem to be possible.
The experimentally determined compositions of the TM and the TH grains are illustrated in FeO-TiO2-Fe2O3ternary
composi-Temperature (K)
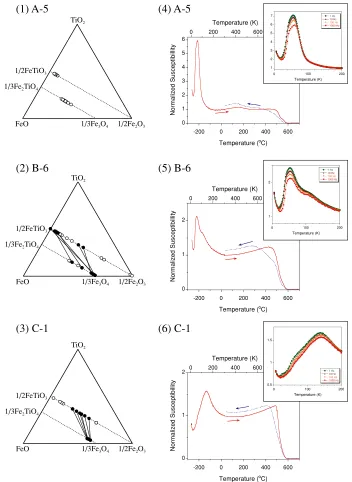
Fig. 4. (1–3) FeO-TiO2- Fe2O3ternary diagrams of the specimens A-5, B-6, and C-1. They illustrate the chemical compositions of the TM and the
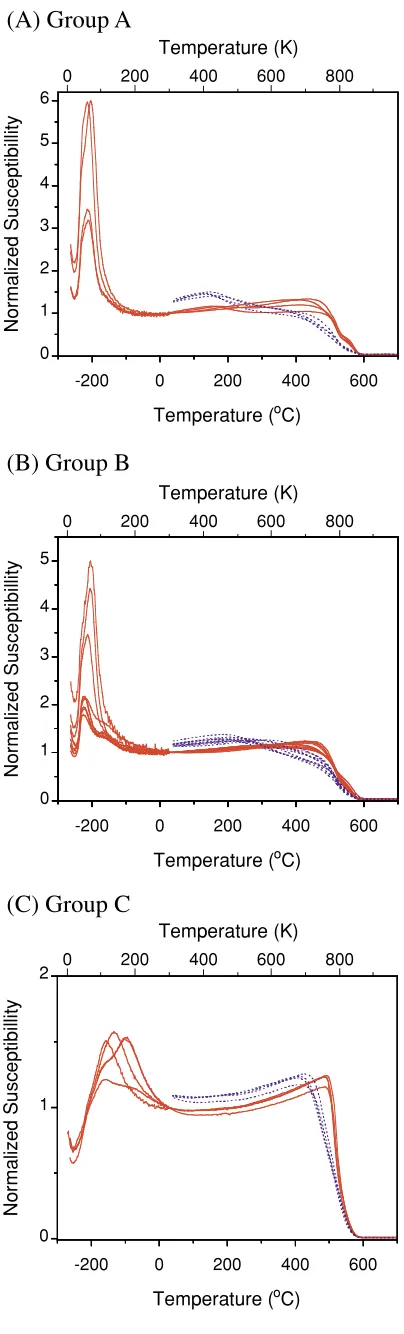
TH grains determined by the EPMA analyses. Filled (open) circles are the analytical results of the host TM and lamellar TH phases (discrete TM and TH phases). (4–6) Magnetic susceptibility curves of the specimens A-5, B-6, and C-1. The curves are composed of the results of low-temperature and high-temperature runs. Both are normalized by susceptibility values at room temperature. Solid (dashed) lines in each lower left figure represent heating (cooling) curves in the high-temperature runs. Note that the low-temperature measurements were conducted with variable frequencies of 1, 10, 100 and 1000 Hz, and those at 1000 Hz are only indicated with the high-temperature results.
tions of both the TM host and the lamellar TH phase, while the open symbols show those of other phases. It is obvious that high-temperature oxidation progresses in the order of A-5, B-6, and C-1 because the symbols in the ternary di-agrams move towards the lower right region in this order. This conclusion is the same as that drawn by Yamamotoet al.(2003).
4.
Low- and High-Temperature Magnetic
Suscep-tibilities
For a temperature range of 30 to 700◦C, low-field suscep-tibilities were measured for powdered fractions from
Table 3. EPMA analytical results for the specimen C-1. Results are shown for the coexisting TM and TH phases of seven titanomagnetite grains (1–7) and the TH phase of seven titanohematite grains (1–7).
Titanomagnetite+Titanohematite
1) TM TH 2) TM TH 3) TM TH 4) TM TH 5) TM TH 6) TM TH
SiO2 0.21 2.68 0.14 0.11 0.16 0.11 0.18 0.10 0.20 0.12 0.19 0.12
TiO2 4.98 37.71 3.20 28.43 4.85 33.24 3.25 30.64 4.42 34.53 4.13 36.22
Al2O3 3.27 0.47 3.86 0.54 3.22 0.48 3.38 0.45 3.08 0.36 3.30 0.36
MnO 0.20 0.27 0.27 0.18 0.20 0.21 0.17 0.18 0.22 0.21 0.23 0.30
MgO 1.46 2.64 1.73 2.02 1.42 2.06 1.33 2.14 1.58 2.64 1.56 2.87
CaO 0.17 0.29 0.04 0.09 0.09 0.08 0.09 0.11 0.16 0.18 0.13 0.09
Cr2O3 0.08 0.05 0.09 0.09 0.08 0.05 0.16 0.07 0.13 0.04 0.08 0.06
FeO 79.80 50.49 81.72 59.85 80.15 58.43 82.13 58.14 81.34 55.76 80.17 55.31
Total 90.16 94.60 91.04 91.31 90.16 94.66 90.69 91.83 91.14 93.84 89.80 95.32
Fe2O3 52.62 20.80 56.51 42.28 53.04 36.00 56.34 38.44 54.76 33.00 54.16 31.25
FeO 32.45 31.77 30.88 21.81 32.42 26.04 31.44 23.55 32.06 26.06 31.44 27.19
Total 95.43 96.69 96.70 95.55 95.48 98.27 96.33 95.68 96.62 97.14 95.22 98.45
Ti-rich comp. 0.16 0.73 0.10 0.53 0.15 0.62 0.10 0.58 0.14 0.64 0.13 0.66
Titanohematite
7) TM TH 1) 2) 3) 4) 5) 6) 7)
SiO2 0.32 0.34 0.12 0.12 0.14 0.11 0.26 0.35 0.27
TiO2 4.91 37.22 45.39 40.01 46.55 46.65 26.11 33.03 48.02
Al2O3 3.04 0.35 0.23 0.29 0.30 0.29 0.50 0.54 0.50
MnO 0.23 0.28 0.38 0.45 0.39 0.35 0.43 0.27 0.31
MgO 1.56 2.83 2.94 4.15 3.74 3.79 3.46 2.64 3.32
CaO 0.07 0.08 0.01 0.07 0.24 0.15 0.25 0.12 0.22
Cr2O3 0.10 0.06 0.08 0.04 0.00 0.04 0.08 0.05 0.03
FeO 82.08 54.28 48.43 49.30 46.66 44.32 60.36 55.40 40.44
Total 92.31 95.44 97.59 94.43 98.02 95.69 91.44 92.39 93.10
Fe2O3 54.38 28.70 14.55 23.45 13.31 10.58 48.33 33.80 3.80
FeO 33.16 28.45 35.34 28.19 34.69 34.80 16.87 24.99 37.02
Total 97.76 98.31 99.05 96.78 99.35 96.75 96.28 95.78 93.49
Ti-rich comp. 0.15 0.68 0.84 0.73 0.86 0.88 0.44 0.62 0.96
and the results are shown in Fig. 4. In the figure, the sus-ceptibilities are normalized by the room temperature values. Although results of the high-temperature runs displayed slight irreversible thermomagnetic curves (Fig. 4 (4)–(6)), these curves are considered to result from the reducing at-mosphere (argon gas flow), and even more reversible curves would be obtained if the measurements were done in the air. In fact, most of the present samples showed positive pTRM checks up to about 500–600◦C in the previous Thellier ex-periment conducted in the air (Yamamotoet al., 2003).
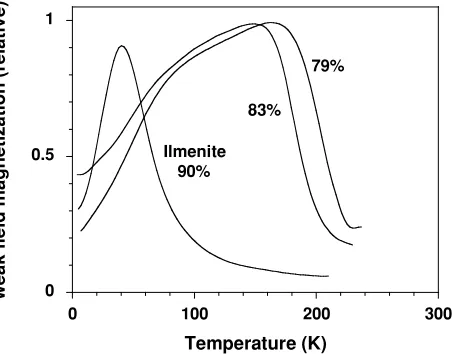
The result of A-5 (Fig. 4 (4)) showed a sharp peak at 60 K, a bump at 160◦C, and two phases of decrease at∼500◦C and 550◦C, respectively. The first peak is probably due to an emergence of a magnetic phase transition that occurred in the Ti-rich TH phase. This is because the N´eel temper-ature of the ilmenite (end-member of TH phase) is 55 K (Ishikawa and Akimoto, 1985), and the present peak ap-pears to be analogous to a temperature-dependent variation in a weak field magnetization of ILM90 (Fig. 5, modified from Ishikawaet al.(1985)). In fact, the EPMA analyses clearly demonstrated that the TH phase of A-5 corresponds to ILM90-94. The bump at∼160◦C seems to originate from the TM phase. The EPMA analyses confirmed that there are
TM grains with the composition of TM44–TM61 in A-5. According to Nagata (1962), the Curie temperatures of this phase are 138–261◦C, which are capable of explaining the bump. The remaining decrease at 500◦C and 550◦C cannot be explained by the EPMA results, but they may come from Ti-poor TM grains that are too tiny to be analyzed by the EPMA (smaller than 2–3μm, the spot size of the beam).
Table 4. EPMA analytical results for the laboratory standard sample. Once-a-day measurements were preformed five times, and their aver-age and standard deviation is shown with a reference value which is previously determined by a wet analysis. Note that the sample contains a few percent of H2O.
Hornblende
02/19 03/08 03/11 03/19 03/22 ave. stdev. wet SiO2 38.10 40.31 40.23 39.48 39.42 39.51 0.89 40.4
TiO2 5.78 5.67 5.56 5.71 5.65 5.68 0.08 5.5
Al2O3 13.65 14.19 13.96 14.21 14.01 14.00 0.23 14.6
MnO 0.13 0.11 0.12 0.21 0.08 0.13 0.05 — MgO 11.86 11.72 11.61 11.45 11.78 11.68 0.16 11.7 CaO 9.83 10.05 9.86 9.59 9.70 9.81 0.17 9.4 Cr2O3 0.01 — 0.00 0.00 0.00 0.00 0.00 0.0
FeO 11.45 11.50 11.50 11.77 11.00 11.44 0.28 11.8
Na2O 2.84 — — — — — — 2.9
K2O 1.64 — — — — — — 1.5
Total 95.29 93.56 92.85 92.42 91.65 93.15 1.38 97.8
Ti-rich TH phase (approx. ILM85), which could produce a susceptibility peak around 110 K, if Fig. 5 were to be taken into consideration. The other is the Verwey transition, which is a phase transition from cubic to monoclinic sym-metry (Verwey, 1939). This transition occurs at about 120 K for Ti-free TM (TM0), and the temperature decreases with an increase in the number of Ti substitutions (Dunlop and
¨
Ozdemir, 1997). The existence of the TM phase of TM02-09 composition suggests that the Verwey transition is also the possible source of the inflection at∼110 K.
For the susceptibility curve of C-1 (Fig. 4 (6)), two peaks at ∼140 K and ∼500◦C and a minor inflection point at ∼60 K are recognized. Although the lamellar TH phase of ILM53–ILM73 (identified in the EPMA analyses, Table 3) probably results in a peak higher than 140 K, the TH grains of ILM73–ILM96 are possibly also responsible for the peak at∼140 K. The peak at∼500◦C can be elucidated by the TM phase: the main TM phase of C-1 was identified as TM10–TM16 in the EPMA analyses and the corresponding Curie temperatures are 464–508◦C. This phase may also ac-company the Verwey transition, but there is not a clear peak around 110 K. This latter peak is probably overwhelmed by that at∼140 K. As for the inflection point at∼60 K, it is possible that some Ti-rich TH phase (e.g. the ILM96 grain; Table 3) survived the high-temperature oxidation and pro-duced the inflection.
In summary, the low-temperature susceptibility curves imply the existence of the phases of approximately ILM90 for A-5, approximately ILM90 and approximately TM10 for B-6, and approximately ILM80 and approximately TM10 for C-1. The high-temperature curves suggest the phases of approximately TM60 and approximately TM10 in A-5, and approximately TM10 in both B-6 and C-1. Note that these compositions are semi-quantitatively ap-proximated values.
5.
Estimate of the Equilibrium Temperatures
In the EPMA analyses, chemical compositions of both host TM and lamellar TH phases could be determined for six and seven TM grains of B-6 and C-1, respectively. In0
Fig. 5. Temperature-dependent variations in weak field magnetizations of ILM90, 83, and 79 (modified from Ishikawaet al.(1985)).
contrast, the quantitative analyses were successful only in determining host TM compositions for 11 TM grains of A-5 and seven TM grains of B-6. Applications of the Fe-Ti oxide geothermometer are straightforward for the former case but not for the latter. To estimate equilibrium temper-atures of all of these TM grains, a rock magnetic approach was adopted to evaluate the compositions of the lamellar TH phase in the latter case.
The low-temperature susceptibility measurements sug-gest that the main TH phase of A-5 is approximately ILM90; in addition, there are no obvious peaks related to the other TH phase. It is possible to assume that the com-position of the lamellar TH phase of A-5 is close to approx-imately ILM90, or more precisely, to an averaged compo-sition of the discrete TH grains. This assumption is prob-ably justified to some extent because the low-temperature susceptibility curves did not show significant frequency de-pendence (Fig. 4), thereby implying that the chemical com-positions are not so variable among the TH phase of differ-ent domain sizes (from discrete grains to narrow lamellae). The result is ILM92 if the average composition is calculated from the analytical results of all nine TH grains (Table 1). This composition also seems to represent the undetermined lamellar TH phase in B-6 because both susceptibility curves of A-5 and B-6 commonly have the peaks at∼60 K (Fig. 4). Based on these data, equilibrium temperatures are esti-mated for the observed TM grains using the Fe-Ti oxide geothermometer of Ghiorso (1997). The results are pre-sented in Fig. 6 together with the Curie temperatures of ti-tanomagnetites (Nagata, 1962). Figure 6 clearly shows that about one half of the TM grains in B-6 have equilibrium temperatures lower than the corresponding Curie temper-atures. Most of these cluster around 300◦C. Conversely, all TM grains of A-5 and C-1 have equilibrium tempera-tures higher than their Curie temperatempera-tures, with most con-centrated around 800–900◦C (A-5) and 700–800◦C (C-1). These results suggest that the specimen of B-6 could ac-quire not only TRM but also TCRM during its formation.
0
Fig. 6. Equilibrium temperatures estimated for the TM grains of the spec-imens A-5 (triangles), B-6 (circles), and C-1 (squares), using the Fe-Ti oxide geothermometer by Ghiorso (1997). Filled (open) symbols are the direct analytical results by EPMA (indirect results by both EPMA and susceptibility measurements). They are associated with error bars assuming the uncertainties of 2 mol% in ilmenite content in TH solid solutions. Solid lines represent iso-compositions of ILM70, 80, 90, 92, 96, 98 and 99, whereas a dashed line indicates the Curie temperature (Tc) of titanomagnetites (Nagata, 1962).
the samples were subjected to susceptibility measurements at high and low temperatures. Figure 7 shows the resul-tant susceptibility curves. Although three curves of group B samples appear to be analogous to those of group A, other curves show fairly consistent behavior within the group. This result suggests that the present analytical results of A-5, B-6, and C-1 can represent the chemical compositions of the TM and TH grains of the groups A, B, and C, re-spectively. Equilibrium temperatures are probably similar within each group.
Note that the present estimates are semi-quantitative eval-uations. This is because the present EPMA analytical re-sults have uncertainties of∼1 and 2 mol% when the con-tent of ulv¨ospinel and ilmenite in the TM and TH solid so-lutions are being calculated, respectively (Section 3). The geothermometer is also designed for stoichiometric pairs of TM and TH (Ghiorso, 1997). As the present TM and TH phases contain some minor substitutions, real equilibrium temperatures may slightly differ from the present estimates. However, the present results indicate that the equilibrium temperature of the group B samples is∼300◦C lower than the Curie temperature of the magnetite. This gap seems too large to be caused by the extent of these uncertainties. The uncertainties of 2 mol% in ilmenite content in the TH solid solutions result in errors of up to∼90◦C in the present equi-librium temperature estimates (error bars in Fig. 6).
6.
Plausibility of Lamellae Nucleation at Low
Temperature
Although the geothermometer suggests equilibration at ∼300◦C for the TM grains of group B samples, it seems to take long time to equilibrate at such low temperature. It is important to consider whether or not these equilibra-tions (nucleation of ilmenite lamellae) can be achieved
be-(A) Group A
1
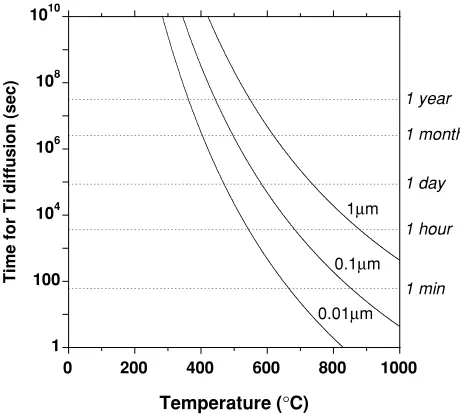
Fig. 8. Temperature dependence of time required for Fe-Ti interdiffusion in magnetite and titanomagnetite. Solid lines show time for 1, 0.1, and 0.01μm diffusions based on the diffusion coefficient ofD(10−3
m2/s)=3.85 exp(−2.23 ev/kT) by Freer and Hauptman (1978).
fore a complete cooldown of the lava. According to Freer and Hauptman (1978), Fe-Ti interdiffusion in magnetite and titanomagnetite is dominated by a diffusion of Ti, with a diffusion coefficient of D (10−3 m2/s)=3.85 exp(−2.23
ev/kT) for TM0 single crystal and TM20 powder. To the author’s knowledge, there is no other experimental data for the Fe-Ti interdiffusion in the TM system. Similar to Freer and Hauptman’s dimension analysis, if diffusion time t is estimated from t = a2/4D (a: diffusion distance)
fora = 0.01, 0.1, and 1 μm, the results are as shown in Fig. 8. These results are thought to be reasonable when the present lamella nucleation state is being considered be-cause the widths of the observed lamellar TH phase in B-6 are in the order of 0.1–1μm (Fig. 2). The lamella width of∼0.01μm also seems to be a possible scenario since the high-temperature oxidation reduces an effective grain size of relic TM phase, resulting in a lower diffusion distance for subsequent oxidation (Venezky and Rutherford, 1999). There may be a number of such fine ilmenite lamellae in the TM grains of the group B samples, however the magnifica-tion at which the EPMA observamagnifica-tions were carried out was not high enough to determine their existence.
The time scale of the lava cooling limits the time avail-able for Fe-Ti interdiffusion. The Kilauea 1960 lava proba-bly takes a few months to completely release heat. Accord-ing to the observations by Richteret al.(1970), this lava was formed by a frank eruption of the Kilauea’s east rift zone that began on January 14, 1960 and continued for 37 days. The one-dimensional heat equation gives a consis-tent characteristic time scale of∼107s (a few months) for a 5-m-sized body. Alternatively, the Kilauea 1960 lava may possibly retain heat for a few years because direct measure-ments of temperature in the Alae (AD1963) and Makaopuhi (AD1965) lava lakes, Kilauea, revealed that temperatures at ∼5 m in depth from their surfaces were above 500◦C at least for 2 years (Wrightet al., 1976). Therefore, it is possible
to consider that the Kilauea 1960 lava at Yamamotoet al.’s (2003) sampling point (∼5 m thickness) retained a hot inte-rior (above 400–500◦C) for a few months, or possibly even a few years. In this case, the lamella nucleation (∼0.01μm) could have occurred at temperatures above∼350◦C (Fig. 8). However, it should be noted that the present discussions of the time scale of the Fe-Ti interdiffusion is based on semi-quantitative evaluations, because the diffusion coeffi-cients for the present TM grains probably differ from those of Freer and Hauptman (1978). The coefficients of these two researchers were determined from interdiffusion exper-iments at high temperatures (above 600◦C), while those of the present evaluation are based on their extrapolations to low temperatures. In addition, the chemical compositions of the TM systems are not exactly the same between the ex-periments by Freer and Hauptman (1978) and those used in the present investigation. It might be possible that lamella nucleation could have occurred below 350◦C. One of the probable scenarios for this would be a pre-condition of rel-atively high oxygen fugacity, which would enable a faster Ti diffusion than the above estimations given that the Ti diffu-sion coefficient in the TM system is roughly proportional to the oxygen fugacity (Freer and Hauptman, 1978). Although Fig. 6 suggests concentrated equilibrium temperatures of ∼300◦C for B-6, which is clearly lower than 350◦C, this
may possibly be an achievable condition.
7.
TCRM/TRM Ratio and Overestimation of
Pa-leointensity
If ilmenite lamellae were nucleated at a low temperature, sub-divided TM domains could acquire TCRM. Although accurate theoretical modeling of just such a TCRM acquisi-tion process seems to be difficult, it may occur as follows.
(1) Original homogeneous Ti-rich TM grains (approx. TM60) gradually deplete Ti by lamellae nucleation, result-ing in gentle sub-divisions of TM grains (e.g. Fig. 1, A5 and 1, A9).
(2) The divided domains are gradually enriched in Fe. With these developments in the ilmenite lamellae, Fe-enriched regions are increasing their relative volumes and their compositions are approaching approximately TM05 (e.g. Fig. 2, A9). These reactions could occur at temper-atures as low as∼350◦C (Section 6).
(3) Since the reaction temperature (∼350◦C) is higher than the Curie temperature of TM60 (∼145◦C) but lower than that of TM05 (∼545◦C), this process could be inter-preted as one in which the new magnetic phase (TM05: divided TM domains) is emerging from the paramagnetic phase (TM60: host TM grain) with an increase in its rela-tive volume. This seems to be analogous to a grain-growth of new magnetic mineral below its Curie temperature.
Although this is not a unique scenario of possible TCRM acquisition, if we did assume that it could occur, a TCRM/TRM ratio for an assemblage of identical TM domains would be roughly estimated by the grain-growth CRM model of McClelland (1996). In this model, CRM and TRM for an identical assemblage of grains with vol-umevmaxare expressed as follows.
CRM=vmaxJs0
vbH Js(Tcrm)
TRM=vmaxJs0vmax
H Js(Tb) 3kTb
,
whereTcrmis the temperature of the CRM reaction,Tbis the blocking temperature,vbis the blocking volume,vmaxis the final grain volume,Js(T)andJs0are spontaneous
magneti-zation at temperatureTand room temperature,His the am-bient field, andkis the Boltzmann constant. Note that this model is developed for the case of constantTcrmand a
con-stant new phase composition. In the case of TCRM acquisi-tion, the grain-growth is considered to accompany simulta-neous temperature decrease as well as a gradual change in new phase composition.
A ratio of CRM/TRM for the assemblage is given by a following formula. Thus, the TCRM/TRM ratio for the assemblage of identi-cal TM domains is controlled by two variables of vb and
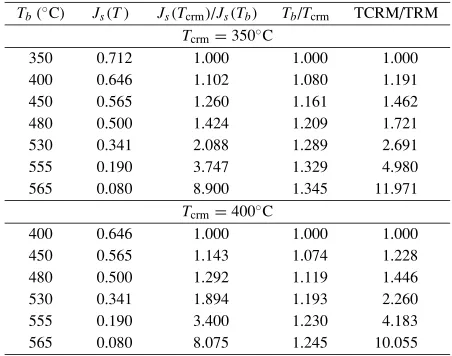
vmax. These variables seem to vary with degrees of high-temperature oxidation. If we consider TM grains of C3–C4 oxidation (e.g. Fig. 2, A9), the TM domains are very tiny so that it might be possible to assumevb ∼vmax. In this case, TCRM is always larger than TRM. An example calcula-tion of the TCRM/TRM ratios for a TM0 SD assemblage is listed in Table 5 using the assumption ofvb ∼vmax and Js (T) data by McClelland (1996). The calculations were made for the case ofTcrm =350 and 400◦C. This table
in-dicates that the TCRM/TRM ratio ranges between 1.19 and 1.72 for theTbinterval of 400–480◦C. Since the vicinityTb portion is often adopted for the Thellier paleointensity cal-culation, one may expect 20–70% of overestimation in pale-ointensities from samples containing TM grains of C3–C4 oxidation. This extent of overestimation is comparable to that observed in the group B specimens of Yamamotoet al. (2003) (including B-6, ∼55% overestimation). Although Smirnov and Tarduno (2005) recently suggested a low-field Thellier paleointensity bias due to TCRM acquisitions, this was derived from an assumption that characteristic relax-ation times for TRM and TCRM were comparable. This is different from the present assumption.
8.
Conclusion
I have estimated equilibrium temperatures of titanomag-netite grains, which are involved in samples previously subjected to Thellier paleointensity determinations by Ya-mamotoet al. (2003). The temperatures are evaluated by the Fe-Ti oxide geothermometer of Ghiorso (1997). The re-sults show that the specimens from the groups A and C (rel-atively ideal Thellier paleointensities) have clustered equi-librium temperatures of about 800–900 and 700–800◦C, while two swarmed temperatures around 300 and 700◦C are observed for the specimen from the group B (high Thellier paleointensities). Although they are semi-quantitative esti-mates, considering time scales of Fe-Ti interdiffusion and lava cooling, the last specimen could acquire the TCRM during its formation. For such specimens, simple cal-culation predicts that TCRM/TRM ratios could result in
Table 5. TCRM/TRM ratios forTcrm=350◦C and 400◦C estimated for a TM0 SD assemblage using the assumption ofvb ∼ vmaxand Js(T) data by McClelland (1996). Tcrm, temperature of CRM reaction;Tb, blocking temperature;vb, blocking volume;vmax, final grain volume; Js(T), spontaneous magnetization at temperatureT.
Tb(◦C) Js(T) Js(Tcrm)/Js(Tb) Tb/Tcrm TCRM/TRM
Tcrm=350◦C
350 0.712 1.000 1.000 1.000
400 0.646 1.102 1.080 1.191
450 0.565 1.260 1.161 1.462
480 0.500 1.424 1.209 1.721
530 0.341 2.088 1.289 2.691
555 0.190 3.747 1.329 4.980
565 0.080 8.900 1.345 11.971
Tcrm=400◦C
400 0.646 1.000 1.000 1.000
450 0.565 1.143 1.074 1.228
480 0.500 1.292 1.119 1.446
530 0.341 1.894 1.193 2.260
555 0.190 3.400 1.230 4.183
565 0.080 8.075 1.245 10.055
1.19–1.72 for the blocking temperature range of 400–480◦C assuming the grain-growth model by McClelland (1996). This portion is often adopted for the Thellier paleointen-sity calculation, and the extent of the overestimation (20– 70%) is comparable to the observations in Yamamoto et al.(2003). In TM grains of C3–C4 oxidation, one can ex-pect coexisting Ti-poor TM domains (∼TM05) and Ti-rich TH lamellae (∼ILM95). Equilibrium temperatures of these grains are generally far below Curie temperatures of the corresponding TM domains, as suggested from Fig. 6. If the TM grains associated with well-developed fine ilmenite lamellae and exsolved TM domains were very tiny, they sat-isfied the condition ofvb ∼ vmax. We would pay attention to these grains, since they might be potential sources of the overestimation of Thellier paleointensities up to a few tens of percent.
Acknowledgments. I am very grateful to Shingo Takeuchi for the thorough assistance of the EPMA operation and many help-ful comments concerning the time scales of the Fe-Ti interdiffu-sion and the lava cooling. I also appreciate an insightful comment of Masaru Kono at the 2004 JEPS meeting which shed light on the consideration of the lamella nucleation. Takeshi Saito, Koji Uno and Kuniyuki Furukawa are acknowledged for valuable dis-cussions on observations of the Fe-Ti oxides. I thank Toshitsugu Yamazaki and Hirokuni Oda for critical reading of the manuscript, and Yongjae Yu, Alexei V. Smirnov and Hidefumi Tanaka for con-structive reviews. Y. Yamamoto is supported by Research Fellow-ships of the Japan Society for the Promotion of Science for Young Scientists.
References
Anderson, A. T., Oxidation osf the La Blanche Lake titaniferous magnetite deposit,Quebec J. Geol.,76, 528–547, 1968.
Biggin, A. J. and D. N. Thomas, Analysis of long-term variations in the geomagnetic poloidal field intensity and evaluation of their relationship with global geodynamics,Geophys. J. Int.,152, 392–415, 2003. Buddington, A. F. and D. H. Lindsley, Iron-titanium oxide minerals and
synthetic equivalents,J. Petrol.,5, 310–357, 1964.
their associated ferromagnesian silicates,Contrib. Mineral. Petrol.,14, 36–64, 1967.
Chauvin, A., P. Roperch, and S. Levi, Reliability of geomagnetic paleoin-tensity data: the effects of the NRM fraction and concave-up behavior on paleointensity determinations by the Thellier method,Phys. Earth Planet. Int.,150, 265–286, 2005.
Coe, R. S., Paleointensities of the Earth’s magnetic field determined from Tertiary and Quaternary rocks,J. Geophys. Res.,72, 3247–3262, 1967. Dodson, M. H. and E. McClelland, Magnetic blocking temperatures of single-domain grains during slow cooling,J. Geophys. Res.,85, 2625– 2637, 1980.
Dunlop, D. J. and ¨O. ¨Ozdemir,Rock Magnetism: Fundamentals and fron-tiers, Cambridge University Press, 573 pp, 1997.
Fox, J. M. W. and M. J. Aitkin, Cooling-rate dependence of thermorema-nent magnetization,Nature,283, 462–463, 1980.
Freer, R. and Z. Hauptman, An experimental study of magnetite-titanomagnetite interdiffusion,Phys. Earth Planet. Int.,16, 223–231, 1978.
Ghiorso, M. S., Thermodynamic analysis of the effect of magnetic ordering on miscibility gaps in the FeTi cubic and rhombohedral oxide minerals and the FeTi oxide geothermometer,Phys. Chem. Minerals,25, 28–38, 1997.
Ghiorso, M. S. and R. O. Sack, Fe-Ti oxide geothermometry: thermody-namic formulation and the estimation of intensive variables in silicic magmas,Contrib. Mineral Petrol.,108, 485–510, 1991.
Gromm´e, C. S., T. L. Wright, and D. L. Peck, Magnetic properties and oxidation of iron-titanium oxide minerals in Alae and Makaopuhi lava lakes, Hawaii,J. Geophys. Res.,74, 5277–5293, 1969.
Haggerty, S. E., Oxide textures—a mini-atlas, Oxide Minerals: petrologic and magnetic significance,Reviews in Mineralogy,25, Mineralogical Society of America, 129–219, 1991.
Hill, M. J. and J. Shaw, Magnetic field intensity study of the 1960 Kilauea lava flow, Hawaii, using the microwave paleointensity technique, Geo-phys. J. Int.,142, 487–504, 2000.
Ishikawa, Y. and S. Akimoto, Magnetic properties of the FeTiO3-Fe2O3
solid solution series,J. Phys. Soc. Jpn.,12, 1083–1098, 1957. Ishikawa, Y., N. Saito, M. Arai, Y. Watanabe, and H. Takei, A new oxide
spin glass system of (1-x) FeTiO3-x Fe2O3. I. Magnetic prorerties,J. Phys. Soc. Jpn.,54, 312–325, 1985.
Kellogg, K., E. E. Larson, and D. E. Watson, Thermochemical remanent magnetization and thermal remanent magnetization: comparison in a basalt,Science,170, 628–630, 1970.
Kosterov, A. A. and M. Prev´ot, Possible mechanisms causing failure of Thellier paleointensity experiments in some basalts,Geophys. J. Int., 134, 554–572, 1998.
Lepage, L. D., ILMAT: an EXCEL worksheet for ilmenite-magnetite geothermometry and geobarometry, Comput. Geosci., 29, 673–678, 2003.
Levi, S., The effect of magnetite particle size on paleointensity determi-nations of the geomagnetic field,Phys. Earth Planet. Int.,13, 245–259, 1977.
Mankinen, E. A. and D. E. Champion, Broad trends in geomagnetic pa-leointensity on Hawaii during Holocene time,J. Geophys. Res.,101, 21995–22013, 1993.
McClelland, E., Theory of CRM acquired by grain growth and its impli-cations for TRM discrimination and paleointensity determination in ig-neous rocks,Geophys. J. Int.,126, 271–280, 1996.
Mochizuki, N., H. Tsunakawa, Y. Oishi, S. Wakai, K. Wakabayashi, and Y. Yamamoto, Palaeointensity study of the Oshima 1986 lava in Japan: im-plications for the reliability of the Thellier and LTD-DHT Shaw meth-ods,Phys. Earth Planet. Int.,146, 395–416, 2004.
Nagata, T., Magnetic properties of ferrimgnetic minerals of Fe-Ti-O sys-tem, in: Proc. Benedum Earth Magnetism Symp., pp. 69–86, 1962. Oishi, Y., H. Tsunakawa, N. Mochizuki, Y. Yamamoto, K. Wakabayashi,
and H. Shibuya, Validity of the LTD-DHT Shaw and Thellier palaeoin-tensity methods: a case study of the Kilauea 1970 lava,Phys. Earth Planet. Int.,149, 243–257, 2005.
Richter, D. H., J. P. Eaton, K. J. Murata, W. U. Ault, and H. L. Krivoy, Chronological narrative of the 1959–1960 eruption of Kilauea volcano, Hawaii, US Geol. Surv. Professional Paper 537-E, E1–E73, 1970. Smirnov, A. V. and J. A. Tarduno, Thermochemical remanent
magneti-zation in Precambrian rocks: Are we sure the geomagnetic field was weak?,J. Geophys. Res., 110, B06103, doi:10.1029/2004JB003445, 2005.
Stormer, J. C., The effects of recalculation on estimates of temperature and oxygen fugacity from analyses of multicomponent iron-titanium oxides,
Am. Mineral.,68, 1983.
Tauxe, L., Long term trends in paleointensity: The contribution of DSDP/ODP submarine basaltic glass collections,Phys. Earth Planet. Int., 2006 (in press).
Thellier, E. and O. Thellier, Sur l’intensite du champ magnetique terrestre dans le passe historique et geologique,Ann. Geophys.,15, 285–376, 1959.
Valet, J. P., Time variations in geomagnetic intensity,Rev. Geophys.,41, 1004 doi:10.1029/2001RG000104, 2003.
Venezky, D. Y. and M. J. Rutherford, Petrology and Fe-Ti oxide re-equilibration of the 1991 Mount Unzen mixed magma,J. Volcanol. Geotherm. Res.,89, 213–230, 1999.
Verwey, E. J. W., Electronic conduction of magnetite (Fe3O4) and its
transition point at low temperature,Nature,144, 327–328, 1939. Wright, T. L., D. L. Peck, and H. R. Shaw, Kilauea lava lakes: natural
laboratories for study of cooling, crystallization and differentiation of basaltic magma, inThe Geophysics of the Pacific Ocean Basin and its Margin, Am. Geophys. Monogr.,19, 375–392, 1976.
Xu, S. and D. J. Dunlop, Thellier paleointensity theory and experiments for multidomain grains,J. Geophys. Res.,109, B07103 doi:10.1029/ 2004JB003024, 2004.
Yamamoto, Y., H. Tsunakawa, and H. Shibuya, Paleointensity study of the Hawaiian 1960 lava: Implications for possible causes of erroneously high intensities,Geophys. J. Int.,153, 263–276, 2003.
Yu, Y. and L. Tauxe, Testing the IZZI protocol of geomagnetic field inten-sity determination,Geochem. Geophys. Geosyst.,6, Q05H17, doi:10. 1029/2004GC000840, 2005.