Earth Planets Space,58, 601–605, 2006
A comparative study of the bottomside profile parameters over Wuhan with
IRI-2001 for 1999–2004
Huajiao Chen1,2,3, Libo Liu1, Weixing Wan1, Baiqi Ning1, and Jiuhou Lei1
1Division of Geomagnetism and Space Physics, Institute of Geology and Geophysics, Chinese Academy of Sciences, Beijing 100029, China 2Wuhan Institute of Physics and Mathematics, Chinese Academy of Sciences, Wuhan, China
3Graduate School of Chinese Academy of Sciences, Beijing 100049, China
(Received August 30, 2005; Revised October 21, 2005; Accepted October 25, 2005; Online published May 12, 2006)
The diurnal, seasonal, and solar activity variations of the bottomside ionospheric profile parameters B0 and B1 are studied using electron density profiles measured over Wuhan (30.4◦N, 114.4◦E) of China with a DGS-256 Digisonde during 1999–2004. Comparisons are made with the International Reference Ionosphere model (IRI-2001) using both the standard option (B0-Tab and B1-Tab) and the Gulyaeva’s option (B0-Gul and B 1-Gul). The results show that: (1) observed B0 has distinct diurnal and seasonal variations, while observed B1 changes little with season. The value ofB0 is larger in summer than that in equinox and winter, especially for daytime. In winter and equinox, B0 also presents morning and afternoon collapses as reported by Leiet al. (2004). (2)B0 increases about 18.6 km from low solar activity (LSA) to high solar activity (HSA). B1 in HSA is smaller than that in LSA before 10:00 LT and with an opposite tendency during the rest time. (3) ObservedB0 is in better agreement withB0-Gul than with B0-Tab, though the B0-Gul overestimates during 09:00 to 17:00 LT in equinox and summer. B0-Tab is 12–20 km larger than the observations over Wuhan almost all the time. Meanwhile,B1-Tab is in good agreement with the observations.
Key words:Low latitude ionosphere, DGS-256 Digisonde, IRI model, modeling and forecasting.
1.
Introduction
The International Reference Ionosphere (IRI) model is a global empirical model which specifies the monthly average of the electron density, electron and ion temperatures, and ion compositions (Bilitza, 2001). Over the past decades, the Committee on the Space Research (COSPAR) and the International Union of Radio Science (URSI) who estab-lished the IRI models have released a series of IRI models. The most updated IRI-2001 (Bilitza, 2001) has been made great improvements. As to the bottomside region, these im-provements include a better description of the occurrence statistics of F1layer (Scottoet al., 1997, 1998), a new table
of values of B0 and B1 (Bilitzaet al., 2000), and a better description of the transition region from the bottomside to the E valley (Reinisch and Huang, 1999).
The electron density profile Ne(h) of the bottomside
ionosphere in the IRI model was described by the follow-ing expression (Ramakrishnan and Rawer, 1985),
Ne=NmF2exp(−xB1)/cosh(x), x=(hmF2−h)/B0,
(1) Here B0 is the thickness parameter andB1 a shape param-eter of the bottomside ionospheric profile.
The profiles are fitted with Eq. (1) fromhmF2toh0.24(the
height where the density falls to 0.24 times ofNmF2) to
ob-tain theB0 andB1 if noF1-layer exists, or to theF1peak if
F1-layer occurs. The IRI model offers two options to
pro-Copyright cThe Society of Geomagnetism and Earth, Planetary and Space
Sci-ences (SGEPSS); The Seismological Society of Japan; The Volcanological Society of Japan; The Geodetic Society of Japan; The Japanese Society for Planetary Sci-ences; TERRAPUB.
videB0 andB1. The standard option ofB0 (B0-Tab) uses a table of B0 values deduced from profile inversion of iono-grams at mid-latitude stations, and the Gulyaeva’s option (B0-Gul) based on the half density heighth0.5 (Gulyaeva,
1982). While the standard option of B1-Tab is analytical, and the Gulyaeva’s option (B1-Gul) is a constant 3.
In the Gulyaeva’s opinion,B0 can be given as
B0=(hmF2−h0.5)/C. (2)
Here C is a function of B1. Since B1-Gul is a constant value of 3, soCis a constant value too. Therefore,B0-Gul is proportional to the value ofhmF2minush0.5.
The objective of this paper is to analyze the diurnal, sea-sonal, and solar activity variations of B0 and B1 using the Digisonde observations over Wuhan during the period 1999–2004. Then a comparison between the observations and the IRI-2001 model is made to validate the new updated IRI model over Wuhan.
2.
Data and Analysis Method
Since 1946, ionosonde measurements have been rou-tinely made at Wuhan (geographic 114.4◦E, 30.6◦N; 45.2◦ dip) which located in central China, is just away from the northern crest of equatorial anomaly in East Asia. It has significant values for studying low latitude ionospheric dy-namics (e.g., Liuet al., 2003, 2004). A DGS-256 Digisonde started routinely measuring the ionosphere over Wuhan af-ter its update in 1999. The present paper uses a database of more than 200,000 ionograms collected during 1999 to 2004. Huge effort has been made to manually scale
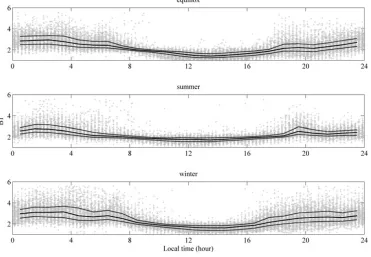
Fig. 1. Diurnal and seasonal variations of the thickness parameterB0 derived from Wuhan DGS-256 observations under the high solar activity. The median results are shown as solid lines; along with the upper quartile UQ and lower quartile LQ (dashed lines) ofB0 values.
Fig. 2. Diurnal and seasonal variations of the shape parameterB1 derived from Wuhan DGS-256 observations under the high solar activity. The median results are shown as solid lines; along with the upper quartile UQ and lower quartile LQ (dashed lines) ofB1 values.
those ionograms, and then bottomside profiles are calcu-lated from these manual-scaling ionograms with a stan-dard “true height” inversion program (Huang and Reinisch, 1996) inherent in the UMLCAR SAO-Explorer. At the same time, critical frequency of the F layer (f oF2), its
height (hmF2), and other parameters (i.e., the profile
param-etersB0 andB1, etc.) are then obtained.
We use the data basically on magnetically quiet to
mod-erate conditions with the 3-hourly planetary geomagnetic index ap < 20. They are grouped according to their season and solar activity, that is, May-August for sum-mer, November-February for winter and others for equinox; F10.7p = (F10.7+F10.7A)/2 > 170 for high solar activity
(HSA), andF10.7p=(F10.7+F10.7A)/2<130 for low solar
H. CHENet al.: THE BOTTOMSIDE PROFILE PARAMETERS OVER WUHAN 603
Fig. 3. Diurnal variation of theB0 andB1 derived from Wuhan DGS-256 observations under low and high solar activity. The high solar activity median results are shown as solid lines; the low solar activity median results are shown as dash line.
Fig. 4. Comparisons of the median values ofB0 obtained from the Wuhan DGS-256 measurements withB0-Tab (solid lines), andB0-Gulyaeva (dashed lines) predicted by the IRI model.
3.
Results
3.1 ObservedBparameters
Figure 1 displays the diurnal and seasonal variations of the thickness parameter B0 under HAS against local time, the corresponding median values, upper (UQ) and lower (LQ) quartiles are also given. From the scatter plots, it can be seen that in summer daytimeB0 shows a large scat-ter. During summer, the median value of B0 varies from around 80 km at 00:00 LT to diurnal peak of 150 km around 09:00 LT, and thereafter, it falls gradually to 80 km around midnight. In winter, the median B0 increases from 76 km (around 03:30 LT) to 92 km (around 04:30 LT), then falls
Fig. 5. Comparisons of the median values ofB1 obtained from the Wuhan DGS-256 measurements withB0-Tab (solid lines), andB0-Gulyaeva (dashed lines) predicted by the IRI model.
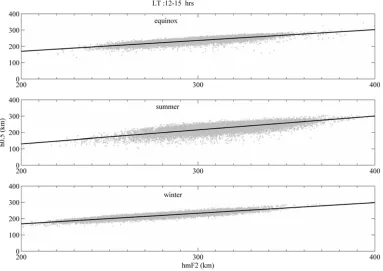
Fig. 6. Scatter plots ofhmF2againsth0.5and their best fits are given during 12:00 to 15:00 LT for equinox, summer and winter.
scattered, especially during the night. B1 is higher in win-ter at night and lower in summer during the daytime. Gen-erally,B1 varies between 1 and 6, and the median value of B1 is about 1.89 in the day and 2.54 at the night.
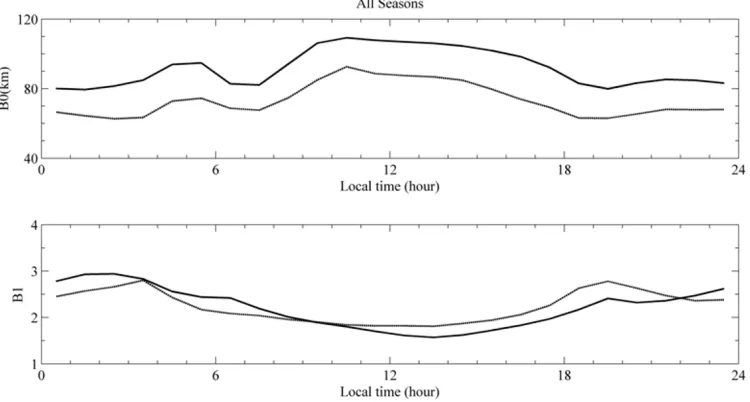
Diurnal variations of the median B0 and B1 for all the seasons under high (solid lines) and low (dash lines) solar activity levels are plotted in Fig. 3. The upper panel shows
H. CHENet al.: THE BOTTOMSIDE PROFILE PARAMETERS OVER WUHAN 605
and its tendency is opposite during the rest time. This solar activity dependence of B1 is not consistent with Sethi and Mahajan (2002) and Lei et al.(2004). In Arecibo (Sethi and Mahajan 2002), the LSA B1 is larger, but in Millstone Hill (Lei et al., 2004) the HSA B1 is larger. Since the mean F10.7p under high solar activity is 194, and the mean F10.7punder low solar activity is 122 which is much larger
than common mean F10.7p of low solar activity, so further
investigations are needed.
3.2 Comparison with IRI model
Figure 4 shows comparisons of the median values of B0 obtained from Wuhan DGS-256 measurements with that of B0-Tab (solid lines), and B0-Gulyaeva (dash lines) pre-dicted by the IRI-2001. It can be seen that B0-Gul agrees with the observations well, especially in winter, while B 0-Tab mostly overestimates the observations. In equinox and summer B0-Gul overestimates the observations in the day-time. In the earlier studies, Mahajanet al.(1995) also re-ported that during solar minimum period (1974–1977) B 0-Gul were significantly larger during daytime in equinox and summer. B0-Tab represents the diurnal variation not quite well, particularly in winter when the median values of B 0-Tab are unchanged. B0-Tab results are somewhat different from those in Wuhan (Zhang and Huang, 1998) and Hainan (Zhang et al., 2004), in which both observation-based B0 is systematically larger by day and smaller by night than IRI’s. B0-Tab mean overestimates by 12–20 km, but that of
B0-Gul is about 5–12 km.
Comparisons of the median values of B1 with B0-Tab (solid lines), andB0-Gul (dash lines) predicted by the IRI-2001 are showed in Fig. 5. B1-Gul has constant value of 3. B1-Tab agrees with observations well particularly in summer. In equinox before 08:00 LT, it underestimated the observations, after that it overestimated the observations. In winter, it underestimated at the night, and overestimate in the day. These results are quite similar with those in Hainan, China (Zhanget al., 2004).
As above B0-Gul is always significantly larger during daytime in equinox and summer, and B0-Gul was based on the half density point h0.5, so we have examined the
relationship between hmF2 andh0.5 for equinox, summer
and winter. Figure 6 shows scatter plots of hmF2 against
h0.5and their best fits during 12:00 to 15:00 LT for equinox summer and winter. It can be seen that in summer the scatter is larger. It can explain the B0-Gul deviations in summer. Mahajanet al.(1995) has also found that during daytime the lower values ofh0.5are often coincident, whenever there is F1layer betweenh0.5andhmF2.
4.
Summary and Conclusion
Electron density profiles measured with DGS-256 Digisonde over Wuhan station are used to obtain theF2
bot-tomside parametersB0 andB1 during the period from 1999 to 2004. Median values of these two parameters are made to compare with the newly updated IRI-2001. The results show that: (1) B0 has distinct diurnal and seasonal varia-tions, while B1 changes little with seasons. The value of B0 is larger in summer than that in equinox and winter, es-pecially for daytime. In winter and equinox, B0 also
pre-sentes morning and afternoon collapses as reported by Lei et al.(2004). (2) B0 increases about 18.6 km from LSA to HSA. B1 in HSA is smaller than that in LSA before 10:00 LT, and its tendency is opposite during the rest time. This solar activity dependence ofB1 is somewhat different from previous studies (Lei et al., 2004; Sethi and Maha-jan, 2002). (3) OurB0 observations are in better agreement with the B0-Gul option than with the B0-Tab, though the B0-Gul option overestimates the observedB0 during 09:00 to 17:00 LT in equinox and summer. B0-Tab is larger than the observations 12–20 km over Wuhan almost all the time. Meanwhile,B1-Tab is in good agreement with the observa-tions.
Acknowledgments. This research was supported by the KIP Pi-lot Project (kzcx3-sw-144) of Chinese Academy of Sciences and National Natural Science Foundation of China (40574071, 40574072).
References
Bilitza, D., International Reference Ionosphere 2000,Radio Sci.,36(2), 261–275, 2001.
Bilitza, D., S. Radicella, B. Reinish, J. Adeniyi, M. Mosert de Gonzalez, S. Zhang, and O. Obrou , New B0 and B1 models for IRI,Adv. Space Res.,25(1), 86–96, 2000.
Gulyaeva, T. L., Implementation of a new characteristic parameter into the IRI sub-peak electron density profile,Adv. Space Res.,2(10), 191–194, 1982.
Huang, X. and B. W. Reinisch, Vertical electron density profiles from the digisonde network,Adv. Space Res.,18(6), 121–129, 1996.
Lei, J., L. Liu, W. Wan, S.-R. Zhang, and J. M. Holt, A statistical study of ionospheric profile parameters derived from Millstone Hill inco-herent scatter radar measurements,Geophys. Res. Lett.,31, L14804, doi:10.1029/2004GL020578, 2004.
Liu, L., W. Wan, X. Luan, B. Ning, and J. Lei, Solar activity dependence of the effective winds derived from ionospheric data at Wuhan,Adv. Space. Res.,32, 1719–1724, 2003.
Liu, L., W. Wan, C. C. Lee, B. Ning, and J. Y. Liu, The low latitude ionospheric effects of the April 2000 magnetic storm near the longitude 120◦E,Earth Planets Space,56, 607–612, 2004.
Mahajan, K. K., R. Kohli, N. K. Sethi, and V. K. Pandey, Variability of the F-region parameterh0.5,Adv. Space Res.,15(1), 51–60, 1995. Ramakrishnan, Y. V. and K. Rawer, Electron density reference profile in
the lower ionosphere,Adv. Space Res.,5(7), 29–34, 1985.
Reinish, B. and X. Huang, Redefining the IRI F1 layer profile,Adv Space Res.,25(1), 81–88, 1999.
Scotto, C., M. Mosert de Gonzalez, S. Radicella, and B. Zolesi, On the prediction of the F1 ledge occurrence and critical frequency,Adv. Space Res.,20(9), 1773–1776, 1997.
Scotto, C., Radicella, and B. Zolesi, An improved probability function to predict the F1 layer occurrence and critical frequency,Radio sci.,33, 1763–1765, 1998.
Sethi, N. K. and K. K. Mahajan, The bottomside parameters B0, B1 ob-tained from incoherent scatter measurements during a solar maximum and their comparisons with the IRI-2001 model,Ann. Geophys.,20(6), 817–822, 2002.
Sethi, N. K. and V. K. Pandey, Comparative study of electron density from incoherent scatter measurements at Arecibo with the IRI-95 model during solar maximum,Ann. Geophys.,20, 817–822, 2004.
Zhang, M. L., J. K. Shi, X. Wang, S. Z. Wu, and S. R. Zhang, Compara-tive study of ionospheric characteristic parameters obtained by DPS-4 digisonde with IRI-2000 for low latitude station in china,Adv. Space Res.,33, 869–873, 2004.
Zhang, S.-R. and X.-Y. Huang, Variations of bottomside electron density profile parameters obtained from observations at Wuchang, China,Adv. Space Res.,22(6), 749–752, 1998.