Fingerprint Liveness Detection from Single
Image Using SURF & PHOG
Himabindu Sathyaveti 1, Amarendra Jadda 2
Assistant Professor, Department of ECE, Audisankara College of Engineering & Technology(Autonomous)
Gudur,India1
Associate Professor, Department of ECE, Audisankara Institute of Technology, Gudur, India2
ABSTRACT: Fingerprint based authentication systems have developed rapidly in the current years. However, current
fingerprint based biometric systems are susceptible to spoofing attacks. Moreover, single feature based static come up to does not perform equally over different fingerprint sensors and spoofing materials. In this paper, we propose a static software approach. We propose to merge low level gradient features from Speeded-Up Robust Features (SURF), pyramid extension of the Histograms of Ori-ented Gradient (PHOG) and Principle Component analysis (PCA). We extract these features from a single fingerprint image to overcome the issues faced in dynamic software approaches which require user cooperation and longer computational time.
KEYWORDS: Fingerprint, liveness, SURF, PCA, PHOG
I.INTRODUCTION
Biometrics is a very strong authentication mechanism as it based on something that you are as opposed to something you know or something you have. Passwords and tokens are highly vulnerable to being lost or stolen. A weak or compromised password is the primary reason for the rising cases of security and data breaches. Passwords are the weakest link in an organization’s security system and even strong passwords cannot resist sophisticated hacker attacks. Further, the costs of maintaining password and token based systems are very high and inefficient. Resetting lost or forgotten passwords takes up IT support time and reduces employee productivity.
Fingerprint recognition looks for the unique patterns of ridges and valleys that are present in an individual’s fingerprint. These patterns are unique to every individual and thus help to identify individuals from an entire population. Fingerprints are inherent to individuals and can neither be lost nor stolen which makes it highly accurate and reliable. Moreover, the availability of low-cost fingerprint readers coupled with easy integration capabilities has led to the wide spread deployment of fingerprint biometrics in a variety of organizations.
An organization can enjoy limitless benefits by correctly deploying biometric technology. Today’s economy is an evolving one and technological advancements have changed the way in which organizations function and conduct businesses. Modern organizations need to be adaptive, flexible and agile to survive in the competitive business environment.
Fingerprint technology can benefit organizations in a variety of sectors such as health care, government, retail enterprises, technology organizations, manufacturing industry, libraries, universities etc
Governments and organizations all around the world are choosing biometric technology to combat identity fraud and security breaches, secure confidential data, reduce costs and to improve overall user experience. Biometrics is one of the rapidly growing fields in the information technology sector with fingerprint recognition expected to remain the most dominant form of biometric technology. The global biometrics market is growing at an exponential rate and is forecasted to reach $23.54 billion by 2020.
II. EXISING WORK
In the literature in the field of soft-ware based fingerprint liveness detection. Since our proposed method focuses on software based approaches we refer the reader to for hardware based approaches. Software based approaches extract intrinsic properties directly from the fingerprint images which are acquired by the sensor. Currently, the majority of software based approaches depends on the analysis of the skin perspiration through the pores, skin deformation and image quality. Software based approaches are further subdivided into dynamic software-based, static software-based and the combined software based approaches.
A. Dynamic Software Based Approach
In software-based approach, features are extracted from multiple frames of the same finger. The evolution of features over time captures the vital information which is exploited in this approach. Dynamic software based approach can be further divided into two categories: skin deformation based approach and perspiration based approach.
In Skin Deformation Based Approach: method which is based on fingerprint deformation. Authors introduced a new method called the thin-plate spline (TPS) model. A user is asked to apply pressure in four directions to measure minutiae distances between the distorted fingerprints with undistorted fingerprint. Their study proves that, when a real finger is pressed against the scanner it produces a bigger non-linear distortion in comparison to fake fingers due to rigidity. The drawback is that it requires a special fingerprint device and is time consuming due to computation over multiple image frames.
In Perspiration Based Approach method based on the perspiration phenomenon. Two fingerprint images are captured at different intervals and the middle ridge signals extracted from them are compared. They then use a back-propagation neural network classifier to differentiate between the live and fake fingerprint. The limitation of this system is that it requires a special kind of DC capacitance-based Si CMOS fingerprint scanner and is time consuming to capture the images at intervals. The disadvantage of perspiration based approach is that the features that potentially describe the liveness or fakeness of the fingerprint can be lost if the finger pressure is not applied correctly or not kept for a fixed amount of time. In addition, it is time consuming and requires user cooperation and cannot be used for real time authentication.
B. Static Software Based Approach
In static software based approach, features are exploited from a single fingerprint to overcome the drawbacks of high computational time and user cooperation required in dynamic software based approaches. Generally, static measurements are well captured from a higher resolution sensor (1000 dpi and above), but the common sensors are generally in the range of 500 dpi. Lower resolution of fingerprint sensors thus produces an added challenge in this approach. We further categorize the static software based approach into two categories: one based on image quality, and the other based on sweat pores.
1) Image Quality Based Approach introducesa novel fake fingerprint detection methodology using multiple static image features. Histogram, power spectrum, directional contrast, ridge signal, and ridge thickness of finger-print image were considered as representative static features. The features are fused at the feature level, and support vector machine was used as the classification engine. The main drawback of the method is that, it takes higher computation time with a larger feature number. Besides, the selection of best window size is sensor dependent.
2) Pore Based Approach analysis of sweat pores to detect the liveness of the fingerprint. A high resolution sensor (greater than 800 dpi) was used to capture active sweat pores. High pass filtering was used to extract sweat pores and a correlation filter was used to extract the position of pores. One of the major limitations of pore based approaches is, it require high resolution images to detect the active pores accurately.
III. PROPOSED METHOD
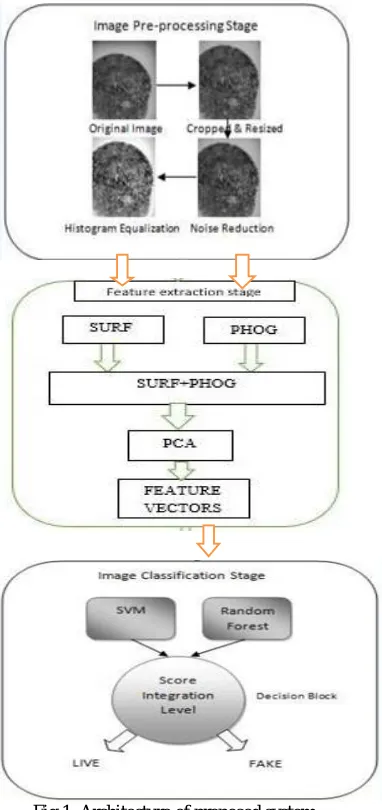
In this system, based on visual observation, there are more sweat pores in the live fingerprint as compared to the fake fingerprint images. Inspired by these minute differences, we design low level features that are able to represent discriminating characteristics between live and fake fingerprints. To overcome the large computational time for live detection of fingerprint we use low level gradient features and shape analysis from single image.In this paper, the architecture of the proposed system can be categorized into three stages as shown in fig 1.They are
(i) Image pre-processing stage (ii) Feature Extraction stage (iii) Image classification stage
Fig 1: Architecture of proposed system
Image Pre-Processing Stage
enhanced the quality of the image by first cropping the fingerprint region in the image and then performing histogram equalization to increase the perception information. The Canny edge detector is first applied for the purpose of identifying the biggest contour in order to find the extreme ridgecontours.
Specifically, we remove the non-relevant white region found in the borders prior to cropping the region of interest. In order to remove noise captured during image acquisition, median filtering is then applied on the cropped images without reducing the sharpness of the input image.
Finally, histogram equalization is performed to improve the contrast in the image by diversifying the intensity range over the whole cropped image.The output achieved after this stage is an image with a reduced noise and improved definition of the ridge structure.The output achieved after this stage is an image with a reduced noise and improved definition of the ridge structure.
Feature Extraction Stage
In fingerprint authenticationsystems, the image is usually captured from multiple subjects using different scanners. Therefore, fingerprint images are typically found to be of different scales and rotations. In order to obtain features that are invariant to these problems, we use various features that capture properties of live fingerprint images. In these paper, we choose to use SURF as it is invariant to illumination, scale and rotation. SURF is also used because of its concise descriptor length. SURF shrinks the descriptor length to 64 floating point whereas standard SIFT implementation uses a descriptor consisting of 128 floating point values thus reducing computational time. While SURF is invariant to object orientation and scale transformation, it is not invariant to geometric transformations.
Hence, in order to compensate the limitations of SURF, PHOG descriptors are used to extract local shape information to obtain more discriminative features. In details of the above features are provided in the following content.
Speeded Up Robust Features (SURF)
Speeded Up Robust Features (SURF) is a newly developed framework, which is very likely to becoming the next
fact feature detector in the industry. It is an in-plane rotation detector anddescriptor. The detector locates the key points in the image and the descriptor describes the featuresof the key points to constructs the feature vectors of the key points. Using this algorithm, it can generate a set of feature pairs between the query image and each individual database image. The task of finding correspondences between two images of the same scene (or) object. It is part of many computer vision applications such as camera calibration, 3D-reconstruction and object recognition.The main interest of the SURF approach lies in its fast computation of operators using box filters thus enabling real-time applications such as tracking & object recognition. The SURF algorithm is based on three consecutive steps.1. Feature detection.2. Feature descriptor.3. Feature matching.
1. Feature Detection:During the detection step, the local maxima in box space of the determinant of hessian operator are used to select interest point candidates.These candidates are then validated if the response is above a given threshold. Both the scale and location of the key points are refined using quadratic fitting. Typically a few hundred interest points are detected in an image pixel.
2. Feature description: The purpose of the invariant descriptor & comparison is to build a descriptor of neighborhood of each point of interest that is invariant to view point changes. The multi scale analysis select the points in box-space provides scale & translation invariance. To achieve rotation invariance, a dominant orientation is defined by consider the local gradient orientation distribution estimated from Haar- wavelets.
3. Feature matching: The image matching task for image recognition & detection of object the local descriptors from several images are matched. The comparison is performed by computing the Euclidean distance between all matching pair. A nearest neighbour distance ratio matching criterion is used to reduce mismatches.
Fig 2:Flow of SURF algorithm
Interest point detection: The interest point detection uses a very basic Hessian-matrix approximation. This lends itself to the use of integral images as made popular by Viola and Jones,which reduces the computation time drastically. Integral images: Integral image is used by all subsequent parts of algorithm to significantly accelerate their speed.
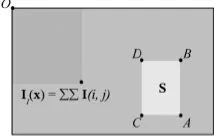
I (x, y) = I(i, j)
When using integral image it is necessary to always read only four pixels values to calculate surface integral of any size from original image. Integral images is an intermediate representation for the image and contains the “sum of gray scale pixel values of image”.
Using integral images, calculate the sum of intensities inside a rectangular region of any size as shown above. Interest point detector :SURF identify important feature points commonly called key points in image.it uses hessian matrix is a very basic laplacin based detector. It depends on integral images, to reduce computation time and therefore it called as Fast-Hessian detector. The detector is based on Hessian matrix because of its good performance in computation time and accuracy.
For given point X = (x, y)in image I at scale σ the H-matrix is defined as
Where Lxx(x, σ) is the convolution of the Gaussian second order derivative ∂2/ ∂x2 g (σ) with the image I in point x,
and similarly for Lxy(x, σ) and Lyy(x, σ).Gaussians are best favorable to scale space analysis. By using integral images the approximate second order Gaussian derivatives are evaluated very fastly on independent of size.
Fig 3: Left to right: the (discretized and cropped) Gaussian second order partial derivative in y- (Lyy) and xy-direction (Lxy), respectively.
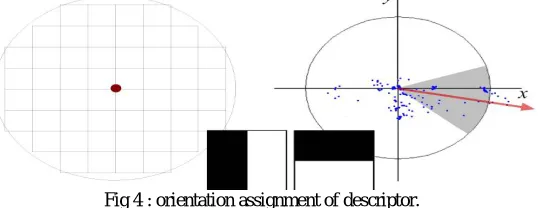
Descriptor:The descriptor describes the distribution of Haar-wavelet responses with in the nearest interest point. By using again integral image for speed, reducing the time for feature computation & matching. In addition to introduce new step based on laplacin, which increases not only the matching speed but also robustness of descriptor. To generate key point’s descriptor vector, a region around key point is considered &Haar wavelet filter responses in horizontal dx &dy vertical directions are computed. These responses are used to obtain dominant orientation in circular region. Square region is considered around each key point & aligned along the direction of dominant orientation.
Fig 4 : orientation assignment of descriptor.
The square region is further divided into sub regions &haar wavelet (dx, dy) in horizontal and vertical directions of their absolute values for each sub region ae used as feature values.
Feature vector = { | | | |}
The surf feature vector of key point is obtained by concatenating feature vector from all 16-sub regions around key point.
Feature matching: In matching module, two fingerprints images are matched with help of extracted local features depending upon matching result two fingerprints are declared as matched or non-matched.
Fig 5: Feature matching
Pyramid extension of histogram oriented gradient (PHOG)
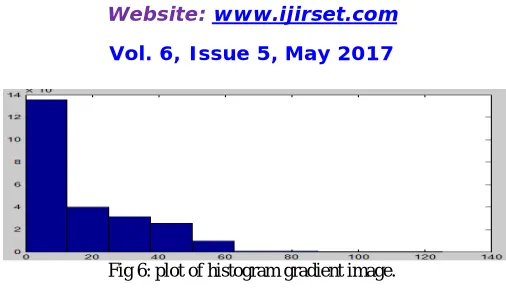
The local shape attributes are extracted andintroduced using PHOG. HOG captures the intensity gradients and edge directions to describe the shape and appearance in an image. Histogram oriented gradient (HOG) is a feature descriptor used in computer vision & image processing for the purpose of object recognition/ detection.
Fig 6: plot of histogram gradient image. Algorithm
1. Find Gradient values.
2. Compute a matrix for histogram value. 3. Compute another matrix for gradient value. 4. Region of interest is extracted.
5. Number of pyramid levels & number of bins are specified. 6. Calculate sum of gradient values for all the bins.
7. Calculate sum of gradient values for all the pyramid levels.
Pyramid of histogram oriented gradients are used for better representation of spatial relationship of the oriented gradients. The objective of PHOG is to take the spatial property. The PHOG image descriptor is a extension of all the HOG vectors; each of which is computed for each grid cell at each pyramid.
Level 0 is represented by K-bin histogram. Level 1 is represented by 4K-bin histogram.
and the final PHOG descriptor of the image is a vector with dimensionality. Each bin in histogram represents the number of edges that have orientations within a certain range.
The no. of points in each grid cell is then recorded. This is a pyramid Representation because the number of points in a cell at one level is simply the sum of those contained in the four cells is divided into at the next level. The cell counts at each level of resolution are the bins counts for the histogram representing that level.
Principal component analysis (PCA):
Principal component analysis was invented by 1901 by Karl Pearson. It was later developed and named by Harold Hoteling in 1930.PrincipalComponent Analysis, also known as the Karhunen-Lóeve transform, is a widely used technique in pattern recognition to approximate the original n-dimensional data with a lower m-dimensional feature vector.
Principal component analysis (PCA) is one of the statistical techniques frequently used in signal processing to the data dimension reduction or to the data decorrelation. The first application consists in the image colour reduction while the three colour components are reduced into one containing a major part of information. The second use of PCA takes advantage of eigenvectors properties for determination of selected object orientation.
It is a statistical procedure that uses an orthogonal transformation to convert a set of observations of possible correlated variables into a set of values of linearly uncorrelated variables are called principal components. The no. of principal components is less than or equal to the smaller of original variables.This transformation is defined in such a way that the first principal component has the largest possiblevariance (that is, accounts for as much of the variability in the data as possible), and each succeeding component in turn has the highest variance possible under the constraint that it is orthogonal to (i.e., uncorrelated with) the preceding components. Principal components are guaranteed to be independent if the data set is joint normally distributed. PCA is sensitive to the relative scaling of the original variables. PCA is mathematically defined[8] as an orthogonal linear transformation that transforms the data to a new coordinate system such that the greatest variance by some projection of the data comes to lie on the first coordinate (called the first principal component), the second greatest variance on the second coordinate, and so on.
Image classification stage
In this stage, we describethe dynamic score level integration algorithm for the purpose of selecting the best classifier during decision making.
SVM produced higher accuracy with SURF+PHOG features compared to Random Trees (RT). On the other hand, using RT as the classifier for Gabor features produced higher accuracy in three out of the four sensors. As the focus of our method is towards generalization, we do not select the best performing classifier for individual sensors. Instead, we select the overall best performing classifier which generalizes well over multiple sensors. Due to these factors, we select SVM for SURF+PHOG features.
Support vector machine (SVM)
The main idea of the SVM algorithm [2] is that given a set of points which belong to one of the two classes, it is needed an optimal way to separate the two classes by a hyperplane as seen in the below figure. This is done by: maximizing the distance (from closest points) of either class to the separating hyperplane minimizing the risk of misclassifying the training samples and the unseen test samples.
Depending on the way the given points are separated into the two available classes, the SVMs can be:
Linear SVM
Non-Linear SVM
Score level integration
The final component of biometric system is decision or matching component. Decision component compares the query biometric template of claimed person and assign them a similarity score. That score is used for make decisions about the matching (or) not of the templates.
In verification system if the similarity score are greater than fixed threshold the system decides that template belongs to same person. In identification system the database templates are compared query template & higher similarity score templates are selected to decide if some person was identified on database.
IV. EXPERIMENTAL RESULTS
The experiments of the proposed algorithm on fingerprint liveness detection are present in database which is collected fro m different fingerprint scanner i.e. cross match, biometrika, italdata, swipe. The database contains sample eight images of both live and fake of the four individual persons.
Fig 10: A samples live and fake fingerprint images of individual persons.
Flow of Experiment: The first step is pre-processing of the fingerprint images. To eliminate the white region background of the image are cropped and resized. The cropped image has some noise to reduce the noise by using median filter without decreases the sharpness of the image. To improve the contrast of an image using the histogram equalisation for better visualised of ridge structure of an image.
Original image cropped and resized
Histogram equalization Noise reduced
Fig 11:pre-processing of the fingerprint image.
The next step after image pre-processing is the dataset construction for SURF and PHOG dimensionality reduction processing. We construct the data set by reshaping the interest point or key point from 180 to lower value for purpose of accessing the less memory to store data in database.
Fig 12: SURF feature points
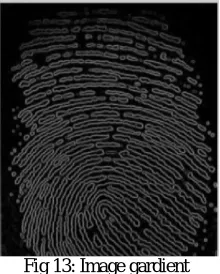
In PHOG the image gradient features are extracted for their directional changes in the pixel of an image. It attributes to extract the gradient feature for edge detection and they produce the feature vectors with dimensionality. Combine the feature which are extract from both SURF and PHOG . Further apply the principal component analysis on both feature vectors to reduce their dimensionality.
Fig 13: Image gardient
After data dimensionality reduction the next step is data learning and classifying using SVM. We divide the data in to 4 sets equally (each set is corresponding to each specific person), three sets are used for training and remaining one for testing. These procedures are above repeated so that each set is used once as testing set. The average result from the classifier if its trained data is comparatively matched with database data is considered as the final fingerprint liveness recognition of the experiment.
V. CONCLUSION
REFERENCES
[1]. Yangyang Zhang, Jie Tian, Xinjian Chen, Xin Yang, and Peng Shi, “Fake finger detection based on thin-plate spline distortion model,” in Advances in Biometrics, Seong-Whan Lee and StanZ. Li, Eds., vol. 4642 of Lecture Notes in Computer Science, pp. 742–749. Springer Berlin Heidelberg, 2007.
[2]. Reza Derakhshani, Stephanie A.C. Schuckers, Larry A. Hornak, and Lawrence O'Gorman, “Determination of vitality from a non-invasive biomedical measurement for use in fingerprint scanners,” PatternRecognition, vol. 36, no. 2, pp. 383 – 396, 2003, Biometrics.
[3]. S.B. Nikam and S. Agarwal, “Texture and wavelet-based spoof finger-print detection for fingerprint biometric systems,” in Emerging Trendsin
Engineering and Technology, 2008. ICETET '08. First International Conference on, July 2008, pp. 675–680.
[4].N. Manivanan, S. Memon, and W. Balachandran, “Automatic detection of active sweat pores of fingerprint using highpass and correlation filtering,” Electronics Letters, vol. 46, no. 18, pp. 1268–1269, September 2010.
[5]. Heeseung Choi, Raechoong Kang, Kyungtaek Choi, and Jaihie Kim, “Aliveness detection of fingerprints using multiple static features,” 2007. [6]. Luca Ghiani, Paolo Denti, and GianLuca Marcialis, “Experimental results on fingerprint liveness detection,” in Articulated Motion and
De-formable Objects, FranciscoJ. Perales, RobertB. Fisher, and ThomasB.Moeslund, Eds., vol. 7378 of Lecture Notes in Computer Science, pp. 210–
218. Springer Berlin Heidelberg, 2012.
[7]. Herbert Bay, Andreas Ess, Tinne Tuytelaars, and Luc Van Gool, “Speeded-up robust features (surf),” Comput. Vis. Image Underst., vol. 110, pp. 346–359, jun 2008.
BIOGRAPHY
Himabindu Sathyaveti is working as Assistant professor in ECE Dept, ASCET, Gudur, AP,
India. She has been guiding UG & PG students since two years in this institution. She pursued M.Tech from Karunya University, Coimbatore. She presented seven papers in international journals & six international conferences. Her research areas of interest are Embedded systems, Signal & Image Processing.
Amarendra Jadda is working as Associate Professor in ECE Dept, ASIT, GUDUR. He has been