DOI: 10.1534/genetics.105.045963
Quantitative Trait Locus (QTL) Isogenic Recombinant Analysis: A Method
for High-Resolution Mapping of QTL Within a Single Population
Johan D. Peleman,*
,1Crispin Wye,* Jan Zethof,
†Anker P. Sørensen,* Henk Verbakel,*
Jan van Oeveren,* Tom Gerats
‡and Jeroen Rouppe van der Voort*
*Keygene N.V., NL-6708 PW, Wageningen, The Netherlands,‡Department of Experimental Botany, Plant Genetics, University of Nijmegen, NL-6525 ED Nijmegen, The Netherlands and†Department of Plant Systems Biology, University of Ghent/VIB, B-9052 Ghent, Belgium
Manuscript received May 24, 2005 Accepted for publication June 16, 2005
ABSTRACT
In the quest for fine mapping quantitative trait loci (QTL) at a subcentimorgan scale, several methods that involve the construction of inbred lines and the generation of large progenies of such inbred lines have been developed (ComplexTraitConsortium2003). Here we present an alternative method that significantly speeds up QTL fine mapping by using one segregating population. As a first step, a rough mapping analysis is performed on a small part of the population. Once the QTL have been mapped to a chromosomal interval by standard procedures, a large population of 1000 plants or more is analyzed with markers flanking the defined QTL to select QTL isogenic recombinants (QIRs). QIRs bear a recombi-nation event in the QTL interval of interest, while other QTL have the same homozygous genotype. Only these QIRs are subsequently phenotyped to fine map the QTL. By focusing at an early stage on the in-formative individuals in the population only, the efforts in population genotyping and phenotyping are significantly reduced as compared to prior methods. The principles of this approach are demonstrated by fine mapping an erucic acid QTL of rapeseed at a subcentimorgan scale.
A
majority of agronomically important traits like flowering time, fruit quality, reproductive behav-ior, and stress tolerance exhibit a continuous phenotyp-ical variation (e.g., Patersonet al.1988; Mackay2001;Morganteand Salamini2003). Such traits are
deter-mined by a number of genes, collectively termed quanti-tative trait loci (QTL), each contributing partially to the phenotype in interaction with additional genetic and environmental factors. The polygenic nature of such complex traits has seriously hindered gene isolation projects and classical breeding approaches, mainly due to the lack of discrete phenotypic segregations. A reli-able phenotypic evaluation of a quantitative trait is af-fected by, among other factors, environmental factors, the number of replicates, the number of polygenes in-volved and the magnitude of their effect, and the way in which these loci interact. For example, the phenotypic effect of a QTL may easily remain undetected as a result of epistatic interactions with other genetic factors.
DNA marker technologies have greatly enhanced the ability to unravel the genetic basis of traits expressing continuous phenotypic variations. The use of dense ge-netic maps enables the assessment of significant associ-ations between trait values and markers. This has opened a way to use DNA markers for indirect selection
of quantitative traits via marker-assisted selection. The key properties of DNA markers that make them favor-able for indirect selection are their abundance, their stability, and their reliability. However, despite the suc-cess in polygene mapping, the application of DNA mark-ers for unraveling complex traits is not straightforward. Current QTL mapping strategies are labor intensive and generally lead to the assignment of a QTL to a region of 10–20 cM. In the case of molecular breeding applica-tions, such a rough localization leads to inefficient indi-rect selection; the association between the marker and the trait may become lost during the breeding process, negative traits may be closely linked with the QTL and will not be separated by selecting a large region, and identification of different alleles through haplotyping is cumbersome and expensive for large genomic regions. Hence, there is a need for efficient methods that allow the precise mapping of QTL.
Key factors in high-resolution QTL mapping strate-gies are the number of identified recombination events, the marker density, and the trait complexity. Sufficient recombination events in QTL intervals can be identified for species where large progenies can be generated easily (summarized in Darvasi1998) but this approach
is constrained for humans and many other animal spe-cies having a small effective population size. Alternative fine-mapping strategies have been devised for such spe-cies using ‘‘historical recombination events’’ (Xiongand
Guo1997), which are reflected by haplotype frequencies
1Corresponding author:Keygene N.V., Agro Business Park 90, 6708 PW Wageningen, The Netherlands. E-mail: [email protected]
in a general population. QTL may be fine mapped by means of linkage disequilibrium mapping methods, when sufficient resources for DNA marker typing are available (Riquetet al.1999; Thornsberryet al.2001). In
gen-eral, all these methods require large phenotyped popula-tions to reduce the trait complexity (Darvasiet al.1993;
Darvasi1998), which renders the cost for these
applica-tions relatively high. In plants, QTL have been fine map-ped by applying a mapping strategy based on the analysis of large progenies derived from near-isogenic lines (NILs) (Fraryet al.2000; Fridmanet al.2000; El-Din
El-Assalet al.2001; Takahashiet al.2001; Koumproglou
et al.2002; Liuet al.2002; Salviet al.2002; Bentsink
et al.2003). This approach requires the construction of highly inbred lines involving many generations prior to generating the cross needed for fine mapping.
Instead of homogenizing the complete genetic back-ground, as in the NIL approach, we have chosen to focus specifically on the loci involved in expression of the phe-notype. The strategy described here involves simulta-neous fine mapping of QTL already at the F2stage rather
than producing inbred lines prior to fine mapping. The main principle of the approach is the selective genotyp-ing and phenotypgenotyp-ing of only those plants that yield infor-mation on the map position of the QTL. Such plants are selected after a first rough-scale mapping by standard methods (e.g., 200 F2individuals). After identification of
the QTL for the trait of interest, a larger part of the pop-ulation (e.g., 1000 F2plants) is screened with markers
flanking the QTL to identify sets of QTL isogenic recom-binants (QIRs). QIR plants carrying a recombination event in one QTL while they are homozygous at all other QTL are most informative. The trait complexity can thus be reduced to a monogenic trait as plants with all but one QTL having an identical homozygous genotype are selected. These QIRs are subsequently genotyped with sufficient markers at the recombinant QTL region to precisely map the recombination event within the QTL-bearing interval. Phenotyping the QIRs becomes more reliable by reducing the trait complexity as these plants are nearly isogenic for all QTL that affect the trait. We demonstrate that for fine mapping oligogenic traits, homogenizing the background genome is not required. Unlike the NIL approach, by controlling the QTL involved and comparing the phenotypic values of the QIRs with control plants, the QTL under study can be precisely mapped. We have applied the QIR ap-proach successfully in a number of crop plants. In this article the method is demonstrated in more detail by fine mapping a QTL responsible for erucic acid content in rapeseed (Brassica napusL.).
MATERIALS AND METHODS
Plant material:The cultivar Tapidor is a so-called low-erucic-acid rapeseed and has been selected in the past for nutritional purposes. The cultivar Sollux is a high-erucic-acid rapeseed,
useful for industrial processing. The cultivars Tapidor and Sollux, referred to as parents 1 and 2 (P1 and P2), respectively, were crossed to create an F2population of 2803 individuals. Of these 2803 individuals, a total of 1174 individuals were used in this study: a randomly selected set of 184 individuals for rough-scale mapping and, at a later stage, an additional set of 990 individuals for fine mapping. Leaf material from all samples was obtained from Advanta BV. DNA was isolated using a modified CTAB procedure (Stewardand Via1993). Erucic acid content in the seed oil was estimated by gas chromatog-raphy in a mixture of five seeds harvested from one F2plant and is expressed by the percentage of total fatty acids in an extracted sample. All phenotypes were determined twice using the same seed sample. For QIRs, recombinants, and control plants, two samples of five seeds per plant were analyzed. A total of 25 plants of Tapidor and Sollux were analyzed to determine the variation in erucic acid content among the low-and high-erucic-acid classes.
AFLP analysis:The AFLP protocol as described in Voset al. (1995) was followed using the enzyme combination EcoRI/ MseI (13/13). Primers used for generating the fingerprints are listed in Table 1. AFLP fingerprints were generated by loading the PCR products on 4.5% polyacrylamide gels. The gels were fixed for 30 min in 10% acetic acid (Sambrooket al. 1989) before exposure to phosphorimaging screens. To ex-ploit the full information content of AFLP markers in an F2 population, the markers were codominantly scored using pro-prietary scoring software. Fingerprinting patterns were visual-ized using a Fuji BAS-2000 phosphorimage analysis system and the scoring was achieved using proprietary software.
Bulked segregant analysis:Bulked segregant analysis (BSA) was performed according to Michelmore et al. (1991) to identify candidate markers linked to erucic acid QTL. A total of four pools (two high erucic and two low erucic acid) of 10 plants per pool were assembled with selected individuals from the total population of 1174 individuals. The pools were screened with 384 primer combinations. This BSA was applied to select a set of primer combinations for fingerprinting the mapping population (see below) to construct a genetic map harboring erucic acid QTL regions enriched with markers. A second set of two pools was composed on the basis of the genotypes for markers M5 and M10 (Table 2a), which flank the erucic acid QTL namedE1. These pools were screened with an additional set of 646 AFLP primer combinations to increase marker density in the QTLE1-bearing region.
Map construction and statistical analysis: Genetic maps were calculated using the computer package JoinMap version 2.0 (Stam1993). To calculate the size of the QTL interval, a maximum-likelihood estimate was made of the pairwise re-combination frequencies between the most flanking markers and the trait locus. All recombination frequencies were con-verted into map distances by use of the Kosambi mapping function. QTL analyses were performed by using MapQTL (VanOoijenand Maliepaard1996a,b) and QTL Cartogra-pher software (Wanget al. 2001–2004). Both the nonpara-metric rank-sum test of Kruskal-Wallis (see, e.g., Sokaland Rohlf1995) and two parametric methods, interval mapping (Lander and Botstein 1989) and multiple-QTL mapping (MQM) ( Jansen1993; Jansenand Stam1994), were applied. Threshold values for assigning a QTL to a map position are P,0.001 for the Kruskal-Wallis test and a LOD score of 3.0 for interval and MQM mapping.
QIR frequency calculation:The probability of finding the required QIR plants in an F2 population is calculated by multiplying the probability of the occurrence of the recom-bined QTL with the probability of the occurrence of each non-recombined QTL. Given the probability,p, of a recombination event in the QTL defined region as inferred from the map
distance via the Kosambi mapping function, the probability of finding a single recombinant is defined as 2p(1ÿp). The product [0.5(1ÿp)2] is the probability of finding a homozygous
nonrecombined QTL. Hence, for a three-QTL system,e.g., the probability of finding any QIR plant is given by the formula: 2p1(1ÿp1)(0.5(1ÿp2)2)(0.5(1ÿp3)2). Similarly, the probability for identifying a specific QIR plant in a BC1 population is determined by the probability of finding any recombined QTL (p1) multiplied by the probability of the occurrence of each homozygous nonrecombined QTL 0.5(1ÿp2).
RESULTS
General outline of QIR analysis:The key steps in the QIR analysis are outlined in Figure 1. After a rough-scale mapping on a phenotyped subset of the population, sets of markers that border the genomic regions containing the identified QTL are selected. The entire population is subsequently screened with markers flanking the interval of the QTL that is to be fine mapped. Individ-uals carrying a recombination between two markers, flanking a specific QTL, are then analyzed with markers flanking the other QTL to determine the genotypes at those region(s). In this way QIRs—individuals that har-bor a recombination event within the selected region and are homozygously isogenic at all other QTL region—-are identified, while the remainder of the genome is ignored. Only the QIRs are subsequently phenotyped since these are the only plants bearing information on the position of the QTL. Phenotype measurements can be directly done on the QIR F2 plants or, if a higher
reliability is desired, on small F3progenies of the selfed
QIRs. This approach allows us to study the effect of re-combination events within the targeted region on the respective phenotype while the genotype under study is homogeneous for the major additional loci involved in the trait. In concert with the selective phenotyping ap-proach, a screening for extra markers in the targeted region can be performed by a BSA to further distinguish recombinants from each other. For this purpose, QTL-allele-specific bulks are constructed on the basis of the scores of the markers that define the QTL interval. Fine mapping of the QTL is subsequently achieved by a combined analysis of the QIR marker genotypes and the phenotypic data.
Rough-scale mapping of erucic acid QTL:To identify the QTL regions involved in erucic acid content in rape-seed, a genetic map was constructed on the basis of a Tapidor3Sollux cross. To select AFLP primer combina-tions that are enriched with candidate markers for the erucic acid QTL regions, a BSA was carried out as de-scribed inmaterials and methods. The selected primer
combinations were used to construct a genetic linkage map of theB. napusgenome. A set of seven primer com-binations (E35/M51, E54/M55, E55/M47, E64/M62, E65/M59, E87/M47, and E87/M51) was selected to fingerprint a mapping population of 184 F2 plants.
These primer combinations yielded 10 of the 17 candi-date erucic acid QTL-linked markers that were identi-fied in the BSA screening. With an additional set of 24 primer combinations, a total of 238 AFLP markers that
segregated in the 184 F2individuals were identified (the
primer combinations used are presented in Table 1). The majority of these 238 AFLP markers were mapped to 18 linkage groups containing four or more markers at a LOD setting of 3.5. One of the larger groups was split into two linkage groups at a LOD setting of 4.5, giving a total of 19 linkage groups. Nine of the linkage groups contained 10 or more markers. A total of eight markers were rejected from the data set as they did not fit well on the map as a result of an unreasonably high frequency of alleged double recombination events. This provided a final linkage map consisting of 230 markers, distributed over 19 linkage groups, corresponding to the number of chromosomes found inB. napus, and covering a total genetic length of1250 cM. The genetic map can be retrieved as supplementary information to this article at http://www.keygene.com/pdf/int_map_rapeseed.pdf.
Two QTL involved in erucic acid content in rapeseed were localized by interval and MQM mapping analyses using MapQTL. These QTL show an additive effect only and separately explain 43 and 31%, respectively, of the variation in erucic acid content. These findings are in agreement with previous studies showing that erucic acid content is controlled by two loci that have additive effects (Harveyand Downey1964; Barretet al.1998;
Fourmannet al.1998). In analogy to these studies, we
refer to these QTL asE1andE2, respectively, where the
E1 locus causes the largest variation in erucic acid content. Additional multiple interval mapping using QTL Cartographer also identified a significant additive-additive interaction effect. Both additive-additive effects com-bined with this epistatic effect explain 77% of the phenotypic variance.
The E1 locus was positioned in a region of 4 cM (95% confidence interval) with a maximum LOD value of 22 in the interval mapping analysis. MQM analyses indicate an even shorter interval of 2.4 cM with a sharp peak at the 11.5-cM position. LocusE2was positioned at the end of a linkage group with a maximum LOD value of 14 in the interval mapping analysis. For both identi-fied QTL, the results showed that the alleles associated with high erucic acid levels are derived from the Sollux parent (P2). TheE1locus having the largest effect on erucic acid content was chosen for further fine mapping by applying the QIR strategy.
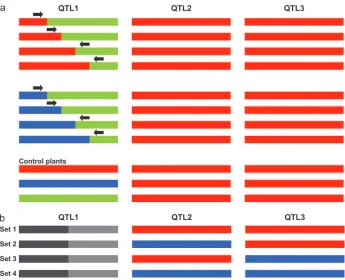
Identification of QIR sets: The principle of con-structing sets of QIRs is shown in Figure 2. A QIR set is defined as a set of plants that carry a recombination event in one QTL while being homozygous for the other
TABLE 1
Identities of all primers used for AFLP fingerprinting
E32/M47 E32/M62 E38/M62 E54/M55 E32/M48 E33/M47 E39/M50 E55/M47 E32/M49 E33/M48 E39/M51 E64/M62 E32/M50 E33/M59 E39/M54 E65/M59 E32/M51 E33/M62 E39/M59 E70/M62 E32/M54 E35/M48 E39/M62 E76/M54 E32/M59 E35/M51 E42/M50 E87/M47 E32/M61 E35/M60 E49/M58 E87/M51
Information about the sequences of the primer extensions can be found at http://www.keygene.com/publications/index. htm.
QTL (Figure 2a). As an example, Figure 2 exemplifies a situation in which three QTL apply. In this case, six QIR sets can be constructed (Figure 2b). For the two-QTL sys-tem underlying erucic acid content in rapeseed, three QIR sets were collected: recombinants forE1combined with homozygous for theE2Tapidor allele, homozygous for the E2 Sollux allele, or heterozygous at locus E2
(Figure 3). In this case, the high reliability of measuring erucic acid content allowed us to construct an informa-tive QIR set consisting of plants heterozygous for locus
E2. This provided a large set of informative recombi-nants, which could be used for fine mapping the E1
locus. It is noted, however, that the effectiveness of a heterozygous QIR set for fine mapping is strongly dependent on the degree of dominance of the QTL under study.
The E1 QTL was positioned in a region of 4 cM between markers M6 and M10, M11/12 at positions 10.0 and 14.1 cM, respectively (Figure 3, Figure 4; Table 2a). Both markers M3/M4 at 7.7 cM and M11/M12 at 14.1 cM were identified as biallelic markers in this pop-ulation: the parental alleles of the markers differ from each other due to a small insertion/deletion in the marker sequence. These markers were used to screen an additional set of 990 individuals from the Tapidor 3
Sollux population to identify F2 individuals that are
recombinant in this region. Of 1174 F2plants screened,
88E1recombinants were identified. To ascertain which of these recombinants were QIRs and to sort them into different QIR sets, these 88 individuals were screened with markers covering the E2 region. This screening revealed a total of 62 QIR plants for theE1region be-tween centimorgan positions 7.7 and 14.1. The remain-ing set of 16 plants bore a recombination in both theE1
and theE2region.
Phenotyping of QIRs:The erucic acid content of the 62 QIRs was determined as described inmaterials and methods. To fine map theE1gene within the
recombi-nant map, the phenotypic scores were converted to ge-notypic scores at the E1 locus. For this purpose, the genotypes at theE1locus were determined by compar-ing the phenotypic values of the QIR plants with the control plant phenotypes (Figure 3). In case the QIR phenotypes fell outside the range of the control plant phenotypes, additional information on expected geno-type scores at theE1locus was used as deduced from the marker scores at theE1interval flanked by markers M6 and M10. Applying this strategy,E1genotype scores were unambiguously determined in 54 of 62 cases (87%) (Figure 3). In 8 cases no distinction could be made be-tween homozygosity or heterozygosity at theE1locus for either of the parental alleles. By using theE1genotype scores, the size of the E1 interval could be narrowed down to the region flanked by markers M7 and M8. The
E1 QTL interval size is thereby further reduced from 2.4 cM (as delineated by the MQM method; see Figure 4) to 1.1 cM by use of the QIR method.
Fine mapping of the E1 locus: To identify markers that could distinguish the 28 recombination events (21 QIRs and seven recombinants) located between mark-ers M7 and M8/9 flanking the E1gene, an additional BSA was performed. For this purpose, two-QTL allele-distinguishing bulks of F2plants were constructed on
the basis of the genotypes for markers M5 and M10. A total of 646 primer combinations were screened. To-gether with the initial 384 primer combinations of the first BSA round, a total of 1030 primer combinations were used in BSA screenings to identify markers located in theE1interval. With an average of 7.5 markers per primer combination between the Tapidor and Sollux parents, this corresponds to an estimated total of 7700 loci screened. Five primer combinations that generated a marker scoring present in all of the ‘‘1’’ pool indi-viduals and absent in all of the ‘‘ÿ’’ pool individuals were identified. Of these five primer combinations, four markers could be codominantly scored in a set of 31 F2plants that harbored recombination events between
markers M5 and M10. These four markers (indicated by M15, M16, M17, and M18; Table 2a) could be located on the linkage map presented in Figure 4 between centi-morgan positions 10.0 and 11.3. In conclusion, theE1
interval is flanked by markers M7, M17, and M18 at one side and marker M8/9 at the other side. On the basis of the phenotypes of the QIRs bearing a recombination within this interval, the E1 gene is positioned near marker M8/9 at a distance of 0.1 cM. Markers M7, M17, and M18 are localized farther away from theE1gene at 1.0 cM distance (Figure 4). Note that by fine mapping, the relative position of theE1gene on the map changed from 11.3 cM (determined as most likely by MQM) to 12.3 cM (determined by QIR analysis).
DISCUSSION
We describe a novel strategy for simultaneous fine mapping of QTL at a subcentimorgan scale within a single population. The major advantages of QIR analysis compared to other QTL mapping approaches are sum-marized below.
1. The QIR analysis strategy allows QTL mapping and fine mapping within a single population. In contrast to the NIL-like approaches, commonly used for QTL fine mapping in plants (Eshed and Zamir 1995;
Tuinstraet al.1997; Mackay2001; Morganteand
Salamini2003), only those loci that are involved in
the phenotype, instead of the complete genetic back-ground, are homogenized. Applying QIR analysis circumvents the need for repeated backcrossing. Only one selfing generation of the selected QIR plants at an F3stage may be required to enhance the precision
of phenotyping in the population (see below). 2. QIR analysis involves a reduction of the amount of
Figure3.—Overview of the genotypes of the QIRs selected for theE1locus and their corresponding phenotypic values. (Right) The range of the phenotypic values of the QIR control plants and the average values and their standard deviations. The pheno-typic values of the individual QIR plants are indicated at the most likely position of theE1QTL. (a) The two QIR sets in which the E2QTL is homozygous for either parent allele. (b) The QIR set, which is heterozygous at theE2QTL.
200 markers on,e.g., 1200 F2individuals, the amount
of genotyping can be reduced to 20% of the initial cost for a two-QTL system by starting with genotyp-ing these 200 markers on 200 F2’s and
subse-quently testing the four markers flanking the two QTL on an additional set of 1000 F2’s to select QIRs.
A reduction in the amount of phenotyping work is exemplified in the case described here in which only the initial mapping population (184 plants), QIRs (62 plants), additional recombinants at the
E1locus (26 plants), and controls (90 plants), repre-senting 31% of the total progeny, were phenotyped. 3. After initial detection of the QTL in the first stage, the
trait complexity is simplified to monogenic effects by composing QIR sets and comparing their
pheno-types with those of the control plants. In addition, the precision of phenotyping can be enhanced by con-structing F3progenies after selfing the QIR plants.
This offers the additional advantage that the zygosity at the trait locus can be deduced from segrega-tion of the phenotype in the selfing progeny and repeated phenotyping can be performed in different environments.
4. The construction of QIR sets by marker selection on an extended progeny results in a reduction of the chance of assigning a QTL to a region where no QTL exists (type I error). The phenotype data on the QIR sets should further confirm the map positions de-tected in the initial mapping stage prior to the fine mapping.
Figure4.—Comparison of the QTL mapping results at theE1locus as obtained by three differ-ent methods. (Top) The LOD plots obtained by interval mapping and MQM methods. (Middle) TheE1-containing linkage group with the posi-tions of the markers analyzed (Table 2a). The markers obtained by a BSA screening are indi-cated by shading. (Bottom) A summary of the number of recombinants in the marker interval M7–M8/9. Of 28 recombinants, a total of seven E1genotypes (left) and oneE1genotype (right) unambiguously indicated the position of theE1 gene on the basis of phenotypes. For determina-tion of the genetic distance, the number of re-combinants was allocated to each side of theE1 gene on the basis of a ratio of 7:1. In this way, the position of theE1gene is determined to be at 1.0 cM from markers M7/M17/M18 and at 0.1 cM from markers M8/9. A comparison of the mapping resolution of the three methods is illustrated by the position of theE1gene at the LOD plot as indicated by the arrow.
5. The effect of reducing the complex inheritance by phenotyping QIR sets also provides the opportunity to fine map QTL with a moderate-to-low heritability. This results from the fact that by fixing all QTL except one within a QIR set, the QTL-specific heritability is increased as compared to the initial F2population.
For example, in a three-QTL system where the sep-arate effects of QTL1, QTL2, and QTL3 account for 30, 20, and 10% of the total phenotypic variance, respectively (40% is attributed to the environment), the QTL3-specific heritability is doubled to 0.2 [0.1/ (0.1 1 0.4)]. The relative increase in progeny size during QIR selection also supports the fine mapping of QTL exhibiting moderate-to-low heritabilities. Scho¨ net al.(2004) points out that adding more plant
genotypes is more effective for maximizing the pro-portion of the genotypic variance explained than for replicating the same genotypes. These theoretical considerations on fine mapping small-effect QTL by the QIR method are further corroborated by practical data on pepper and cucumber (Figure 5; J. Rouppe van der Voort, H. Verbakel and
TABLE 2
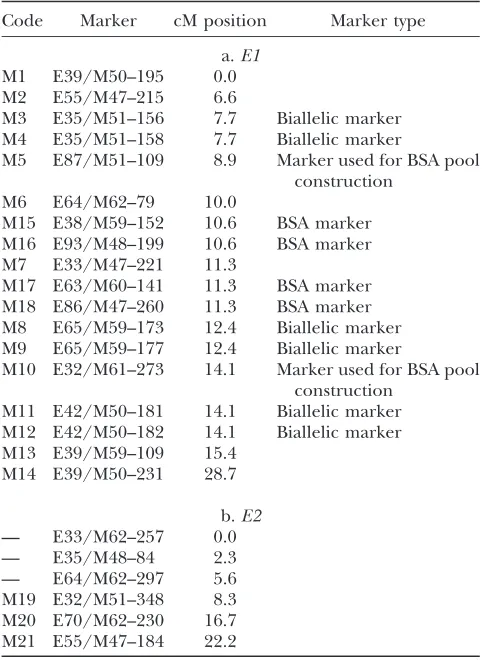
Identity of markers used for fine mapping QTLE1andE2
Code Marker cM position Marker type
a.E1 M1 E39/M50–195 0.0 M2 E55/M47–215 6.6
M3 E35/M51–156 7.7 Biallelic marker M4 E35/M51–158 7.7 Biallelic marker
M5 E87/M51–109 8.9 Marker used for BSA pool construction
M6 E64/M62–79 10.0
M15 E38/M59–152 10.6 BSA marker M16 E93/M48–199 10.6 BSA marker M7 E33/M47–221 11.3
M17 E63/M60–141 11.3 BSA marker M18 E86/M47–260 11.3 BSA marker M8 E65/M59–173 12.4 Biallelic marker M9 E65/M59–177 12.4 Biallelic marker
M10 E32/M61–273 14.1 Marker used for BSA pool construction
M11 E42/M50–181 14.1 Biallelic marker M12 E42/M50–182 14.1 Biallelic marker M13 E39/M59–109 15.4
M14 E39/M50–231 28.7
b.E2
— E33/M62–257 0.0 — E35/M48–84 2.3 — E64/M62–297 5.6 M19 E32/M51–348 8.3 M20 E70/M62–230 16.7 M21 E55/M47–184 22.2
A biallelic AFLP marker is characterized by two fragments differing by a small insertion/deletion and segregating in the opposite phase, thereby representing the alternate alleles of the same locus.
J. Peleman, unpublished results). In both cases, a
three-QTL system was examined and the minor three-QTL that were successfully fine mapped explained 7 and 14% of the phenotypic variance, respectively.
6. Epistatic interactions detected in the initial mapping phase can be further investigated by analyzing QIR sets. Epistatic interactions may render certain QIR sets uninformative and therefore can be selected against during the composition of QIR sets. This lows focusing only on those combinations of QTL al-lele configurations that should be tested as predicted from the initial mapping population. The approach is also an advantage over the NIL approach as it al-lows revealing all gene actions from complete dom-inance to complete recessiveness or overdomdom-inance. 7. Finally, and importantly, QIR analysis enables fine mapping directly within breeding populations. It allows an early integration of QTL analyses in breed-ing programs, which is expected to result in enhanc-ing the effectiveness of marker-assisted selection on QTL. The identification of QIRs that harbor close recombination events provides a way to reduce link-age drag and can be of key importance in introgress-ing interestintrogress-ing QTL in commercial varieties.
There are also limitations in the use of QIR method. First, the suitability of the QIR method is determined by the effectiveness of the initial F2(preferred) mapping
population. Beavis (1998) has shown in a simulation
study that, although with limited power, even QTL with a low heritability can be detected in a 40-QTL system by F2 mapping. The probability of identifying QTL with
explained variances of 5 and 10% is 0.38 and 0.56, respectively. These data differ somewhat with Van
Ooijen (1992) who calculated probabilities of 0.29
and 0.79, respectively. Nevertheless, these simulation studies, which are supported by practical data (e.g., Scho¨ net al.2004), show that such experimental design
allows the initial mapping of small-effect QTL. Obvi-ously, these probabilities are affected by the number of replications and environments. These issues can also be addressed by multiple testing of single F2plants
(mul-tiple samples of one plant as in, e.g., disease testing), production of stem cuttings of F2plants, or testing F3
families of a single F2plant.
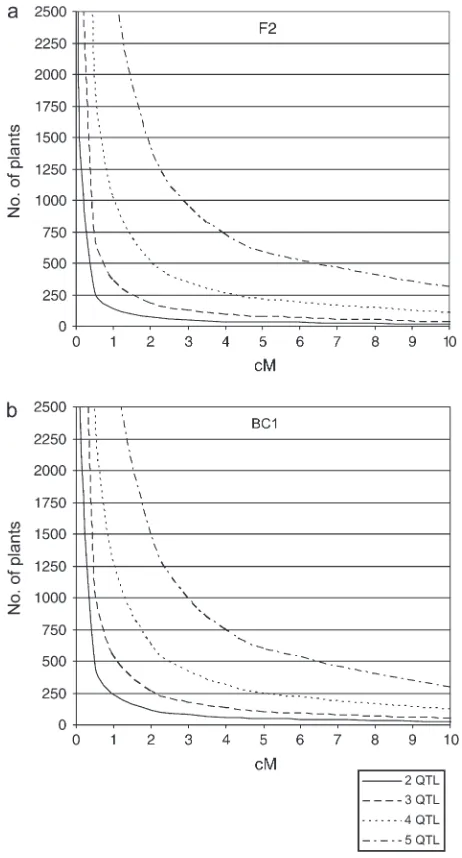
A second limitation is inherent in the fact that the probability of identifying a QIR bearing a recombina-tion in one QTL and having no recombinarecombina-tions in the other QTL is a function of the number and size of the QTL regions that need to be controlled. Figure 6a shows the relation between the number of F2plants required
to find a recombinant at one QTL and the interval size at this QTL where all other QTL are homozygous within a 15-cM region. On the basis of this relationship it is concluded that the QIR method is most effective for up to five segregating QTL underlying the trait of interest. For obligate outcrossers, a BC1population type should
be constructed for fine mapping. In Figure 6b, the number of plants as a function of the size of the QTL regions that need to be fine mapped is presented. Figure 6b shows that the effectiveness of finding QIRs in F2or BC1population types is very similar. However, in a
BC1 population, fine mapping is restricted either to
dominant QTL segregating from the donor parent or to recessive QTL segregating from the recurrent parent.
The impact of a maximum number of five QTL should be viewed within the context of the emerging picture that the underlying model of trait complexity shows a trend of only a few loci with large effects rather than many QTL with equally small effects (Young1996;
Kearsey and Farquhar1998; Mackay 2001; Barton
and Keightley2002). These observations do not refute
Figure6.—Number of plants required to find a QIR plant as a function of the size of the QTL interval (in centimorgans) in an F2population (a) and in a BC1population (b). For de-termination of these plots, all other nonrecombinant QTL have a fixed interval size of 15 cM.
the latter infinitesimal model of quantitative genetics as the corresponding data may be strongly biased by small sample sizes (Beavis1998; Scho¨ net al.2004) or genetic
effects (Bostet al.2001). However, irrespective of the
underlying model of polygenic traits, it appears in practice that focusing on a few major QTL is of great value for breeding and cloning purposes (Tanksley
and Nelson 1996; Mackay 2001; Morgante and
Salamini2003).
In the rapeseed example described, we have been able to delimit the region between theE1QTL and the closest marker to 0.1 cM. Within the 1.1-cM interval defined by the markers flanking theE1locus, a total of 28 QIRs and recombinants were found. Despite the extra screening of 646 primer combinations, no addi-tional markers could be found within the 1.1-cM E1
interval. Given the number of AFLP loci screened, the QIR strategy enabled us to fine map theE1 gene in a presumably small physical interval. When considering the degree of AFLP polymorphism between the Tapidor and Sollux parents and a 920-Mbp haploid B. napus
genome size, one marker is expected every 120 kb on average (920 Mbp divided by the number of polymor-phic loci screened). Assuming that these markers are equally distributed over theB. napusgenome, this would imply that at least one marker is localized within 60 kb of theE1gene. An alternative estimate of the physical size of the interval is obtained from the 740-kbp/cM ratio deduced from the genetic map used in this study. On the basis of this ratio, at least one of the three markers that flank theE1gene at one side may be localized at a distance of 250 kbp from the gene. At the other side, the distance between the marker M8 and the E1 gene is estimated to be 74 kbp. The occurrence of 28 recombi-nants within the smallest interval indicates a region of high recombination frequency close to theE1gene, a phenomenon previously encountered at other fine-mapped QTL (Fridmanet al.2000; Salviet al.2002).
In previous years, we have successfully applied the QIR strategy, among others, in pepper and cucumber (Figure 5; J. Rouppe van derVoort, H. Verbakeland
J. Peleman, unpublished results). In the case of fine
mapping a polygenic resistance trait in pepper, we have screened3000 AFLP loci and used an F2progeny size
of 450 to narrow down the QTL interval sizes to 1.5 and 2.4 cM, respectively. In the case in cucumber, two of the three QTL were fine mapped by selecting heterozygous F2individuals for one QTL and homozygous ones for
the other QTL. In the subsequent F3populations, the
identification of QIRs was increased as the probability of finding QIRs did not depend on the recombination frequencies at the additional QTL. The cucumber F3
progeny consisted of 184 individuals, of which 44 and 55 QIRs were selected for the two mapped intervals. Screening of2200 AFLP loci resulted in fine mapping two QTL in intervals of 2.5 and 3.5 cM. These examples show the effectiveness of the QIR strategy for identifying
markers for indirect selection or, in case population sizes are extended, for map-based cloning of the genes underlying the QTL.
QIR analysis allows the simultaneous fine mapping of QTL within a single population. The combination of selective genotyping andphenotyping allows us to ob-tain more accurate data while a significant reduction in the amount of labor is achieved. QIR analysis facilitates the exploitation of favorable QTL alleles in breeding germplasm by generating marker haplotypes using com-binations of linked markers. This method will ultimately lead to full-scale allele exploitation in advanced breeding strategies like breeding by design (Pelemanand Rouppe van der Voort 2003). In addition, the use of these
markers will greatly facilitate in unraveling the genetic basis of complex traits and the map-based cloning of QTL.
LITERATURE CITED
Barret, P., R. Delourme, M. Renard, F. Domergue, R. Lessireet al.,
1998 A rapeseed FAE1 gene is linked to the E1 locus associated with variation in the content of erucic acid. Theor. Appl. Genet.
96:177–186.
Barton, N. H., and P. D. Keightley, 2002 Understanding
quanti-tative genetic variation. Nat. Rev. Genet.3:11–21.
Beavis, W. D., 1998 QTL analysis: power, precision and accuracy,
pp. 145–162 inMolecular Dissection of Complex Traits, edited by A. H. Paterson. CRC Press, Boca Raton, FL.
Bentsink, L., K. Yuan, M. Koornneef and D. Vreugdenhil,
2003 The genetics of phytate and phosphate accumulation in seeds and leaves ofArabidopsis thaliana, using natural variation. Theor. Appl. Genet.106:1234–1243.
Bost, B., D.deVienne, F. Hospital, L. Moreauand C. Dillmann,
2001 Genetic and nongenetic bases for the L-shaped distribu-tion of quantitative trait loci effects. Genetics157:1773–1787. ComplexTraitConsortium, 2003 The nature and identification
of quantitative trait loci: a community’s view. Nat. Rev. Genet.
4:911–916.
Darvasi, A., 1998 Experimental strategies for the genetic dissection
of complex traits in animal models. Nat. Genet.18:19–24. Darvasi, A., A. Weinreb, V. Minke, J. I. Wellerand M. Soller,
1993 Detecting marker-QTL linkage and estimating QTL gene effect and map location using a saturated genetic map. Genetics
134:943–951.
El-DinEl-Assal, S., C. Alonso-Blanco, A. J. Peeters, V. Razand
M. Koornneef, 2001 A QTL for flowering time in Arabidopsis
reveals a novel allele at CRY2. Nat. Genet.29:435–440. Eshed, Y., and D. Zamir, 1995 An introgression line population of
Lycopersicon pennelliiin the cultivated tomato enables the identi-fication and fine mapping of yield-associated QTL. Genetics141:
1147–1162.
Fourmann, M., P. Barret, M. Renard, G. Pelletier, R. Delourme
et al., 1998 The two genes homologous to Arabidopsis FAE1 co-segregate with the two loci governing erucic acid content in Brassica napus.Theor. Appl. Genet.96:852–858.
Frary, A., T. ClintNesbitt, A. Frary, S. Grandillo, E. Van der
Knaapet al., 2000 fw2.2: a quantitative trait locus key to the
evolution of tomato fruit size. Science289:85–88.
Fridman, E., T. Plebanand D. Zamir, 2000 A recombination
hot-spot delimits a wild-species quantitative trait locus for tomato sugar content to 484 bp within an invertase gene. Proc. Natl. Acad. Sci. USA97:4718–4723.
Harvey, B. L., and R. K. Downey, 1964 The inheritance of erucic
acid content in rapeseed (Brassica napus). Can. J. Plant Sci.44:
104–111.
Jansen, R. C., 1993 Interval mapping of multiple quantitative trait
Jansen, R. C., and P. Stam, 1994 High resolution of quantitative
traits into multiple loci via interval mapping. Genetics 136:
1447–1455.
Kearsey, M. J., and A. G. Farquhar, 1998 QTL analysis in plants:
Where are we now? Heredity80:137–142.
Koumproglou, R., T. M. Wilkes, P. Townson, X. Y. Wang, J. Beynon
et al., 2002 STAIRS: a new genetic resource for functional geno-mic studies of Arabidopsis. Plant J.31:355–364.
Lander, E. S., and D. Botstein, 1989 Mapping Mendelian factors
underlying quantitative traits using RFLP linkage maps. Genetics
121:185–199.
Liu, J., J. VanEck, B. Congand S. D. Tanksley, 2002 A new class of
regulatory genes underlying the cause of pear-shaped fruit. Proc. Natl. Acad. Sci. USA99:13302–13306.
Mackay, T. F. C., 2001 The genetic architecture of quantitative
traits. Annu. Rev. Genet.35:303–339.
Michelmore, R. W., I. Paranand R. Kesseli, 1991 Identification of
markers linked to disease-resistance genes by bulked segregant analysis: a rapid method to detect markers in specific genomic regions by using segregating populations. Proc. Natl. Acad. Sci. USA88:9829–9832.
Morgante, M., and F. Salamini, 2003 From plant genomics to
breeding practice. Curr. Opin. Biotechnol.14:214–219. Paterson, A. H., E. S. Lander, J. D. Hewitt, S. Peterson, S. E.
Lincolnet al., 1988 Resolution of quantitative traits into
Men-delian factors using a complete linkage map of restriction frag-ment length polymorphisms. Nature335:721–726.
Peleman, J. D., and J. Rouppe van derVoort, 2003 Breeding by
design. Trends Plant Sci.8:330–334.
Riquet, J., W. Coppieters, N. Cambisano, J. J. Arranz, P. Berziet al.,
1999 Fine-mapping of quantitative trait loci by identity by de-scent in outbred populations: application to milk production in dairy cattle. Proc. Natl. Acad. Sci USA96:9252–9257. Salvi, S., R. Tuberosa, E. Chiapparino, M. Maccaferri, S. Veillet
et al., 2002 Toward positional cloning ofVgt1, a QTL control-ling the transition from the vegetative to the reproductive phase in maize. Plant Mol. Biol.48:601–613.
Sambrook, J., E. F. Fritschand T. Maniatis, 1989 Molecular
Clon-ing: A Laboratory Manual, Ed. 2. Cold Spring Harbor Laboratory Press, Cold Spring Harbor, NY.
Scho¨ n, C. C., H. F. Utz, S. Groh, B. Truberg, S. Openshawet al.,
2004 Quantitative trait locus mapping based on resampling in a vast maize testcross experiment and its relevance to quanti-tative genetics for complex traits. Genetics167:485–498.
Sokal, R. R., and R. F. Rohlf, 1995 Biometry, Ed. 3, pp. 423–427.
W. H. Freeman, New York.
Stam, P., 1993 Construction of integrated genetic linkage maps
by means of a new computer package: JoinMap. Plant J.3:739– 744.
Steward, C. J., Jr., and L. E. Via, 1993 A rapid CTAB DNA isolation
technique useful for RAPD fingerprinting and other PCR appli-cations. BioTechniques14:748–750.
Takahashi, Y., A. Shomura, T. Sasakiand M. Yano, 2001 Hd6, a
rice quantitative trait locus involved in photoperiod sensitivity, encodes the alpha subunit of protein kinase CK2. Proc. Natl. Acad. Sci. USA98:7922–7927.
Tanksley, S. D., and J. C. Nelson, 1996 Advanced backcross QTL
analysis: a method for the simultaneous discovery and transfer of valuable QTLs from unadapted germplasm into elite breeding lines. Theor. Appl. Genet.92:191–203.
Thornsberry, J. M., M. M. Goodman, J. Doebley, S. Kresovich,
D. Nielsenet al., 2001 Dwarf polymorphisms associate with
var-iation in flowering. Nat. Genet.28:286–289.
Tuinstra, M. R., G. Ejataand P. B. Goldsbrough, 1997
Hetero-geneous inbred family (HIF) analysis: a method for developing near-isogenic lines that differ at quantitative trait loci. Theor. Appl. Genet.95:1005–1011.
Van Ooijen, J. W., 1992 Accuracy of mapping quantitative trait
loci in autogamous species. Theor. Appl. Genet.84:803–811. VanOoijen, J. W., and C. Maliepaard, 1996a MAPQTL: Software for
the Calculation of QTL Positions on Genetic Maps, Version 3.0. CPRO-DLO, Wageningen, The Netherlands.
VanOoijen, J. W., and C. Maliepaard, 1996b MAPQTL: Software for
the Calculation of QTL Positions on Genetic Maps, Version 3.0. Plant Genome IV Abstracts (http://probe.nalusda.gov:8000/otherdocs/ pg/pg4/abstracts/p316.html).
Vos, P., R. Hogers, M. Bleeker, M. Reijans, T. Van deLeeet al.,
1995 AFLP, a new technique for DNA fingerprinting. Nucleic Acids Res.23:4407–4414.
Wang, S., C. J. Bastenand Z-B. Zeng, 2001–2004 Windows QTL
Cartog-rapher 2.0.Department of Statistics, North Carolina State University, Raleigh, NC (http://statgen.ncsu.edu/qtlcart/WQTLCart.htm) Xiong, M., and S. W. Guo, 1997 Fine-scale mapping of quantitative
trait loci using historical recombinations. Genetics145:1201–1218. Young, N., 1996 QTL mapping and quantitative disease resistance
in plants. Annu. Rev. Phytopathol.34:479–501.
Communicating editor: V. Sundaresan