DOI: 10.1534/genetics.105.050914
Genetic Association Analysis of Human Longevity in Cohort Studies of
Elderly Subjects: An Example of the
PON1
Gene in the Danish 1905
Birth Cohort
Qihua Tan,*
,†,1Lene Christiansen,
†Lise Bathum,*
,†Shuxia Li,
†Torben A. Kruse*
and Kaare Christensen
†*Department of Clinical Biochemistry and Genetics, Odense University Hospital, DK-5000 Odense, Denmark and†Institute of Public Health, University of Southern Denmark, DK-5000 Odense, Denmark
Manuscript received September 9, 2005 Accepted for publication December 13, 2005
ABSTRACT
Although the case-control or the cross-sectional design has been popular in genetic association studies of human longevity, such a design is prone to false positive results due to sampling bias and a potential secular trend in gene–environment interactions. To avoid these problems, the cohort or follow-up study design has been recommended. With the observed individual survival information, the Cox regression model has been used for single-locus data analysis. In this article, we present a novel survival analysis model that combines population survival with individual genotype and phenotype information in assessing the genetic association with human longevity in cohort studies. By monitoring the changes in the observed genotype frequencies over the follow-up period in a birth cohort, we are able to assess the effects of the genotypes and/or haplotypes on individual survival. With the estimated parameters, genotype- and/or haplotype-specific survival and hazard functions can be calculated without any parametric assumption on the survival distribution. In addition, our model estimates haplotype frequencies in a birth cohort over the follow-up time, which is not observable in the multilocus genotype data. A computer simulation study was conducted to specifically assess the performance and power of our haplotype-based approach for given risk and frequency parameters under different sample sizes. Application of our method to paraoxonase 1 genotype data detected a haplotype that significantly reduces carriers’ hazard of death and thus reveals and stresses the important role of genetic variation in maintaining human survival at advanced ages.
T
HE current genetic association studies on human aging and longevity are dominated by the case– control (cases represent long lived and controls the younger aged) or cross-sectional design. In these studies, subjects of different ages are genotyped, and frequencies of a particular gene variant are compared across the ob-served ages to infer genetic association (DeBenedictiset al. 2001). In terms of analytical methods, new statis-tical approaches have been proposed to help analyze genotype data collected in cross-sectional studies with improved power (Tanet al. 2004). Lewisand Brunner
(2004) explored the validity of the basic assumptions in the cross-sectional approach,i.e., no secular change in both risk and initial frequency of the gene under study. Their study concluded that the assumptions are ques-tionable when gene frequency differs in populations and gene–environment interactions exist and suggested conducting long-term follow-up studies to ensure veri-fiable results. Although the cohort study design is expensive due to the long time of follow up, it is
prac-tically affordable to carry out follow-up studies on aged subjects given the high mortality rate at advanced ages. In this case, the study aims at investigating the genetic effect on human survival at extreme ages, an important topic nowadays because of the largely increased mean life span in the developed countries (Vaupel et al.
1998). In the literature, association studies using follow-up design on oldest-old subjects such as nonagenarians (Christiansenet al. 2004; Hurmeet al. 2005) and
cen-tenarians (Blancheet al. 2001; Louhijaet al. 2001) have
already been conducted. With the collected genotype and survival information, traditional statistical methods have been employed for single-locus analysis, for ex-ample, frequency comparison using a simplex2-(trend)
test or estimating genotype relative risk using the tra-ditional Cox regression model.
In the context of human disease gene mapping, multilocus approaches such as the haplotype-based asso-ciation analysis have been introduced (Schaidet al. 2002;
Zhaoet al. 2003). Haplotype-based analysis exhibits more
power due to its functional and statistical advantages over the single-locus approach in linkage disequilibrium mapping (Akeyet al. 2001; Clark2004; Schaid2004).
Unfortunately, haplotype analysis in population-based
1Corresponding author:Department of Clinical Biochemistry and
Genet-ics (KKA), Odense University Hospital, Sdr. Blvd. 29, DK-5000 Odense C, Denmark. E-mail: [email protected]
human longevity studies encounters the problem of missing phases in the long-lived subjects because geno-type information is unavailable from their parents. We present a novel survival analysis model that combines population survival with individual genotype and phe-notype information in assessing the genetic association with human longevity in cohort studies. By monitoring the changes in the observed genotype frequencies over the follow-up period in a birth cohort, we are able to assess the effects of the genotypes and/or haplotypes on individual survival. With the estimated parameters, genotype- and/or haplotype-specific survival and haz-ard functions can be calculated without any parametric assumption on the survival distribution. In addition, our model estimates haplotype frequencies in a birth cohort over the follow-up time, which is not observable in the multilocus genotype data. A computer simulation study was conducted to evaluate the performance of our model. For given haplotype risk and frequency param-eters, we assess the power of our model under different sample sizes and years of follow up. The model is applied to measure the association of paraoxonase 1 (PON1) gene polymorphism with human survival at advanced ages in the Danish 1905 birth cohort followed from 1998 to 2005. Application of our model helped us to detect a haplotype of aPON1gene that significantly reduces the carrier’s hazard of death over the follow up.
METHODS
The basic model for genotype-based analysis: We suppose that we start our follow-up study in a birth cohort of old subjects from initial agex0. For each individual,
we obtain genotype information at a biallelic locus (e.g., a SNP locus) for assessing its influence on conditional survival after agex0. Combination of the two alleles (1
and 2) forms three genotypes (11, 12, and 22). If the frequencies of carriers of the three genotypes arep11,
p12, and p22 at intake (age x0), then the conditional
survival (conditional on the fact that each individual has survived to agex0) of the birth cohort can be expressed
as the mean of the survivals for carriers of the three genotypes;i.e.,
sðxÞ ¼p11s11ðxÞ1p12s12ðxÞ1p22s22ðxÞ; ð1Þ
where s11ðxÞ, s12ðxÞ, and s22ðxÞ are genotype-specific
conditional survival functions for carriers of the corre-sponding genotypes. Age x ranges from x0 to x01t,
where t is the follow-up time in years. From (1), it is straightforward to calculate the proportion of genotype carriers in the birth cohort at agexduring the follow up,
p11ðxÞ ¼p11s11ðxÞ=sðxÞ
p12ðxÞ ¼p12s12ðxÞ=sðxÞ
p22ðxÞ ¼p22s22ðxÞ=sðxÞ: ð2Þ
If we assign the 22 genotype as a reference and assume that, after agex0, the genotypes 11 and 12 affect survival
with the relative risks (i.e., the relative rate of death among those carrying a specific genotype over that of the reference genotype)r11andr12, respectively, then in
a proportional hazard model we have the hazard of death at agexfor carriers of the three genotypes as
m11ðxÞ ¼r11m0ðxÞ
m12ðxÞ ¼r12m0ðxÞ
m22ðxÞ ¼m0ðxÞ: ð3Þ
Here,m0ðxÞis the hazard of death for the 22 genotype or the baseline hazard function. With (3), we obtain the survival functions for carriers of the three genotypes as
s11ðxÞ ¼e
Б
x0 m11ðtÞdt
¼er11
Б
x0 m0ðtÞdt
¼er11H0ðxÞ¼s0ðxÞr11
s12ðxÞ ¼s0ðxÞr12
s22ðxÞ ¼s0ðxÞ: ð4Þ
To take into account the effects of unobserved risk factors (both genetic and nongenetic), the frailty model (Vaupelet al. 1979) can be introduced. Assuming that
the unobserved frailty is gamma distributed with mean 1 and variances2, we obtain the genotype-specific
surviv-als (seeappendix):
s11ðxÞ ¼ ½11s2r11H0ðxÞð1=s
2Þ
s12ðxÞ ¼ ½11s2r12H0ðxÞð1=s
2Þ
s22ðxÞ ¼ ½11s2H0ðxÞð1=s
2Þ
: ð5Þ
By introducing (4) or (5) into (2), we can estimate the parameters using the optimization method, which minimizes the differences between the observed and the estimated genotype frequencies over the follow-up ages (fromx0tox01t),
D¼X
x01t
x¼x0
½obspðxÞ pðxÞ2; ð6Þ
whereobspðxÞandp(x) are vectors of the observed and
the fitted frequencies of all the genotypes at agex. In the estimation, a parametric form of the baseline hazard function can be assigned. However, by introduc-ing the mean cohort survival available from population statistics into (1), a nonparametric baseline hazard func-tion can be estimated. This is done using a two-step pro-cedure (Yashinet al. 1999; Tanet al. 2001) in which we
(Tanet al. 2001). To obtain the statistical significance for
the risk parameters, we shuffle the ages at last observa-tion for all the subjects to conduct the permutaobserva-tion tests.
The extended model for haplotype-based analysis:
When genotypes at closely linked loci are available, haplotype-based analysis can be performed. Different from genotypes that are observable for each individual, individual haplotypes cannot be determined explicitly without knowing phases. We start with assuming that all the haplotypes occurring at the typed loci are unambig-uously observed and denote the collection of them with
H. Under Hardy–Weinberg equilibrium (HWE), the fre-quency of the haplotype pairðhi;hjÞcan be calculated as
Pðhi;hjÞ ¼
2pipj i,j
pipj i¼j;
ð7Þ
wherepiandpjare the haplotype frequencies at initial agex0 for haplotypeshiandhj. We further assume that the relative risk on hazard of death for carriers of hap-lotypehi isr. For carriers of haplotypehi, the hazard of death at follow-up agex ismi;jðxÞ ¼rmoðxÞin a pro-portional hazard model. Similar to the situation of genotype-based analysis, both homogeneity (no unob-served risk factor) and heterogeneity or frailty models can be fitted. In any case, the mean conditional survival of the birth cohort is the weighted survival for carriers of the different haplotype pairs;i.e.,
sðxÞ ¼ X
i;j2H
Pðhi;hjÞsi;jðxÞ
¼2 X
i,j;i;j2H
pipjsi;jðxÞ1 X
i¼j;i;j2H
pipjsi;jðxÞ: ð8Þ
Likewise, at agex, the frequency of carriers of haplotype pairðhi;hjÞin the birth cohort is
pi;jðxÞ ¼Pðhi;hjÞsi;jðxÞ=sðxÞ: ð9Þ
Up to now, the haplotype-based parameterization is made by assuming that haplotypes are known explicitly for each individual. In practice, what we observe are unphased multilocus genotypes instead of haplotypes. However, for each multilocus genotypeg, we have a set of haplotype pairs denoted asSðgÞthat are consistent withg. With this relationship, we can express the fre-quency of the multilocus genotypegat follow-up agex
in the birth cohort as
pgðxÞ ¼ P
i;j2SðgÞPðhi;hjÞsi;jðxÞ
sðxÞ : ð10Þ
On the basis of the multinomial distribution of the multilocus genotype frequencies in the birth cohort, we construct the likelihood function for estimating the initial haplotype frequencies,
logLdata}
X
g2G
nglogpg; ð11Þ
where ng is the number of carriers of the multilocus genotypegin the birth cohort andpgis its frequency at the beginning of the follow-up. Instead of (11), one can also estimate the haplotype frequencies using existing software such as GENECOUNTING (Zhaoet al. 2002).
With the initial haplotype frequencies, we further esti-mate the risk of haplotypes using the two-step procedure similar to the genotype-based analysis. Once the param-eters are estimated, we are able to calculate the frequency trajectory for haplotypehiover the follow-up ages as
piðxÞ ¼
pi2si;iðxÞ10:5Pi,jpipjsi;jðxÞ
sðxÞ : ð12Þ
All computer codes written in the GAUSS program-ming language are freely available upon contacting the corresponding author.
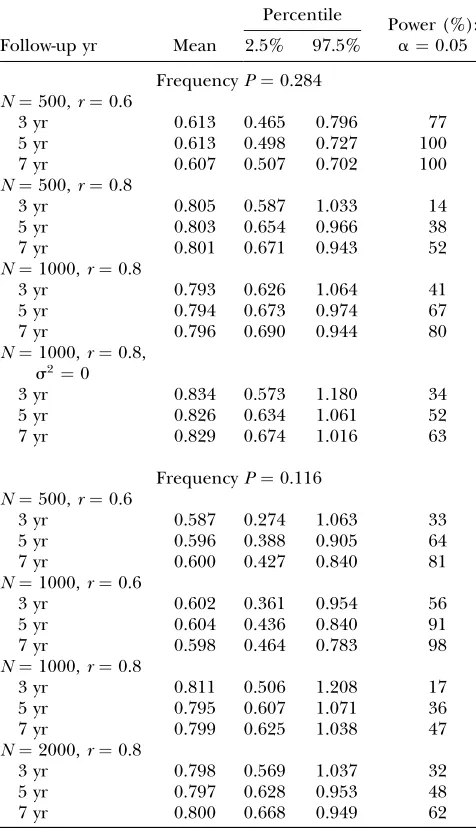
SIMULATION STUDY
To examine the validity of our model, we conducted a computer simulation study specifically on our haplotype-based analysis. In the simulation, we assign different haplotype relative risks (a modest risk of 0.8 and a strong risk of 0.6 based on our previous experience on fitting relative risk models to genotype data) for a three-locus haplotype. Also we assign different sample sizes (500 and 1000) for the birth cohort, starting from the initial follow-up age of 93. Power of our model is assessed for samples collected from 3, 5, and 7 years of follow up. For each setting, we calculate the power as the proba-bility that the 95% confidence limit of the estimated haplotype relative risk falls below 1. The mean cohort survival function is obtained from the female life table of the Danish 1905 cohort (http://www.mortality.org). The initial haplotype frequencies to use in the simulation are taken from the estimated haplotype frequencies in an empirical multilocus genotype data set spanning three SNP loci. Model performance is assessed on hap-lotypes with frequencies of 0.284 and 0.116. The simu-lation also takes into account individual heterogeneity in the unobserved frailty that contributes to individual survival by introducing a gamma-distributed frailty with mean 1 and variance 0.1. To assess the power, we first simulate the null distribution for the estimated null risk, which is set to 1 in generating the data for given haplo-type frequency and sample size. The critical value for
a¼0.05 in the null distribution is used in calculating the power.
results for a relatively frequent haplotype (frequency of 0.284). For a strong relative risk ofr¼0.6, the model can have acceptable power in capturing the parameter even within a follow-up period of,5 years using a small birth cohort (N¼500). However, for the same sample size, the model is unable to detect a low risk haplotype (r¼
0.8). A large birth cohort (N ¼ 1000) is required to obtain an acceptable power (80%) after 7 years follow-up. For a haplotype with a lower frequency of 0.116, the model still exhibits acceptable power in a small birth cohort (N ¼ 500) after 7 years follow-up. When the sample size is doubled, the power can be as high as 91% after 5 years follow-up. To detect a low frequency and low risk haplotype (r ¼0.8), a long term of follow-up (.7 years) and a large sample of.2000 is required.
In Table 1, we also report the simulation result on a haplotype with a frequency of 0.284 and a risk of 0.8 but
ignoring the effect of hidden frailty (s2¼0). During
all the follow-up years, the effect of the haplotype is obviously underestimated, meaning conservative results. At the same time, the power is largely reduced.
Finally, a large birth cohort of 10,000 individuals (over 93 years) was simulated. This time we assume that there is a harmful haplotype that increases the carrier’s hazard of death with a relative risk of 1.5 and frequency of the haplotype at the initial age is chosen as 0.284. In Figure 1, we show the theoretical, the simulated, and the estimated frequency trajectories for the haplotype after 7 years follow up. Both the theoretical (solid line) and the sim-ulated (dashed line) frequency patterns are well cap-tured by our model (the dashed-dotted line). Note also that all three lines start from the initial frequency we set in the simulation.
EXAMPLE APPLICATION
Previous studies have shown that the antioxidant enzymePON1is associated with susceptibility to cardio-vascular disorders (Watsonet al. 1995; Heineckeand
Lusis1998). Recently,PON1gene polymorphisms have
been found to affect human survival (Bonafeet al. 2002;
Christiansenet al. 2004). In the study by Christiansen
et al. (2004), three SNPs in thePON1gene (two in the coding region, amino acids M55L and Q192R, and one in the promoter region, C-107T) were genotyped. Data analysis using the Cox regression model revealed a strong protective effect of the 55M/L genotype and an increased risk of death for carriers of the 192R/R genotype in females (a relative risk of 1.38). In their study, haplotype analysis was not possible because such
TABLE 1
Risk estimates and power in the simulation study
Follow-up yr Mean
Percentile
Power (%): 2.5% 97.5% a¼0.05
FrequencyP¼0.284 N¼500,r¼0.6
3 yr 0.613 0.465 0.796 77
5 yr 0.613 0.498 0.727 100
7 yr 0.607 0.507 0.702 100
N¼500,r¼0.8
3 yr 0.805 0.587 1.033 14
5 yr 0.803 0.654 0.966 38
7 yr 0.801 0.671 0.943 52
N¼1000,r¼0.8
3 yr 0.793 0.626 1.064 41
5 yr 0.794 0.673 0.974 67
7 yr 0.796 0.690 0.944 80
N¼1000,r¼0.8, s2¼0
3 yr 0.834 0.573 1.180 34
5 yr 0.826 0.634 1.061 52
7 yr 0.829 0.674 1.016 63
FrequencyP¼0.116 N¼500,r¼0.6
3 yr 0.587 0.274 1.063 33
5 yr 0.596 0.388 0.905 64
7 yr 0.600 0.427 0.840 81
N¼1000,r¼0.6
3 yr 0.602 0.361 0.954 56
5 yr 0.604 0.436 0.840 91
7 yr 0.598 0.464 0.783 98
N¼1000,r¼0.8
3 yr 0.811 0.506 1.208 17
5 yr 0.795 0.607 1.071 36
7 yr 0.799 0.625 1.038 47
N¼2000,r¼0.8
3 yr 0.798 0.569 1.037 32
5 yr 0.797 0.628 0.953 48
7 yr 0.800 0.668 0.949 62
Figure1.—The theoretical (solid line), simulated (dashed
an analysis is not supported by the traditional Cox regression model. In this example application, we apply our model to a subsample in their study, the female 1905 cohort data, and perform both genotype- and haplotype-based analyses. Since the start of the follow up at the initial age of 93 years, survival information has been collected for a period of 6 years. The cohort survival function is taken from the female life table of the Danish 1905 cohort (http://www.mortality.org). Similar to the simulation study, we introduce a gamma-distributed frailty model (mean 1, variance 0.1) in our analysis to take into account the influence on survival from the unobserved factors.
In Table 2, we show the genotype counts and number of typed individuals at the three loci. Chi-square tests on each locus showed that all three loci are in Hardy– Weinberg equilibrium (x2
ð1Þ¼0.005,P¼0.944 atPON1
C-107T;x2
ð1Þ¼0.100,P¼0.752 atPON1M55L; andx
2
ð1Þ¼
3.190, P ¼ 0.074 at PON1 Q192R). We present our results on genotype-based analysis in Table 2, where, as described inmethods, risk and frequency parameters
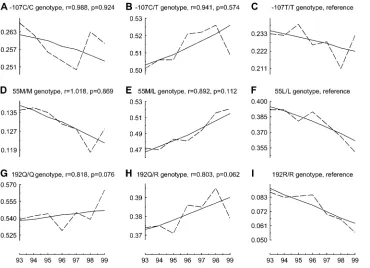
are estimated for each genotype against the reference. Although only a subsample was used, our model de-tected PON1 192 Q/Q and Q/R genotypes as of po-tential influence (P ¼ 0.062 for Q/R and P ¼0.076 for Q/Q genotypes), a result consistent with that of Christiansen et al. (2004). In Figure 2, we show the
observed and the estimated genotype frequency pat-terns for all genotypes at the three loci.
On the basis of genotype information from the three loci, we carried out a haplotype-based analysis using our extended model. By taking individuals with genotype
information available at all three loci, we obtained a sample size of 451 for haplotype analysis. We first tested the linkage disequilibrium between the markers using GENECOUNTING software (Zhao et al. 2002). Very
strong marker–marker disequilibrium was found be-tween markers C-107T and M55L (x2
ð1Þ¼225.36,P¼0),
M55L and Q192R (x2
ð1Þ¼ 240.29,P ¼0), and C-107T
and Q192R (x2
ð1Þ¼17.54, P¼0). In Table 3, we show
the estimated initial frequency and the relative risk for
TABLE 2
Results from genotype-based analysis on the single-locus data of the 1905 cohort
Locus and genotype
No. of observed
Estimated initial frequency
Relative
risk P-value
PON1C-107T
C/C 120 0.262 0.988 0.924
C/T 226 0.503 0.941 0.574
T/T 105 0.235 1 —
Total 451
PON1M55L
M/M 117 0.138 1.018 0.869
M/L 407 0.467 0.892 0.112
L/L 338 0.395 1 —
Total 862
PON1Q192R
Q/Q 470 0.538 0.818 0.076
Q/R 326 0.373 0.803 0.062
R/R 76 0.090 1 —
Total 872
Figure 2.—The observed
each haplotype by assigning the rest as reference. Our results show that haplotype T-L-Q exhibits a significantly (P¼0.043) beneficial effect that reduces the carrier’s hazard of death with a relative risk of 0.688 and an initial frequency of 0.090. In Figure 3, we show the estimated haplotype frequencies for haplotypes T-L-Q and T-L-R calculated using (12). The increasing frequency of the T-L-Q haplotype in survivors of the 1905 birth cohort illustrates the beneficial effect of the haplotype, which is in contrast to the frequency of the T-L-R haplotype. In addition, on the basis of the parameter estimates, we calculated the conditional survival functions for carriers and noncarriers of the T-L-Q haplotype as presented in Figure 4. A comparison of the survival curves shows that, on average, carriers of the T-L-Q haplotype may live1 year longer than noncarriers of the haplotype (Figure 4).
DISCUSSION
Recent association studies are increasingly emphasiz-ing the important roles that genes may play in affectemphasiz-ing human survival at advanced ages (Bonafe et al. 2002;
Christiansenet al. 2004; Bellizzi et al. 2005; Hurme
et al. 2005). Further studies using efficient analytical tools are needed. Through computer simulation and model application, we have shown that our survival analysis model is a valid method for both genotype- and haplotype-based association analyses of human survival in cohort studies of elderly subjects. Our computer simu-lation approach not only validates our model but also provides important information useful in planning future research. In addition, empirical application of the model to ourPON1genotype data has helped us to identify an important haplotype that favors human longevity and indicates an increased power of the haplotype model.
Although our model can support the parametric form of the baseline hazard function, it is important to point out that, by incorporating the cohort-specific survival function available from population statistics, our model conducts parameter estimation without imposing any parametric form of the hazard function. This means that our model provides a nonparametric approach in ana-lyzing survival data at advanced ages. This is important because, at extreme ages, validity of the parametric sur-vival functions, such as the Gompertz or the Gompertz– Makeham models, has been seriously questioned (Driver
2001). In addition, when the sample size is limited at advanced ages, there will be a considerable error in estimating the survival distribution, which consequently leads to unreliable results. Since our model models the genotype or haplotype frequency patterns in the sur-vivors over the follow-up period, with the estimated parameters, the fitted frequency trajectory over the observed period can be examined (Figures 2 and 3)
TABLE 3
Results from haplotype-based analysis on the three-locus data of the 1905 cohort
Haplotypea Estimated frequency
Relative risk of carriers
Risk P-value
C-M-Q 0.073 1.011 0.919
C-L-Q 0.257 0.883 0.159
C-L-R 0.171 1.083 0.442
T-M-Q 0.277 0.942 0.487
T-L-Q 0.090 0.688 0.043
T-L-R 0.093 0.950 0.674
Total 0.961
aEstimation of T-M-R and C-M-R haplotypes was not
possi-ble due to too low frequencies.
Figure 3.—The estimated frequencies for the T-L-Q and
T-L-R haplotypes of thePON1 gene in survivors during the follow-up period from ages 93 to 99. The steadily increasing frequency of haplotype T-L-Q indicates its beneficial effect on the carrier’s survival but that for haplotype T-L-R remains nearly unchanged.
Figure4.—The estimated conditional survivals for carriers
for each genotype or haplotype. This is especially useful in haplotype-based analysis because, unlike in the single-locus analysis, we do not actually observe the individual haplotype in population studies. Moreover, since the pa-rameters are estimated by monitoring the genotype or haplotype frequencies in the survivors over the follow-up period in a birth cohort, exact individual life span is not necessarily required to apply the model. This means that censoring is not a problem at all in our analysis. Finally, although the method is introduced using SNP markers, extending it to multiallelic loci involves only more genotypes or haplotypes in the analysis.
Here, we emphasize the importance of the frailty model-ing in our analysis. It is well known that, at advanced ages, the cause-specific mortality curves start to converge as a result of heterogeneity in an individual’s frailty composition (Vaupelet al. 1998). As a result, ignoring the
existence of the competing risk factors can substantially underestimate the risks of genotypes or haplotypes. Frailty modeling in our genotype- and haplotype-based analyses can help us to assess the risk parameters in a more realistic manner. Most importantly, since haplo-type analysis is biologically as well as statistically advan-tageous over the single-locus approach, our haplotype model with frailty modeling provides a powerful method in data analysis. In addition, we point out that the ap-plicability of our model is theoretically not limited to longevity studies. Application of our model to any time to event data, for example, the age of onset of a disease, is feasible provided that the population prob-ability distribution of the time to onset of the disease is available.
On the basis of the mixed results from conducted follow-up studies on apolipoprotein E gene and longev-ity, Lewisand Brunner(2004) suggested that adequate
cohort studies with longer follow up (.5 years) be conducted to obtain reliable results. It is interesting to see from Table 1 that their conclusion seems to comply with our simulation. Since the cohort design avoids the validity issues concerning a cross-sectional design (sec-ular change in the risk and initial frequency of the observed gene), our simulation result is promising be-cause, with a proper analytical approach, the effect of a gene on human extreme age survival can be detected within an affordable period of follow-up time.
This work was jointly supported by the U.S. National Institute on Aging (NIA) research grant NIA-P01-AG08761 and the Danish Medical Research Council.
LITERATURE CITED
Aalen, O., 1998 Heterogeneity in survival analysis. Stat. Med.7:
1121–1137.
Akey, J., L. Jinand M. Xiong, 2001 Haplotypes vs single marker
linkage disequilibrium tests: What do we gain? Eur. J. Hum. Genet.9:291–300.
Bellizzi, D., G. Rose, P. Cavalcante, G. Covello, S. Datoet al.,
2005 A novel VNTR enhancer within the SIRT3 gene, a human
homologue of SIR2, is associated with survival at oldest ages. Genomics85:258–263.
Blanche, H., L. Cabanne, M. Sahbatouand G. Thomas, 2001 A
study of French centenarians: are ACE and APOE associated with longevity? Crit. Rev. Acad. Sci. III.324:129–135.
Bonafe, M., F. Marchegiani, M. Cardelli, F. Olivieri, L. Cavallone et al., 2002 Genetic analysis of Paraoxonase (PON1) locus reveals an increased frequency of Arg192 allele in centenarians. Eur. J. Hum. Genet.10:292–296.
Christiansen, L., L. Bathum, H. Frederiksenand K. Christensen,
2004 Paraoxonase 1 polymorphisms and survival. Eur. J. Hum. Genet.12:843–847.
DeBenedictis, G., Q. Tan, B. Jeune, K. Christensen, S. V. Ukraintseva et al., 2001 Recent advances in human gene-longevity associa-tion studies. Mech. Ageing Dev.122:909–920.
Driver, C., 2001 The Gompertz function does not measure ageing.
Biogerontology2:61–65.
Ewbank, D. C., 2002 Mortality differences by APOE genotype estimated
from demographic synthesis. Genet. Epidemiol.22:146–155. Heinecke, J. W., and A. J. Lusis, 1998 Paraoxonase-gene
poly-morphisms associated with coronary heart disease: Support for the oxidative damage hypothesis? Am. J. Hum. Genet.62:
20–24.
Hougaard, P., 1991 Modeling heterogeneity in survival analysis.
J. Appl. Prob.28:695–701.
Hurme, M., T. Lehtimaki, M. Jylha, P. J. Karhunenand A. Hervonen,
2005 Interleukin-6 -174G/C polymorphism and longevity: a follow-up study. Mech. Ageing Dev.126:417–418.
Clark, A. G., 2004 The role of haplotypes in candidate gene studies.
Genet. Epidemiol.27:321–333.
Lewis, S. J., and E. J. Brunner, 2004 Methodological problems in
genetic association studies of longevity—the apolipoprotein E gene as an example. Int. J. Epidemiol.33:962–970.
Louhija, J., M. Viitanen, H. Aguero-Torres and R. Tilvis,
2001 Survival in Finnish centenarians in relation to apolipopro-tein E polymorphism. J. Am. Geriatr. Soc.49:1007–1008. Schaid, D. J., 2004 Evaluating associations of haplotypes with traits.
Genet. Epidemiol.27:348–364.
Schaid, D. J., C. M. Rowland, D. E. Tines, R. M. Jacobsonand G. A.
Poland, 2002 Score tests for association between traits and
hap-lotypes when linkage phase is ambiguous. Am. J. Hum. Genet.70:
425–434.
Tan, Q., G. DeBenedictis, A. I. Yashin, M. Bonafe, M. DeLucaet al.,
2001 Measuring the genetic influence in modulating human lifespan: gene-environment and gene-sex interactions. Biogeron-tology2:141–153.
Tan, Q., A. I. Yashin, K. Christensen, B. Jeune, G. DeBenedictis et al., 2004 Multidisciplinary approaches in genetic studies on human aging and longevity. Curr. Genomics5:409–416. Vaupel, J. W., K. G. Mantonand E. Stallard, 1979 The impact of
heterogeneity in individual frailty on the dynamics of mortality. Demography16:439–454.
Vaupel, J. W., J. R. Carey, K. Christensen, T. E. Johnson, A. I.
Yashinet al., 1998 Biodemographic trajectories of longevity.
Science280:855–860.
Watson, A. D., J. A. Berliner, S. Y. Hama, B. N. LaDu, K. F. Faull et al., 1995 Protective effect of high density lipoprotein as-sociated paraoxonase. Inhibition of the biological activity of minimally oxidized low density lipoprotein. J. Clin. Invest.96:
2882–2891.
Yashin, A. I., G. DeBenedictis, J. W. Vaupel, Q. Tan, K. F. Andreev et al., 1999 Genes, demography, and lifespan: the contribution of demographic data in genetic studies on ageing and longevity. Am. J. Hum. Genet.65:1178–1193.
Yashin, A. I., G. DeBenedictis, J. W. Vaupel, Q. Tan, K. F. Andreev et al., 2000 Genes and longevity: lessons from studies on cente-narians. J. Gerontol.55A:B1–B10.
Zhao, H., R. Pfeifferand M. H. Gail, 2003 Haplotype analysis in
population genetics and association studies. Pharmacogenomics
4:171–178.
Zhao, J. H., S. Lissarrague, L. Essioux and P. C. Sham,
2002 GENECOUNTING: haplotype analysis with missing geno-types. Bioinformatics18:1694–1695.
APPENDIX
Under the proportional hazard assumption, if an individual carrying the risky genotype has frailtyz, the hazard of death at age x is mðxjzÞ ¼zmðxÞ ¼zrmoðxÞ. The mean hazard of death for a heterogeneous pop-ulation carrying the genotype is
mðxÞ ¼
ð‘
0
mðxjzÞfxðzÞdz¼mðxÞ ð‘
0
zfxðzÞdz¼mðxÞzðxÞ:
ðA1Þ
Following the traditional approach (Vaupelet al. 1979;
Hougaard 1991; Aalen 1998), we assume that the
frailtyzis gamma distributed with mean 1 and variance
s2. Then zðxÞ in (A1) can be derived as zðxÞ ¼ ½11 s2Ðx
0 mi;jðsÞds
1
¼ ½11s2H
i;jðxÞ
1
. Substituted into (A1), we get
mðxÞ ¼ mðxÞ
11s2HðxÞ¼
rmoðxÞ
11s2rHoðxÞ
; ðA2Þ
whereHoðxÞis the cumulative baseline hazard function.
Correspondingly, we have the mean survival for the genotype carriers,
sðxÞ ¼ ½11s2rH
oðxÞð1=s
2Þ
: ðA3Þ
Estimating the variance parameters2 requires a large
sample size (Ewbank 2002). In small-scale
investiga-tions,s2can be determined by a grid search for the peak
of the likelihood for tentatively assigned values of s2
(Yashinet al. 2000; Tanet al. 2001). On the basis of our
experiences in fitting the gamma-frailty model to large population data sets, one can alternatively fit a frailty model by simply settings2 to 0.1. This can be
conser-vative compared with some empirical results (Yashin
et al. 2000; Tanet al. 2001; Ewbank2002). However, we