DOI: 10.1534/genetics.105.043901
The Role of Selection in the Evolution of Human Mitochondrial Genomes
Toomas Kivisild,*
,1,2Peidong Shen,
†,2Dennis P. Wall,
‡,3Bao Do,
†Raphael Sung,
†Karen Davis,
†Giuseppe Passarino,
§Peter A. Underhill,* Curt Scharfe,
†Antonio Torroni,**
Rosaria Scozzari,
††David Modiano,
‡‡Alfredo Coppa,
§§Peter de Knijff,***
Marcus Feldman,
‡Luca L. Cavalli-Sforza* and Peter J. Oefner
†,2,4*Department of Genetics, Stanford University School of Medicine, Stanford, California 94305,†Stanford Genome Technology Center, Palo Alto,
California 94304,‡Department of Biological Sciences, Stanford University, Stanford, California 94305,§Dipartimento di Biologia Cellulare,
Universita` della Calabria, 87036 Rende, Italy,**Dipartimento di Genetica e Microbiologia, Universita` di Pavia, 27100 Pavia, Italy,
††Dipartimento di Genetica e Biologia Molecolare, Universita` ‘‘La Sapienza,’’ 00185 Rome, Italy,‡‡Dipartimento di Scienze di
Sanita` Pubblica, Sezione di Parassitologia, Universita` ‘‘La Sapienza,’’ 00185 Rome, Italy,§§Dipartimento di Biologia
Animale e dell’Uomo, Universita` ‘‘La Sapienza,’’ 00185 Rome, Italy and***Department of Human and
Clinical Genetics, Leiden University Medical Center, 2333 AL Leiden, The Netherlands Manuscript received March 30, 2005
Accepted for publication September 5, 2005
ABSTRACT
High mutation rate in mammalian mitochondrial DNA generates a highly divergent pool of alleles even within species that have dispersed and expanded in size recently. Phylogenetic analysis of 277 human mitochondrial genomes revealed a significant (P,0.01) excess of rRNA and nonsynonymous base sub-stitutions among hotspots of recurrent mutation. Most hotspots involved transitions from guanine to adenine that, with thymine-to-cytosine transitions, illustrate the asymmetric bias in codon usage at synonymous sites on the heavy-strand DNA. The mitochondrion-encoded tRNAThr varied significantly more than any other tRNA gene. Threonine and valine codons were involved in 259 of the 414 amino acid replacements observed. The ratio of nonsynonymous changes from and to threonine and valine differed significantly (P¼ 0.003) between populations with neutral (22/58) and populations with significantly negative Tajima’s Dvalues (70/76), independent of their geographic location. In contrast to a recent suggestion that the excess of nonsilent mutations is characteristic of Arctic populations, implying their role in cold adaptation, we demonstrate that the surplus of nonsynonymous mutations is a general feature of the young branches of the phylogenetic tree, affecting also those that are found only in Africa. We introduce a new calibration method of the mutation rate of synonymous transitions to estimate the coalescent times of mtDNA haplogroups.
M
ITOCHONDRIAL DNA (mtDNA) encodes for 13 proteins, two ribosomal genes, and 22 tRNAs that are essential in the energy production of the human cell. Variation in the sequence of mtDNA has provided significant insights into the maternal history of anatomically modern humans (Giles et al. 1980;Denaroet al.1981), complementing the paternal legacy
of the Y chromosome (Underhillet al.2000). Studies based on restriction fragment length polymorphism (RFLP) of the coding and direct sequencing of the noncoding control region have formed the basis of a
hierarchical classification of distinct geographic and ethnic affinities (Torroniet al.1993, 1996; Chenet al. 1995; Watson et al. 1997; Macaulay et al. 1999;
Forster et al. 2001). Studies addressing sequence
variation in the mtDNA coding region have suggested that natural selection has significantly shaped the course of human mtDNA evolution (Cannet al.1984;
Nachmanet al. 1996; Ingmanand Gyllensten2001;
Mishmaret al.2003; Moilanenet al.2003; Moilanen
and Majamaa2003; Elsonet al.2004; Ruiz-Pesiniet al. 2004). These studies have disagreed, however, upon whether the distribution of specific human mtDNA clades or haplogroups is due to an adaptation to dif-ferent climates or if their distribution is a function of random genetic drift assisted by purifying selection that eliminates nonsynonymous changes. In an attempt to clarify this disagreement and to study the mode of natural selection in mtDNA variation in human popu-lations, we provide here a phylogenetic analysis of a global sample of mtDNAs and investigate the position, chemical nature, and geographic distribution of re-current and frequent mutations in the coding region. Complete coding region sequence information for 277 individual
samples have been submitted to GenBank under accession nos. DQ112686–DQ112962.
1Corresponding author: Department of Evolutionary Biology, Tartu University and Estonian Biocenter, Riia 23, Tartu 51010, Estonia. E-mail: [email protected]
2These authors contributed equally to this work.
3Present address: Department of Systems Biology, Harvard Medical School, Boston, MA 02115.
4Present address: Institute of Functional Genomics, University of Regensburg, Josef-Engert-Strasse 9, 93053 Regensburg, Germany.
MATERIALS AND METHODS
DNA samples:The ascertainment set comprised 277
indi-viduals from the five continents, including genomic DNA samples from 129 Africans (10 Biaka Pygmy, 15 Mbuti Pygmy, two Lisongo, six San, two Mandenka, four Ethiopian Jews, nine Sudanese, one Eritrean, one Ghanan, three Herero, one Ovambo, one Pedi, one Sotho, two Tswana, two Zulu, 10 Fulbe, 10 Mossi, 10 Rimaibe, one Berta, one Tuareg, 37 Dominicans), 43 Asians (one Arab, one Kazak, one Druze, four Bedouin, one Sephara-dim, one Yemenite Jew, two Pathan, five Sindhi, two Burushaski, one Baluchi, one Brahui, two Makran, two Hazara, one Tamil, two Cambodians, one Hmong, one Atayal, one Ami, four Han Chinese, five Japanese, four Koreans), 76 Europeans (five Northern Europeans, 12 Italians, one Greek, two Finns, two Ashkenazi, one Georgian, 17 Hungarians, three Icelanders, three Czechs, one Sardinian, five Basque, one Iberian, 23 Dutch), 13 Oceanians (four New Guineans, three Melane-sians, six Australian Aborigines), and 16 Native Americans (one Auca, one Guarani, five Brazilian Indians, three Colom-bian Indians, two Mayan, one Piman, one Muskogee, one Navaho, one Quechua) (supplemental Table 1 at http://www.genetics. org/supplemental/). A subset of 103 sequences from these populations has been reported elsewhere (Shenet al.2005). DNA was extracted using the QIAamp DNA blood kit (QIAGEN, Valencia, CA). Immortalized cell lines have been established for all individuals with the exception of the 17 Hungarians, the 23 Dutch, the 37 Dominicans, the 10 Mossi, the 10 Rimaibe, and the 10 Fulbe.
PCR and DNA sequencing:The 41 primer pairs used for
bidirectional sequencing of mtDNA nucleotides 435–16,023, the PCR conditions, and the determined complete coding region sequence information for 277 individual samples are available at http://insertion.stanford.edu/primers_mitogenome. html. Amplicons were purified with QIAGEN QIAquick spin columns and sequenced with the Applied Biosystems (Foster City, CA) Dye Terminator Cycle sequencing kit and a model 3700 DNA sequencer.
Phylogenetic and statistical analyses:An unrooted tree from
a median-joining network (Bandeltet al.1999) was drawn and labeled following existing mtDNA haplogroup nomenclature
(Torroniet al.1996, 2001; Macaulay et al.1999; Kivisild
et al.2002, 2004; Salaset al.2002; Yaoet al.2002; Konget al.
2003, 2004; Shenet al.2005). The tree was rooted using nu-clear inserts of mtDNA retrieved from human genomic sequence and the consensus sequence of the three chimpanzee mito-chondrial genomes. The accession numbers, mtDNA posi-tional range, and identity (ID) measures of the genomic contigs containing the inserts that were used for rooting are as follows: NT_006713.14 (bp 341–2697; ID 94%); NT_009237.17 (bp 521–2976; ID 94%); NT_006316.15 (bp 2899–3050; ID 94%); NT_077913.3 (bp 3914–9756; ID 98%); and NT_034772.5 (bp 10,269–15,487; ID 94%). The assembled sequence of the in-serts is available at http://insertion.stanford.edu/mtDNA.html. The GenBank accession numbers of the twoPan troglodytes and onePan paniscussequences that were used are D38113, X93335, and D38116, respectively. Haplogroup divergence es-timatesrand their error ranges were calculated as averages of the distances from the tips to the most recent common ances-tor of the haplogroup (Forster et al.1996; Saillardet al. 2000). Two separate measures of nonsynonymous (N) to syn-onymous (S) substitution ratios were used: first, theMN/MS ratio estimates the number of mutational changes inferred from the phylogenetic tree (Figure 1), and second, thedN/ (dS1constant) refers as in Mishmaret al.(2003) to the ratio of the average pairwise distances of N and S changes in the given sample. Statistical significance was determined from binomial orx2probabilities. Disease-implicated substitutions
were excluded from these analyses. For interspecies com-parisons, mammalian mtDNA sequences were retrieved from the Mitochondriome website (http://bighost.area.ba.cnr.it/ mitochondriome/Mt_chordata.htm).
Tests for positive selection:Seven primate taxa, namelyHomo
sapiens, P. troglodytes, Gorilla gorilla,Papio hamadryas, Hylobates
lar, Pongo pygmaeus, and Macaca sylvanuswere chosen from
GenBank (gi|17981852, gi|5835121, gi|5835149, gi|5835638, gi|5835820, gi|5835163, gi|14010693) and aligned using clustalW (Thompsonet al.1994) to test for the historic occur-rence of positive, directional selection on the 13 coding re-gions of the primate mitochondrion using the program codeml of the PAML package (Yang2002). In these tests, maximum-likelihood ratios of nonsynonymous-to-synonymous mutations (v) exceeding 1 are consistent with the hypothesis of positive selection, while values close to 1 indicate selective neutrality, and values converging on 0 suggest strong purifying selection. We conducted both lineage and site-specific tests. For the lineage-specific tests, we used a model in which all lineages have the samev(hereafter referred to as M0) and compared that with a model in which vis estimated for each lineage (hereafter referred to as M1). To test for the action of selection among amino acid sites within a specific lineage, we compared a model that allows for heterogeneity invamong sites, but not among lineages, with a model that allows for variation inv
along a predefined lineage (as in Yangand Nielsen2002). We assumed the following unrooted phylogeny (troglodytes, ((((macaca, papio), hylobates), pongo), gorilla), troglodytes), human). However, results of our analyses were robust to minor fluctuations in the tree.
RESULTS
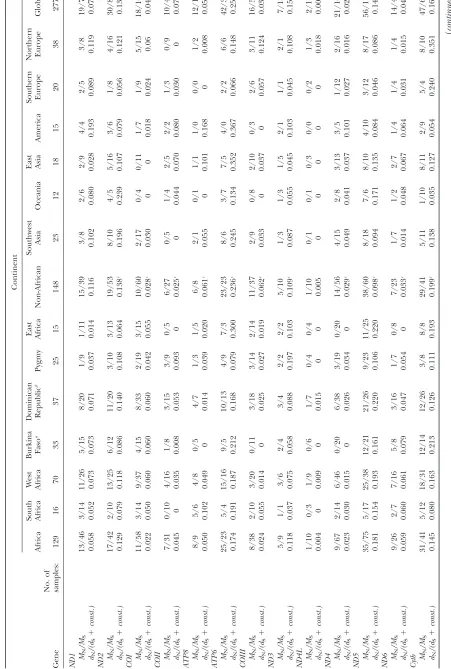
The deepest splits of the phylogeny constructed from 277 mtDNA complete coding region sequences (Figure 1) were sustained by African mtDNAs, which belonged to previously defined haplogroups L0–L5 (Torroniet al. 2001; Salaset al.2002; Mishmaret al.2003; Kivisild et al.2004; Shenet al.2005). A number of new subclades were identified among these (see Figure 1. Haplogroup sharing between distinct geographic regions was gener-ally low. All European sequences could be assigned to clades N1, X, W, HV, TJ, and U (Torroniet al. 1996;
Macaulayet al.1999; Finnila¨et al.2001; Herrnstadt
et al.2002). Asian, Amerindian, Oceanian, and Australian Aborigine sequences belonged to region-specific hap-logroups nested within macro-clades M and N (Kivisild
et al. 2002; Yao et al. 2002; Kong et al. 2003, 2004;
Friedlaenderet al.2005). All Australian Aborigine M
sequences (two from this study and one from Ingman
et al. (2000) share six mutations that define the new
haplogroup M42. The majority of Australian N and R sequences (Ingmanand Gyllensten2003) belong to clades S and P defined by transitions at nucleotide po-sitions (np) 8404 and 15607, respectively (Forsteret al. 2001; Friedlaenderet al.2005).
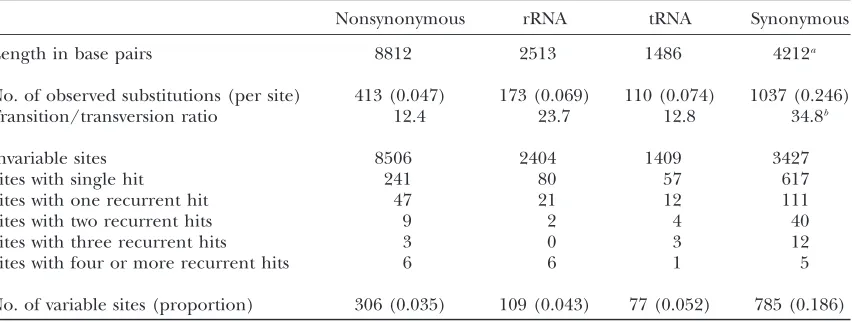
saturation was highlighted by the fact that for more than one-third (417/1292) of the variable sites, regardless of their phylogenetic position on the tree, the derived allele among humans corresponded to the chimpanzee allele. In agreement with noncoding region information (Aquadro and Greenberg1983), a high ratio (21.5 on average, 34.8 in synonymous positions) of transitions to transver-sions was observed in the coding region (577–16023).
Interspecies calibration of the molecular clock over the complete mtDNA sequence (Ingman et al. 2000;
Mishmaret al.2003) is problematic because of
satura-tion of transisatura-tions at silent posisatura-tions and the effect of selection on the fixation rate of amino acid replacement mutations (Hoet al.2005). Assuming 6 million years for the human–chimp species split (Goodmanet al.1998) and 6.5 million years for the most recent common an-cestor of their mtDNA lineages (Mishmaret al.2003), we estimated the average transversion rate at synony-mous and rRNA positions as 2.13109and 4.131010/ year/position, respectively. Using the observed relative rates of different substitution types in humans (Table 1), the average transition rate at 4212 synonymous posi-tions is 3.53108(SD 0.13108)/year/position. Over all genes in mtDNA this would be equivalent to accumu-lation of one synonymous transition/6764 (SD 140) years on average. The coalescent date of the human mitochon-drial DNA tree using this rate is 160,000 (SD 22,000) years. This coalescent date is broadly consistent with the dates of theHomo sapiensfossils recognized so far from Ethiopia (Clarket al.2003; Whiteet al.2003; McDougall et al.2005). The most recent common ancestor of all the Eurasian, American, Australian, Papua New Guinean, and African lineages in clade L3 dates to 65,000 6
8000 years while the average coalescent time of the three basic non-African founding haplogroups M, N, and R is 45,000 years. These estimates, bracketing the time period for the recent out-of-Africa migration (Stringer and
Andrews1988), are younger than those based on
cali-brations involving all coding region sites (Ingmanet al. 2000; Mishmar et al.2003) but are still in agreement with the earliest archaeological signs of anatomically modern humans outside Africa (Mellars2004). The differences between the date estimates of previous stud-ies are most likely due to the overrepresentation of pos-sibly slightly deleterious nonsynonymous mutations in the younger branches of the tree (Elsonet al.2004) that introduces a bias to the coalescent approach if all the sites of the coding region are used.
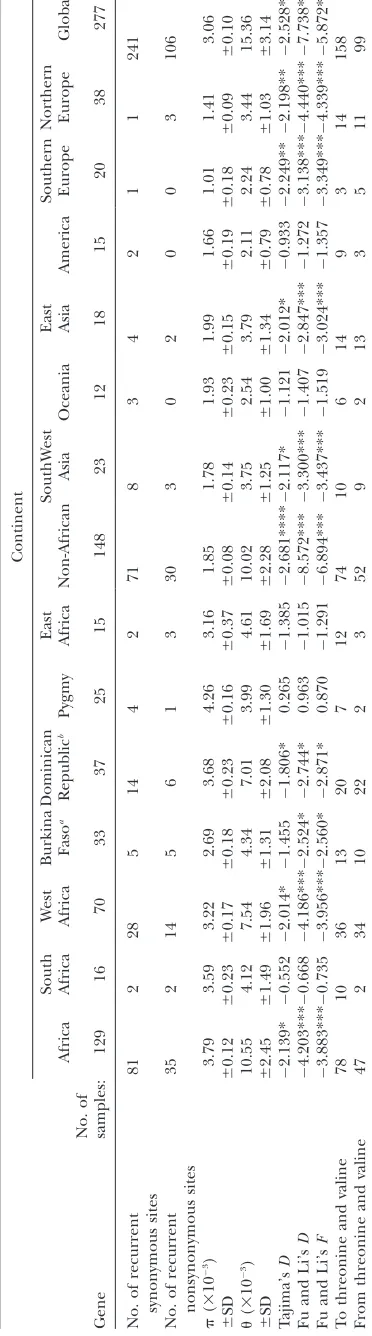
Of the 1788 mutations depicted in the tree, 1758 occurred at 1292 variable sites in the coding region be-tween np 577 and 16023. Consistent with previous reports (Mishmaret al.2003; Moilanenand Majamaa 2003; Elsonet al.2004), there was a significant excess of synonymous mutations in all genes coded by mtDNA, especially among those positions that defined the deeper branches of the tree (Tables 2 and 3). In contrast to Ruiz
-Pesiniet al.(2004), we did not observe any significant
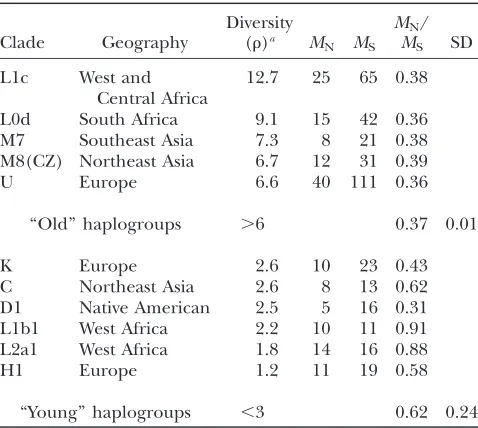
regional (climatic) differences in the rate of nonsynon-ymous changes for mtDNA haplogroups. This discrep-ancy likely results from the fact that Ruiz-Pesini et al. (2004) compared region-specific haplogroups of differ-ent diversity levels:e.g., the ‘‘old’’ paragroup L in Africans vs. ‘‘young’’ Arctic haplogroups (Table 4). Populations of Asian, European, and West African origin showed sig-nificantly negative Tajima’sDvalues (Table 3), consistent with selection, population growth, and/or population
Figure1.—Maximum parsimony tree of 277 human mtDNA coding region sequences. Locations of branch-defining mutations
are listed relative to the revised reference sequence (Andrewset al.1999). Transversions are specified in capital letters, del in-dicates deletion, and1indicates insertion. Amino acid replacements are specified in parentheses with threonine- and valine-affecting changes highlighted in red and blue, respectively.t, change in tRNA;r, change in rRNA gene. Haplogroup labels follow existing classifications (Chenet al.1995; Torroniet al.1993, 1996, 2001; Watsonet al.1997; Macaulayet al.1999; Bandeltet al. 2001; Forsteret al.2001; Kivisildet al.2002, 2004; Konget al.2003; Achilliet al.2004; Palanichamyet al.2004; Shenet al.2004;
Tanakaet al.2004; Friedlaenderet al.2005). Substitutions at np 709, 3693, and 4715 in haplogroups B4, L2, and Z, respectively,
are reconstructed less parsimoniously, yet in accordance with the phylogenetic relations suggested by additional data (Finnila¨
et al.2001; Torroniet al.2001; Kivisildet al.2002; Konget al.2003). Coalescent estimates of haplogroups, shown in thousands of
years in italics next to clade labels, are based on the average number of synonymous transitions to the root of the clade. The tree was rooted using as outgroup the nuclear inserts of mtDNA and the majority consensus of complete sequences of twoP. troglodytes and oneP. paniscus(for details seematerials and methods). The numbers in triangles indicate the additional mutational steps required in comparison to the optimally rooted tree using only the chimpanzee outgroup with red type indicating the root that was rejected (P,0.01) under the assumption of equal evolutionary rate over branches. The positions at which the derived char-acter states in humans and the chimpanzee consensus match are shown above the triangles. Disease-implicated substitutions con-firmed by two independent studies (http://www.mitomap.org) are indicated by ‘‘#.’’ Ad, Af, Am, As, Eu, and Oc correspond to African descent, African, Amerindian, Asian, European, and Oceanian, respectively. The continent of origin is distinguished for each individual sample by box color and subcontinental affiliation is indicated with letters below the boxes where N, E, W, S, C, and SW refer to north, east, west, south, central, and southwest parts of the continents, respectively. BP, Biaka Pygmies; MP, Mbuti Pygmies; A, Australian; P, Papuan; M, Melanesian; H, Hungarian LHON patients; G, Georgian. The two African mtDNAs (L0a2 and L1b1) found in West Asia (Pakistan) are likely due to recent admixture as indicated by their low genetic distance from related African samples presented in the tree and by the fact that they were detected in a Makrani and a Sindhi. According to Quintana
-Murciet al.(2004), the Makrani harbor an extremely high frequency (39%) of the African haplogroups L3d, L3b, L2a, and L1a,
subdivision (Rayet al.2003). That population substruc-ture accounts at least for part of the deviation from neu-trality is obvious from the observation that it decreases upon partitioning of West Africans into a sample from Burkina Faso and one from the Dominican Republican. Significant (P,0.05) mutational bias toward specific (NNG to NNA and NNU to NNC) codon usage was ob-served in 27 of 32 pairs of codons that differed by a tran-sition in the third codon potran-sition (Table 5). This relative preference of G-to-A and T-to-C mutations (per existing nucleotide pool in the light strand) extends over the nonsilent positions and is characteristic of the non-coding D-loop region (Aquadroand Greenberg1983;
Malyarchuk and Rogozin 2004). However, the
gen-eral strand bias, known to be reversed in some Metazoan genera, can be related to asymmetric mutational con-straints involving deaminations of A and C nucleotides during the replication and/or transcription processes
(Hassaninet al.2005). Importantly, the ND6 gene,
en-coded by the heavy strand showed the opposite muta-tional bias, suggesting that the differences of codon usage in human mtDNA might be primarily a function of strand asymmetry rather than of differences in the tRNA pools, as generally expected (Tanakaand Ozawa1994). Notably, 16/18 nucleotide positions (Table 6) that had
under-gone five or more recurrent changes involved the tran-sition of guanine to adenine in the light strand.
Of the 1292 variable sites, 288 (22.2%) had mutated recurrently. Unexpectedly, the hotspots that had mu-tated five or more times were predominantly within mitochondrial rRNA (P,53 1015) and showed a sig-nificantly higher ratio of nonsynonymous-to-silent mu-tations (90:32 hits, respectively) than polymorphic sites with lower recurrence (608:1004) (Table 6). Finally, these hotspots of mutational activity included positions where the human-derived allele predominates in the mamma-lian consensus sequences (e.g., np 709, 3010, 10398, and 13928), implying the effect of site-specific positive selec-tion. Among the six nonsynonymous substitutions that have recurred four or more times, five involved threo-nine (P , 6.1 3107). Overall, threonine and valine codons were involved in 259 of the 414 amino acid replacements observed on the tree.
Lineage-specific tests failed to detect significant posi-tive selection along any unique lineage in the seven-taxon phylogeny of primates. A model fixing a single ratio ofvto all lineages (M0) could not be rejected in favor of a model of differentv’s on specified lineages (M1). The vestimated across all lineages in the phy-logeny was 0.35. A test of the previous model against a
TABLE 2
Distribution of mutations as a function of derived-allele frequency in 277 mtDNAs
Frequency (%) Nonsynonymous Synonymous
Nonsynonymous/
synonymous tRNA rRNA
rRNA/ synonymous
,1 221 514 0.43 49 63 0.12
1–5 67 197 0.34 24 28 0.14
5–10 14 39 0.38 1 8 0.21
.10 5 32 0.16* 3 10 0.31*
*P,0.05.
TABLE 1
Distribution of mtDNA mutations by recurrence
Nonsynonymous rRNA tRNA Synonymous
Length in base pairs 8812 2513 1486 4212a
No. of observed substitutions (per site) 413 (0.047) 173 (0.069) 110 (0.074) 1037 (0.246)
Transition/transversion ratio 12.4 23.7 12.8 34.8b
Invariable sites 8506 2404 1409 3427
Sites with single hit 241 80 57 617
Sites with one recurrent hit 47 21 12 111
Sites with two recurrent hits 9 2 4 40
Sites with three recurrent hits 3 0 3 12
Sites with four or more recurrent hits 6 6 1 5
No. of variable sites (proportion) 306 (0.035) 109 (0.043) 77 (0.052) 785 (0.186)
aIncludes 2039 sites that are allowed to carry synonymous transversions.
T ABLE 3 Ratios of numbers and rates of nonsynonymous over synonymous sites, nucleotide diversity , T ajima’s D , F u and Li’s D and F , and number of changes fr om and to valine and threonine for the 13 pr otein-coding mitochondrial genes according to continental affiliation C ontine nt Africa South Africa W est Africa Burkina Faso a Domi nican Republ ic b P ygmy East Afric a Non-African Southwe st Asi a Oceani a East Asia America Souther n Europe Northe rn Europe Globa l Gen e No. of sam ples: 129 16 70 33 37 25 15 148 23 12 18 15 20 38 277 ND1 MN /M S 13/46 3/14 11/26 5/15 8/20 1/9 1/11 15/39 3/ 8 2/6 2/9 4/4 2/5 3/8 19/74 dN /(d S 1 const.) 0.0 58 0.0 52 0.0 73 0.073 0.071 0.0 37 0.014 0.116 0.102 0.080 0.0 28 0.1 93 0.0 89 0.1 19 0.0 74 ND2 MN /M S 17/42 2/10 13/25 6/12 11/20 3/ 10 3/13 19/53 8/10 4/5 5/ 16 3/6 1/8 4/ 16 30/84 dN /(d S 1 const.) 0.1 29 0.0 79 0.1 18 0.086 0.140 0.1 08 0.064 0.138 c 0.196 0.239 0.1 07 0.0 79 0.0 56 0.1 21 0.1 36 COI MN /M S 11/58 3/14 9/ 37 4/15 8/33 2/ 19 3/15 10/60 2/17 0/4 0/ 11 1/7 1/9 5/ 15 18/100 dN /(d S 1 const.) 0.0 22 0.0 50 0.0 60 0.060 0.060 0.0 42 0.055 0.028 c 0.030 0 0 0.0 18 0.0 24 0.06 0.0 43 COII MN /M S 7/31 0/10 4/ 16 1/ 8 3/15 3/9 0/ 5 6/27 0/ 5 1/4 2/5 2/2 1/3 0/9 10/49 dN /(d S 1 const.) 0.0 45 0 0.0 35 0.008 0.053 0.0 93 0 0.025 c 0 0.044 0.0 70 0.0 80 0.0 30 0 0.0 73 A TP8 M N /M S 8/9 5/6 4/8 0/ 5 4/7 1/3 1/ 5 6/8 2/ 1 0/1 1/1 1/0 0/0 1/2 12/14 dN /(d S 1 const.) 0.0 50 0.1 02 0.0 49 0 0.014 0.0 39 0.020 0.061 c 0.055 0 0.1 01 0.1 68 0 0.0 08 0.0 54 A TP6 M N /M S 25/23 5/4 15/16 9/ 5 10/13 4/9 7/ 3 23/23 8/ 6 3/7 7/5 4/0 2/2 6/6 42/39 dN /(d S 1 const.) 0.1 74 0.1 91 0.1 87 0.212 0.168 0.0 79 0.300 0.236 c 0.245 0.134 0.3 52 0.3 67 0.0 66 0.1 48 0.2 59 COIII MN /M S 8/38 2/10 3/ 20 0/11 3/18 3/ 14 2/14 11/37 2/ 9 0/8 2/ 10 0/3 2/6 3/ 11 16/59 dN /(d S 1 const.) 0.0 24 0.0 55 0.0 14 0 0.025 0.0 27 0.019 0.062 c 0.033 0 0.0 37 0 0.0 57 0.1 24 0.0 37 ND3 MN /M S 5/9 1/1 3/6 2/ 4 3/4 2/2 2/ 2 5/10 1/ 3 1/3 1/5 2/1 1/1 2/1 7/18 dN /(d S 1 const.) 0.1 18 0.0 37 0.0 75 0.058 0.088 0.1 97 0.103 0.109 c 0.087 0.055 0.0 45 0.1 03 0.0 45 0.1 08 0.1 57 ND4L MN /M S 1/10 0/3 1/9 0/ 6 1/7 0/4 0/ 4 1/10 0/ 1 0/1 0/3 0/0 0/2 1/3 2/16 dN /(d S 1 const.) 0.0 04 0 0.0 09 0 0.015 0 0 0.005 0 0 0 0 0 0.0 18 0.0 05 ND4 MN /M S 9/67 2/14 6/ 46 0/20 6/38 3/ 19 0/20 14/56 4/15 2/8 3/ 13 3/5 1/12 2/ 16 21/103 dN /(d S 1 const.) 0.0 23 0.0 30 0.0 15 0 0.026 0.0 34 0 0.029 c 0.049 0.041 0.0 37 0.1 01 0.0 27 0.0 16 0.0 24 ND5 MN /M S 35/75 5/17 25/38 12/ 21 21/26 9/ 23 11/ 25 38/60 8/18 7/6 8/ 10 4/10 3/12 8/ 17 56/112 dN /(d S 1 const.) 0.1 81 0.1 54 0.1 93 0.161 0.220 0.1 06 0.220 0.098 c 0.094 0.171 0.1 35 0.0 84 0.0 46 0.0 86 0.1 45 ND6 MN /M S 9/26 2/7 7/ 16 5/ 8 3/16 1/7 0/ 8 7/23 1/ 7 1/2 2/7 1/4 1/4 1/4 14/42 dN /(d S 1 const.) 0.0 59 0.0 60 0.0 61 0.079 0.047 0.0 54 0 0.033 c 0.014 0.048 0.0 67 0.0 64 0.0 31 0.0 15 0.0 47 Cyt
b MN
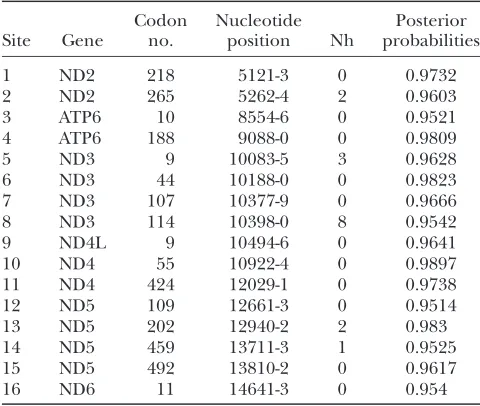
model enforcing neutral selection, wherevis expected to be equal to 1, showed that these data do not deviate significantly from neutrality (M0 was rejected in favor of model wherev¼1;P0, d.f.¼1). Further tests for lineage-specific variation inv, including a model that assigned a differentvto the human lineage from the remaining primates, did not fit the data as well as M1 did. However, site-specific model testing revealed sig-nificant positive selection across regions of the primate mitochondrion. A model enforcing a singlevratio on all codon sites was rejected in favor of a model allowing for three ratios across sites with three site classes (P0, d.f.¼5). The three-ratio model identified 16 codon sites to be under significant (posterior probabilities. 0.95;dN/dS¼2.02) positive selection (Table 7). Among these, four codon sites appeared to be among the non-synonymous sites with recurrent mutation (particularly no. 114 in the ND3 gene, np 10398 with seven recur-rences) in human–human comparisons (Table 6).
A majority of the mitochondrial disease-related mu-tations have been detected in the tRNA genes, and they mainly affect the secondary structure of the molecule
(McFarlandet al. 2004 and references therein). Our
global survey of natural variation in the tRNA genes showed a sevenfold excess of tRNAThrmutations (N ¼
28) over other tRNA genes (P , 1019). This finding would suggest, at first glance, that this gene might have become nonfunctional in the mitochondrion and that its encoded tRNA needs to be imported from the nucleus. Evidence suggesting nuclear tRNA import into mito-chondria in marsupials has been obtained previously
(Do¨ rneret al. 2001). However, plotting the observed
mutations in the tRNAThrgene against the mammalian consensus sequences (Helm et al. 2000) showed that none of the mutations that we have observed in 277 hu-mans fell within the 100% conserved regions of the tRNA (Figure 2). Most pathological mutations affecting tRNAs cluster in highly conserved regions (McFarlandet al. 2004), as illustrated in the case of tRNALeuin Figure 2. Four private mutations changed the nucleotide that is
.90% conserved in mammalian tRNAThr, while most of
the frequent and recurrent mutations in the data set affected the minor fraction of the sites that are not highly conserved in mammalian species. This argues against the proposition that human mitochondrial tRNAThrhas lost function. A large fraction (12/28) of the mutations affecting tRNAThroccurred at three positions, two of which have a different allele in consensus humans as com-pared to the 31 mammalian species analyzed by Helm et al.(2000). Similarly, a mutational hotspot at position 5821 in tRNACys showed a majority allele in humans different from that found in consensus mammalians (Figure 2). Surprisingly, in the latter tRNA we observed two parallel mutations at position 5814 that have been previously reported pathogenic. Yet, because this posi-tion is not highly conserved in other mammalian species, its pathological role has to be questioned. No other tRNA site that has been confirmed as associated with mito-chondrial disease was found to be variable in our data set. The only mutational hotspot (12,172) affecting the human allele that matches the allele conserved in.90% of mammalian tRNA-s was found in tRNAHis.
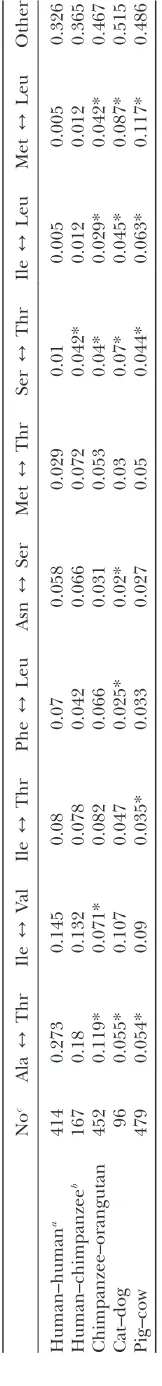
A comparison of the amino acid substitutions in the mtDNA-encoded proteins in humans, primates, carni-vores, and artiodactyls revealed that substitutions between threonine and alanine are significantly overrepresented in humans while changes between methionine and leu-cine are most common in other mammalian species (Table 8). The direction of threonine and valine sub-stitution with other amino acids was significantly differ-ent among populations with neutral and significantly negative Tajima’s Dvalues, respectively (Table 3), and among haplogroups: in H1 sequences sampled broadly from Europe and the Near East, 7 of 11 nonsynonymous mutations resulted in the replacement of threonine and valine with alanine and isoleucine, while only three mu-tations resulted in a change toward threonine or valine (Figure 1). In contrast to this pattern, in haplogroup V sequences from Finland (Finnila¨ et al. 2001), where populations continued to rely largely on hunting and fishing for subsistence even after the first contacts with farmers, six of seven replacement polymorphisms
TABLE 4
The rate of nonsynonymous/synonymous changes in relation to continental geography and haplo-group diversity
Clade Geography
Diversity
(r)a MN MS
MN/
MS SD
L1c West and
Central Africa
12.7 25 65 0.38
L0d South Africa 9.1 15 42 0.36
M7 Southeast Asia 7.3 8 21 0.38
M8(CZ) Northeast Asia 6.7 12 31 0.39
U Europe 6.6 40 111 0.36
‘‘Old’’ haplogroups .6 0.37 0.01
K Europe 2.6 10 23 0.43
C Northeast Asia 2.6 8 13 0.62
D1 Native American 2.5 5 16 0.31
L1b1 West Africa 2.2 10 11 0.91
L2a1 West Africa 1.8 14 16 0.88
H1 Europe 1.2 11 19 0.58
‘‘Young’’ haplogroups ,3 0.62 0.24
a
resulted in a change to threonine and valine, and none resulted in the replacement of the latter two amino acids (P,0.01). Similarly, L3 sequences of West African origin showed a significantly lower (P,0.001) ratio of gains to losses of threonine and valine residues (13/14) than haplogroup L0 sequences from East and South Africa (22/2; Figure 1). East Asian sequences showed an increase of valine codons (9 mutations to and 2 from valine codons), but also a significant (P , 0.01) decrease of threonine, with 11 mutations from and 5 to threonine codons, while Native Americans had 1 mutation from and 7 to threonine, respectively. Over all haplogroups and genes, the direction of amino acid change was sig-nificantly (P,0.02) biased toward replacement of iso-leucine and methionine to valine, even when considering
the transitional preferences observed in the mitochon-drial D-loop (Tamuraand Nei1993). The strand-specific mutational biases are unlikely to explain this pattern because of the observed excess of mutations involving valine codons (8/16 in our data set and 13/16 in the list of ND6 polymorphic sites in MITOMAP) in the ND6 gene that is encoded by the opposite strand.
DISCUSSION
In phylogenetic analysis of human mitochondrial DNA-coding region sequences, two different spheres of character evolution can be distinguished (Hoet al. 2005; Penny 2005). First, within our species, at the population level, a relatively low level of parallel
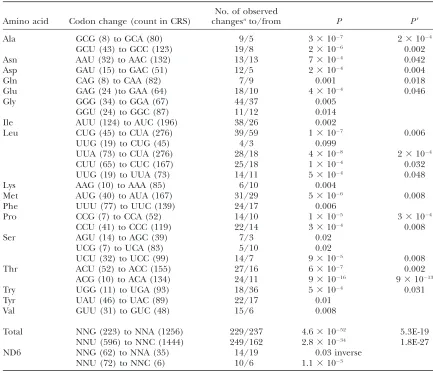
TABLE 5
Significant differences (P,0.05) in mutational direction in synonymous sites
Amino acid Codon change (count in CRS)
No. of observed
changesato/from P P9
Ala GCG (8) to GCA (80) 9/5 33107 23104
GCU (43) to GCC (123) 19/8 23106 0.002
Asn AAU (32) to AAC (132) 13/13 73104 0.042
Asp GAU (15) to GAC (51) 12/5 23104 0.004
Gln CAG (8) to CAA (82) 7/9 0.001 0.018
Glu GAG (24 )to GAA (64) 18/10 43104 0.046
Gly GGG (34) to GGA (67) 44/37 0.005
GGU (24) to GGC (87) 11/12 0.014
Ile AUU (124) to AUC (196) 38/26 0.002
Leu CUG (45) to CUA (276) 39/59 13107 0.006
UUG (19) to CUG (45) 4/3 0.099
UUA (73) to CUA (276) 28/18 43108 23104
CUU (65) to CUC (167) 25/18 13104 0.032
UUG (19) to UUA (73) 14/11 53104 0.048
Lys AAG (10) to AAA (85) 6/10 0.004
Met AUG (40) to AUA (167) 31/29 53106 0.008
Phe UUU (77) to UUC (139) 24/17 0.006
Pro CCG (7) to CCA (52) 14/10 13105 33104
CCU (41) to CCC (119) 22/14 33104 0.008
Ser AGU (14) to AGC (39) 7/3 0.02
UCG (7) to UCA (83) 5/10 0.02
UCU (32) to UCC (99) 14/7 93105 0.008
Thr ACU (52) to ACC (155) 27/16 63107 0.002
ACG (10) to ACA (134) 24/11 931016 931013
Try UGG (11) to UGA (93) 18/36 53104 0.031
Tyr UAU (46) to UAC (89) 22/17 0.01
Val GUU (31) to GUC (48) 15/6 0.008
Total NNG (223) to NNA (1256) 229/237 4.631052 5.3E-19
NNU (596) to NNC (1444) 249/162 2.831034 1.8E-27
ND6 NNG (62) to NNA (35) 14/19 0.03 inverse
NNU (72) to NNC (6) 10/6 1.13103
Pis a chi-square probability assuming equal rates of codon exchange and estimates the difference from the expected number of changes, given the codon frequencies in the reference mtDNA sequence (Andrewset al. 1999). P9is binomial probability taking into account additional transitional biases observed over the whole mitochondrial genome favoring transitions G to A over A to G and T to C over C to T by factors of 2.33 and 1.93, per respective nucleotides.
aNumber of changes corresponds to mutations (including multiple hits per site) inferred in phylogenetic
mutations—as compared to the mtDNA control-region-based phylogenies—enables the reconstruction of the unrooted tree from individual sequences without sig-nificant ambiguity. This tree is determined by a sub-stantial fraction of amino acid replacement mutations whose proportion to synonymous substitutions increases from the average of 0.37 in ‘‘older’’ clades to 0.62 in ‘‘younger’’ ones. In the second sphere, a high level of homoplasy with chimpanzees, affecting at least one-third of the variable sites in humans, complicates detailed phylogenetic analyses at the interspecies level. Approximately 930 synonymous mutations that can be observed between human and chimpanzee mtDNA represent only the visible component of variation between the species while the effective ratio of non-synonymous-to-silent mutations is expectedly signifi-cantly less than the observed value of 0.2 due to the hidden load of synonymous mutations. These differ-ences between the two spheres imply that, even among the substitutions that define the deepest branches of the human mtDNA tree, a significant excess of nonsynon-ymous mutations have not yet been eliminated by
TABLE 6
Number and location of recurrent mutations in the mtDNA coding region (577–16023)
No. of
recurrences Nucleotide positions
14 709r
10 13708 (A to T)
8 1888r, 8251
7 11914, 10398 (A4T)
5 1438r, 5460 (A to T), 13105 (I to V)
4 1598r, 1719r, 3010r, 13928C (S to T),
13966 (T to A), 15930t, 5147, 13368, 15217
3 3394 (Y to H), 5821t, 12172t, 14110 (F to L), 15110 (A to T), 15924t, 5231, 6182, 6221, 7055, 8790, 9545, 9554, 9950, 12007, 12501, 13359, 15514
2 930r, 1503r, 2768r, 3434 (Y to C),
4025 (T to M), 4048 (D to N), 5046 (V to I),
5773t, 8027 (A to T), 10084 (I to T),
12236t, 12950 (N to S), 13759 (A to T), 14687t, 15758 (I to V), 15927t, 3666, 3915, 4562, 4580, 4688, 4703, 5417, 5471, 5585-nc, 6260, 6446, 6680, 6752, 7076, 7388, 8020, 8152, 8155, 8392, 8964, 8994, 9254, 9266, 9509, 9755, 9824, 9932, 10685, 10790, 11260, 11944, 12354, 12477, 12810, 14007, 14034, 14148, 14182, 14905, 15115, 15301, 15784, 15884-nc
Amino acid changes are indicated in parentheses. r, change in rRNA;t, change in tRNA sequences; nc, change in noncoding position. The following positions showed a sin-gle recurrence, having mutated twice: 593t, 597t, 719r,
813r, 827r, 1018r, 1193r, 1243r, 1694r, 1811r,
1822r, 2245r, 2332r, 2352r, 2416r, 2706r, 2757
r, 2772r, 2789r, 2885r, 3203r, 3206r, 3505 (T to
A), 4500 (S to P), 4596 (V to I), 4824 (T to A), 4917 (N to D), 5442 (F to L), 5910 (A to T), 6253 (M to T), 6261 (A to T), 6480 (V to I), 7389 (Y to H), 7444 (Ter to K), 7569t, 7673 (I to V), 7805 (V to I), 7853 (V to I), 8329Gt, 8387 (V to M), 8393 (P to S), 8566 (I to V), 8584 (A to T), 9095 (L to P), 9139 (A to T), 9438 (G to S), 9477 (V to I), 9861 (F to L), 9966 (V to I), 10031 t, 10143 (G to S), 10321 (V to A), 10463t, 11016 (S to N), 11025 (L to P), 12142t, 12248t, 12346 (H to Y), 12358 (T to A), 12397 (T to A), 12940 (A to T), 13135 (A to T), 13145 (S to N), 13651 (T to A), 13879 (S to P), 13889 (C to Y), 14129 (T to I), 14180 (Y to C), 14315 (S to N), 14798 (F to L), 15287 (F to L), 15314 (A to T), 15317 (A to T), 15323 (A to T), 15326 (T to A), 15479 (F to L), 15907t, 15928t, 15939t, 15951t, 3483, 3591, 3693, 3777, 3834, 3852, 4038, 4117, 4200, 4248, 4655, 4715, 4823, 4883, 4907, 4916, 4937, 5054C, 5162, 5237, 5393, 5580-nc, 5581-nc, 5656-nc,6026, 6179, 6392, 6431, 6455, 6827, 7184, 7337, 7424, 7861, 8050, 8104, 8227, 8269, 8277-nc,8383, 8485, 8697, 8856, 9150, 9180, 9299, 9305, 9365, 9377, 9449, 9716, 9758, 9899, 10238, 10389, 10586, 10589, 10688, 11002, 11257, 11299, 11332, 11350, 11353, 11383, 11404, 11437, 11452, 11812, 11854, 12372, 12432, 12540, 12609, 12630, 12720, 12771, 13020, 13104, 13116, 13215, 13263, 13470, 13590, 13680, 13827, 13980, 14094, 14212, 14233, 14323, 14364, 14470, 14560, 14581, 14620, 14668, 15043, 15061, 15106, 15148, 15172, 15289, 15313, 15346, 15394, 15454, 15466, 15550, 15607, 15670, 15697, 15883, 15886-nc.
TABLE 7
Codon sites found to be under positive selection in the mitochondrion-encoded protein genes in primates
Site Gene
Codon no.
Nucleotide
position Nh
Posterior probabilities
1 ND2 218 5121-3 0 0.9732
2 ND2 265 5262-4 2 0.9603
3 ATP6 10 8554-6 0 0.9521
4 ATP6 188 9088-0 0 0.9809
5 ND3 9 10083-5 3 0.9628
6 ND3 44 10188-0 0 0.9823
7 ND3 107 10377-9 0 0.9666
8 ND3 114 10398-0 8 0.9542
9 ND4L 9 10494-6 0 0.9641
10 ND4 55 10922-4 0 0.9897
11 ND4 424 12029-1 0 0.9738
12 ND5 109 12661-3 0 0.9514
13 ND5 202 12940-2 2 0.983
14 ND5 459 13711-3 1 0.9525
15 ND5 492 13810-2 0 0.9617
16 ND6 11 14641-3 0 0.954
The test of positive selection (dN/dS?1) was applied to 13 protecoding genes of mtDNA in the phylogenetic tree in-volving seven primate species:H. sapiens, P. troglodytes, G.
go-rilla, P. hamadryas, H. lar, P. pygmaeus, and M. sylvanus)
purifying selection—assuming, of course, that they are generally deleterious, after all.
More than half of the amino acid replacements observed in the human mtDNA tree involved threonine and valine codons. Adaptive correlation with the elevated mutabil-ity in the mitochondrion-encoded tRNAThr, in principle, could be considered as one explanation for the excess of mutations involving threonine codons. However, none of the highly conserved sites in the tRNAThr gene was found to be different in humans from that of the con-sensus mammalians and, instead, the excessive variabil-ity in this gene could be ascribed largely to the presence of three hotspot positions. Furthermore, no such gen-eral molecular phenomenon or the characteristic G-to-A and T-to-C mutational bias on the light strand of mtDNA would explain the pattern of differences of amino acid replacement directions that were observed among hu-man populations.
One factor that could explain, theoretically at least, the different amino acid replacement patterns observed among populations and between humans and other
mammals is diet. Threonine and valine, essential amino acids that must be taken in the diet, are abundant in meats, fish, peanuts, lentils, and cottage cheese, but deficient in most grains. Alternatively, or in combina-tion with dietary restriccombina-tion, other constraints of selec-tion on slightly deleterious posiselec-tions during the phases of population expansion and contraction may be in-volved. Because of the specific compositional bias in mtDNA induced by characteristic mutational prefer-ences different from those observed in the nuclear ge-nome, additional inter- and intraspecies comparisons of mtDNA-encoded amino acid replacement patterns should be examined to gain deeper insights into the nonsynonymous character evolution in metazoan mito-chondria, particularly in taxa with shifted strand symmetry
(Hassaninet al.2005).
Tests of neutrality based on the comparisons of the ratio of nonsynonymous and synonymous mutations across all sites can detect only major effects of purifying (KN/KSapproaches 0) or directional selection (KN/KS is significantly.1), which affect simultaneously a large
Figure2.—Natural and
patho-logical variation in human mito-chondrial species of tRNAs. Mutations observed in this study are in yellow; those with a status of confirmed pathological varia-tion (http://www.mitomap.org) are in red triangles. Nucleotide positions that are 100% and 90% conserved in mammalian species
(Helmet al.2000) are highlighted
number of codon positions. Consistent with previous studies (Cannet al.1984; Nachmanet al.1996; Ingman and Gyllensten2001; Mishmaret al.2003; Moilanen
et al.2003; Moilanenand Majamaa2003; Elsonet al.
2004; Ruiz-Pesiniet al.2004) human mtDNA-encoded proteins did not provide evidence of directional selection. However, several hotspots of mutational activity included nonsilent substitutions susceptible to site-specific posi-tive selection. Comparing the mtDNA protein-encoding genes from several primates (Macaca, Papio, Hylobates, Pongo, Gorilla, and Pan) with human ones, we discov-ered significant positive selection in several regions, generally nonmatching, however, with the codons dis-playing a highKN/KSratio in human–human compar-isons. This difference might be explained by the dynamic polarity of the amino acid replacements at the intra- and interspecies levels whereby the constraint of selection is determined in each lineage by the ancestral state of each codon position.
In conclusion, we have provided new evidence for nonrandom processes affecting the evolution of the human mtDNA-encoded proteins. The potential role of selection in affecting fixation probabilities at different nonsilent positions undermines the appropriateness of using the average mitochondrial clock over all sites in dating events in human population history. Despite the evidence of departures from neutrality and high levels of homoplasy at the interspecies level, the phylogenetic approach for analyzing mtDNA sequence data at the intraspecies level remains viable because the recon-struction of the basic branches is robust and the excess of nonsynonymous substitutions affects mainly the ter-minal branches of the tree.
We thank Richard Villems for useful comments. This work was sup-ported by National Institutes of Health grants GM28428, GM63883, and GM55273, European Commission research grant QLG2-CT-2002-90455, Progetto Consiglio Nazionale delle Ricerche-Ministero dell Istruzione, dell Universita e della Ricerca Genomica Funzionale-Legge 449/97, and Telethon-Italy E.0890. We thank Rita Horvath for pro-viding DNA samples.
LITERATURE CITED
Achilli, A., C. Rengo, C. Magri, V. Battaglia, A. Olivieriet al., 2004 The molecular dissection of mtDNA haplogroup H con-firms that the Franco-Cantabrian glacial refuge was a major source for the European gene pool. Am. J. Hum. Genet.75:910–918. Andrews, R. M., I. Kubacka, P. F. Chinnery, R. N. Lightowlers,
D. M. Turnbullet al., 1999 Reanalysis and revision of the Cam-bridge reference sequence for human mitochondrial DNA. Nat. Genet.23:147.
Aquadro, C. F., and B. D. Greenberg, 1983 Human mitochondrial DNA variation and evolution: analysis of nucleotide sequences from seven individuals. Genetics103:287–312.
Bandelt, H.-J., P. Forsterand A. Ro¨ hl, 1999 Median-joining networks for inferring intraspecific phylogenies. Mol. Biol. Evol.16:37–48. Bandelt, H. J., J. Alves-Silva, P. E. Guimaraes, M. S. Santos,
A. Brehmet al., 2001 Phylogeography of the human mitochon-drial haplogroup L3e: a snapshot of African prehistory and Atlantic slave trade. Ann. Hum. Genet.65:549–563.
Cann, R. L., W. M. Brownand A. C. Wilson, 1984 Polymorphic sites and the mechanism of evolution in human mitochondrial DNA. Genetics106:479–499.
Chen, Y. S., A. Torroni, L. Excoffier, A. S. Santachiara-Benerecetti and D. C. Wallace, 1995 Analysis of mtDNA variation in Afri-can populations reveals the most ancient of all human continent-specific haplogroups. Am. J. Hum. Genet.57:133–149. Clark, J. D., Y. Beyene, G. WoldeGabriel, W. K. Hart, P. R. Renne
et al., 2003 Stratigraphic, chronological and behavioural con-texts of Pleistocene Homo sapiens from Middle Awash, Ethiopia. Nature423:747–752.
Denaro, M., H. Blanc, M. J. Johnson, K. H. Chen, E. Wilmsenet al., 1981 Ethnic variation in Hpa 1 endonuclease cleavage patterns of human mitochondrial DNA. Proc. Natl. Acad. Sci. USA78:
5768–5772.
Do¨ rner, M., M. Altmann, S. Pa¨ a¨ boand M. Morl, 2001 Evidence for import of a lysyl-tRNA into marsupial mitochondria. Mol. Biol. Cell12:2688–2698.
Elson, J. L., D. M. Turnbulland N. Howell, 2004 Comparative genomics and the evolution of human mitochondrial DNA: as-sessing the effects of selection. Am. J. Hum. Genet.74:229–238. Finnila¨, S., M. S. Lehtonenand K. Majamaa, 2001 Phylogenetic network for European mtDNA. Am. J. Hum. Genet.68:1475– 1484.
Forster, P., R. Harding, A. Torroniand H.-J. Bandelt, 1996 Origin and evolution of Native American mtDNA variation: a reap-praisal. Am. J. Hum. Genet.59:935–945.
Forster, P., A. Torroni, C. Renfrewand A. Ro¨ hl, 2001 Phylo-genetic star contraction applied to Asian and Papuan mtDNA evolution. Mol. Biol. Evol.18:1864–1881.
Friedlaender, J., T. Schurr, F. Gentz, G. Koki, F. Friedlaender
et al., 2005 Expanding southwest Pacific mitochondrial haplo-groups P and Q. Mol. Biol. Evol.22:1506–1517.
Giles, R. E., H. Blanc, H. M. Cannand D. C. Wallace, 1980 Ma-ternal inheritance of human mitochondrial DNA. Proc. Natl. Acad. Sci. USA77:6715–6719.
Goodman, M., C. A. Porter, J. Czelusniak, S. L. Page, H. Schneider
et al., 1998 Toward a phylogenetic classification of primates based on DNA evidence complemented by fossil evidence. Mol. Phylogenet. Evol.9:585–598.
Hassanin, A., N. Legerand J. Deutsch, 2005 Evidence for multi-ple reversals of asymmetric mutational constraints during the evolution of the mitochondrial genome of metazoa, and conse-quences for phylogenetic inferences. Syst. Biol.54:277–298. Helm, M., H. Brule, D. Friede, R. Giege, D. Putzet al., 2000 Search
for characteristic structural features of mammalian mitochon-drial tRNAs. RNA6:1356–1379.
Herrnstadt, C., J. L. Elson, E. Fahy, G. Preston, D. M. Turnbull
et al., 2002 Reduced-median-network analysis of complete mito-chondrial DNA coding-region sequences for the major African, Asian, and European haplogroups. Am. J. Hum. Genet. 70:
1152–1171.
Ho, S. Y., M. J. Phillips, A. Cooperand A. J. Drummond, 2005 Time dependency of molecular rate estimates and systematic overesti-mation of recent divergence times. Mol. Biol. Evol.22:1561–1568. Ingman, M., and U. Gyllensten, 2001 Analysis of the complete hu-man mtDNA genome: methodology and inferences for huhu-man evolution. J. Hered.92:454–461.
Ingman, M., and U. Gyllensten, 2003 Mitochondrial genome var-iation and evolutionary history of Australian and New Guinean aborigines. Genome Res.13:1600–1606.
Ingman, M., H. Kaessmann, S. Pa¨ a¨ boand U. Gyllensten, 2000 Mito-chondrial genome variation and the origin of modern humans. Nature408:708–713.
Kivisild, T., H.-V. Tolk, J. Parik, Y. Wang, S. S. Papiha et al., 2002 The emerging limbs and twigs of the East Asian mtDNA tree. Mol. Biol. Evol.19:1737–1751 (erratum: Mol. Biol. Evol.
20:162).
Kivisild, T., M. Reidla, E. Metspalu, A. Rosa, A. Brehm et al., 2004 Ethiopian mitochondrial DNA heritage: tracking gene flow across and around the gate of tears. Am. J. Hum. Genet.
75:752–770.
Kong, Q.-P., Y.-G. Yao, C. Sun, H.-J. Bandelt, C.-L. Zhu et al., 2003 Phylogeny of East Asian mitochondrial DNA lineages inferred from complete sequences. Am. J. Hum. Genet. 73:
671–676.
Kong, Q. P., Y. G. Yao, C. Sun, C. L. Zhu, L. Zhonget al., 2004 Phylo-geographic analysis of mitochondrial DNA haplogroup F2 in
China reveals T12338C in the initiation codon of the ND5 gene not to be pathogenic. J. Hum. Genet.49:414–423.
Macaulay, V. A., M. B. Richards, E. Hickey, E. Vega, F. Cruciani
et al., 1999 The emerging tree of West Eurasian mtDNAs: a synthesis of control-region sequences and RFLPs. Am. J. Hum. Genet.64:232–249.
Malyarchuk, B. A., and I. B. Rogozin, 2004 Mutagenesis by tran-sient misalignment in the human mitochondrial DNA control re-gion. Ann. Hum. Genet.68:324–339.
McDougall, I., F. H. Brownand J. G. Fleagle, 2005 Stratigraphic placement and age of modern humans from Kibish, Ethiopia. Nature433:733–736.
McFarland, R., J. L. Elson, R. W. Taylor, N. Howelland D. M. Turnbull, 2004 Assigning pathogenicity to mitochondrial tRNA mutations: when ‘‘definitely maybe’’ is not good enough. Trends Genet.20:591–596.
Mellars, P., 2004 Neanderthals and the modern human coloniza-tion of Europe. Nature432:461–465.
Mishmar, D., E. Ruiz-Pesini, P. Golik, V. Macaulay, A. G. Clark
et al., 2003 Natural selection shaped regional mtDNA variation in humans. Proc. Natl. Acad. Sci. USA100:171–176.
Moilanen, J. S., and K. Majamaa, 2003 Phylogenetic network and physicochemical properties of nonsynonymous mutations in the protein-coding genes of human mitochondrial DNA. Mol. Biol. Evol.20:1195–1210.
Moilanen, J. S., S. Finnilaand K. Majamaa, 2003 Lineage-specific selection in human mtDNA: lack of polymorphisms in a seg-ment of MTND5 gene in haplogroup J. Mol. Biol. Evol. 20:
2132–2142.
Nachman, M. W., W. M. Brown, M. Stonekingand C. F. Aquadro, 1996 Nonneutral mitochondrial DNA variation in humans and chimpanzees. Genetics142:953–963.
Palanichamy, M., C. Sun, S. Agrawal, H.-J. Bandelt, Q.-P. Kong
et al., 2004 Phylogeny of mtDNA macrohaplogroup N in India based on complete sequencing: implications for the peopling of South Asia. Am. J. Hum. Genet.75:966–978.
Penny, D., 2005 Evolutionary biology: relativity for molecular clocks. Nature436:183–184.
Quintana-Murci, L., R. Chaix, S. Wells, D. Behar, H. Sayaret al., 2004 Where West meets East: the complex mtDNA landscape of the Southwest and Central Asian corridor. Am. J. Hum. Genet.
74:827–845.
Ray, N., M. Curratand L. Excoffier, 2003 Intra-deme molecular diversity in spatially expanding populations. Mol. Biol. Evol.20:
76–86.
Ruiz-Pesini, E., D. Mishmar, M. Brandon, V. Procaccioand D. C. Wallace, 2004 Effects of purifying and adaptive selection on regional variation in human mtDNA. Science303:223–226. Saillard, J., P. Forster, N. Lynnerup, H.-J. Bandelt and S.
Norby, 2000 mtDNA variation among Greenland Eskimos: the edge of the Beringian expansion. Am. J. Hum. Genet.67:
718–726.
Salas, A., M. Richards, T. De laFe, M. V. Lareu, B. Sobrinoet al., 2002 The making of the African mtDNA landscape. Am. J. Hum. Genet.71:1082–1111.
Shen, P., T. Lavi, T. Kivisild, V. Chou, D. Sengunet al., 2004 Re-construction of patri- and matri-lineages of Samaritans and other Israeli populations from Y-chromosome and mitochondrial DNA sequence variation. Hum. Mutat.24:248–260.
Shen, P., A. E. Hirsh, T. Kivisild, B. Do, S. Songet al., 2005 Pop-ulation genetic implications from 103 pairs of globally represen-tative Y-chromosome and mitochondrial DNA sequences. Am. J. Hum. Genet. (in press).
Stringer, C. B., and P. Andrews, 1988 Genetic and fossil evidence for the origin of modern humans. Science239:1263–1268. Tamura, K., and M. Nei, 1993 Estimation of the number of
nucle-otide substitutions in the control region of mitochondrial DNA in humans and chimpanzees. Mol. Biol. Evol.10:512–526. Tanaka, M., and T. Ozawa, 1994 Strand asymmetry in human
mi-tochondrial DNA mutations. Genomics22:327–335.
Tanaka, M., V. M. Cabrera, A. M. Gonzalez, J. M. Larruga, T. Takeyasu
et al., 2004 Mitochondrial genome variation in eastern Asia and the peopling of Japan. Genome Res.14:1832–1850.
alignment through sequence weighting, position-specific gap penalties and weight matrix choice. Nucleic Acids Res. 22:
4673–4680.
Torroni, A., T. G. Schurr, M. F. Cabell, M. D. Brown, J. V. Neel
et al., 1993 Asian affinities and continental radiation of the four founding Native American mtDNAs. Am. J. Hum. Genet. 53:
563–590.
Torroni, A., K. Huoponen, P. Francalacci, M. Petrozzi, L. Morelli
et al., 1996 Classification of European mtDNAs from an analysis of three European populations. Genetics144:1835–1850. Torroni, A., C. Rengo, V. Guida, F. Cruciani, D. Sellittoet al.,
2001 Do the four clades of the mtDNA haplogroup L2 evolve at different rates? Am. J. Hum. Genet.69:1348–1356. Underhill, P. A., P. Shen, A. A. Lin, L. Jin, G. Passarinoet al.,
2000 Y chromosome sequence variation and the history of human populations. Nat. Genet.26:358–361.
Watson, E., P. Forster, M. Richardsand H. J. Bandelt, 1997 Mito-chondrial footprints of human expansions in Africa. Am. J. Hum. Genet.61:691–704.
White, T. D., B. Asfaw, D. DeGusta, H. Gilbert, G. D. Richards
et al., 2003 Pleistocene Homo sapiens from Middle Awash, Ethiopia. Nature423:742–747.
Yang, Z., 2002 Likelihood and Bayes estimation of ancestral popu-lation sizes in hominoids using data from multiple loci. Genetics
162:1811–1823.
Yang, Z., and R. Nielsen, 2002 Codon-substitution models for detecting molecular adaptation at individual sites along specific lineages. Mol. Biol. Evol.19:908–917.
Yao, Y.-G., Q.-P. Kong, H.-J. Bandelt, T. Kivisildand Y.-P. Zhang, 2002 Phylogeographic differentiation of mitochondrial DNA in Han Chinese. Am. J. Hum. Genet.70:635–651.