Performance
Analysis of Data Mining
Classification Techniques
Tejas Mehta 1, Dr. Dhaval Kathiriya 2
Ph.D. Student, School of Computer Science, Dr. Babasaheb Ambedkar Open University, Gujarat, India1
Principal & Dean, College of Agricultural Information Technology, Anand Agricultural University, Gujarat, India2
ABSTRACT: Data mining is the process of analyzing data from large dataset and transforms it into an understandable structure using data mining techniques. In this research, we use some major classification techniques like Bayesian networks, Artificial Neural Network, K-nearest neighbor and decision tree for our experiment. The goal of this study is to provide comparison of experimental result for different data mining classification techniques.
KEYWORDS: Data Mining, Data Mining Classification Techniques, Naïve Bayes, Artificial Neural Network (ANN), K-Nearest Neighbors (KNN), Decision Tree.
I. INTRODUCTION
We are in information age, and we need a robust analytical mechanism to find and understand useful information from the large amount of collected data. Knowledge Discovery in Databases (KDD) helps us to transform low-level data into high-level knowledge for decision making. Data mining is the process of analysing data from large dataset and transforms it into an understandable structure using machine learning methods. The rest of paper is organized as follows: Section 2 describes literature review of data mining methods. Section 3 explains various types of data mining classification techniques. Section 4 contains implementation details. Section 5 summarizes the comparison of different data mining technique and algorithms results. Conclusion is shown in section 6, while references are mentioned in the last section.
II. DATA MINING METHODS
The two high-level primary goals of data mining in practice tend to be prediction and description and, it can be achieved using a variety of particular data-mining methods (Fayyad, Piatetsky-Shapiro, & Smyth, FALL 1196). Data mining involves six common classes of tasks:
1. Anomaly detection: Anomaly detection refers to the problem of finding patterns in data that do not conform to expected behaviour. (Chandola, Banerjee, & Vipin, 2009) discussed different ways in which the problem of anomaly detection has been formulated, and provide an overview of the huge literature on various techniques. 2. Association rule learning: It is a method for discovering interesting relations between variables in large databases.
(Agrawal, Imieliński, & Swami, 1993) present an efficient algorithm that generates all significant association rules between items in the database. The algorithm incorporates buffer management and novel estimation and pruning techniques.
ISSN(Online) : 2319-8753 ISSN (Print) : 2347-6710
I
nternational
J
ournal of
I
nnovative
R
esearch in
S
cience,
E
ngineering and
T
echnology
(An ISO 3297: 2007 Certified Organization)
Vol. 5, Issue 3, March 2016
4. Classification: Classification algorithm used to maps input data to a category. It implements classifier represented in various forms, such as classification rules, decision trees, mathematical formulas or neural networks (Jiawei, Micheline, & Jian, Data Mining : Concepts and Techniques, 2012)
5. Regression: Regression is a machine learning technique used to fit an equation to a dataset. Linear regression uses the formula (y = mx + b) of a straight line and determines the appropriate values for m and b to predict the value of y based upon a given value of x.
6. Summarization: providing a more compact representation of the data set, including visualization and report generation.
III.DATA MINING CLASSIFICATION TECHNIQUES
Data mining is a wide area that integrates techniques from various fields including machine learning, artificial intelligence, statistics and pattern recognition.
1. Naïve Bayes classifier: This Classification is named after Thomas Bayes(1702-1761), who proposed the Bayes Theorem. It provides a simple approach, with clear semantics, to representing and learning probabilitistic knowledge. It is termed naïve because is relies on two important simplifying assumes that the predictive attributes are conditionally independent given the class, and it posits that no hidden or latent attributes influence the prediction process. Naive Bayes classifiers can be trained very efficiently in a supervised learning setting to solve diagnostic and predictive problems. (Rish, 2001) explained the data characteristics which affect the performance of Naïve Bayes. Naive Bayes is known to outperform even highly sophisticated classification methods.
Bayes theorem provides a way of calculating posterior probability P(c|x) fromP(c),P(x), and P(x|c). Look at the equation below:
P(c|x) = P(x|c)P(x) P(c)
P(c|x) = P(x |c) × P(x |c) × … .× P(x |c) × P(c) Where,
P(c|x) is a posterior probability of class (c, target) given predictor (x, attributes). P(c) is a prior probability of class.
P(x|c) is a likelihood which is the probability of predictor given class. P(x) is a prior probability of predictor.
Fig: 1 Multilayer Perceptron Architecture
Minimum of 3 layers (input, hidden and output) are required but we can use as many hidden layers as per requirement.
3. K-nearest neighbors: It is an instance-based classifier. It operates on the premises that classification of unknown instances can be done by relating the unknown to the known according to some distance or similarity function (N.S., 1992). The insight is that two instances far apart in the instance space defined by the appropriate distance function are less likely than two closely situated instances to belong to the same class. It is a simple algorithm which classifies new cases based on a similarity measure. A case is classified by a majority vote of its neighbors, with the case being assigned to the class most common amongst its K nearest neighbors measured by a distance function (Table 1).
Euclidean Distance Function ( − )
Manhattan Distance Function | − |
Minkowski Distance Function (| − |)
Table.1 Distance Function
ISSN(Online) : 2319-8753 ISSN (Print) : 2347-6710
I
nternational
J
ournal of
I
nnovative
R
esearch in
S
cience,
E
ngineering and
T
echnology
(An ISO 3297: 2007 Certified Organization)
Vol. 5, Issue 3, March 2016
vector( ,, ,, … , ,), where the represent attribute values or features of the sample, as well as the class in which falls.
This algorithm has a few base cases.
All the samples in the list belong to the same class. When this happens, it simply creates a leaf node for the decision tree saying to choose that class.
None of the features provide any information gain. In this case, C4.5 creates a decision node higher up the tree using the expected value of the class.
Instance of previously-unseen class encountered. Again, C4.5 creates a decision node higher up the tree using the expected value.
In pseudo code, the general algorithm for building decision trees (Kotsiantis, 2007) is: 1. Check for base cases
2. For each attribute a
i. Find the normalized information gain ratio from splitting on a 3. Let a_best be the attribute with the highest normalized information gain 4. Create a decision node that splits on a_best
5. Recur on the sub lists obtained by splitting on a_best, and add those nodes as children of node
IV.IMPLEMENTATION DETAILS
The building of a classification process model can be broken down into four major components 1. Selection of Classification Technique
2. Data pre-processing 3. Training
4. Evaluation or Testing.
This study used iris data file as input for classification analysis. This file is downloaded from uci repository (https://archive.ics.uci.edu/ml/datasets/Iris). The data set contains 3 classes of 50 instances each, where each class refers to a type of iris plant.
@RELATION iris
@ATTRIBUTE sepallength REAL @ATTRIBUTE sepalwidth REAL @ATTRIBUTE petallength REAL @ATTRIBUTE petalwidth REAL
@ATTRIBUTE class {Iris-setosa,Iris-versicolor,Iris-virginica} @DATA
5.1,3.5,1.4,0.2,Iris-setosa 4.9,3.0,1.4,0.2,Iris-setosa …
Weka Interface: Weka is a collection of machine learning algorithms for data mining tasks (Bouckaert, 2013) . We used WEKA 3-6-10(Waikato Environment for Knowledge Analysis) open source data mining tool for experiment.
Fig.2 Weka Preprocess Panel
V. RESULT COMPARISON
In this study, we examine the performance of different classification methods for its accuracy and error.
Classification Algorithm Class Instances Classified as
Iris-setosa Iris-versicolor Iris-virginica
Naïve Bayes (Bayes Theorem)
a = Iris-setosa 50 0 0
b = Iris-versicolor 0 48 2
c = Iris-virginica 0 4 46
Multilayer Perceptron (Artificial Neural Network)
a = Iris-setosa 50 0 0
b = Iris-versicolor 0 48 2
c = Iris-virginica 0 2 48
k-Nearest Neighbor (k-NN)
a = Iris-setosa 50 0 0
b = Iris-versicolor 0 47 3
c = Iris-virginica 0 4 46
C 4.5(J48) (Decision Tree)
a = Iris-setosa 49 1 0
b = Iris-versicolor 0 47 3
c = Iris-virginica 0 2 48
ISSN(Online) : 2319-8753 ISSN (Print) : 2347-6710
I
nternational
J
ournal of
I
nnovative
R
esearch in
S
cience,
E
ngineering and
T
echnology
(An ISO 3297: 2007 Certified Organization)
Vol. 5, Issue 3, March 2016
As we can see from Table 2, almost all data mining algorithm perform best to classify instance in correct class. Multilayer Perceptron has only 4 incorrectly classified instances while other has 6 or 7 incorrectly classified instances out of all 150 instances.
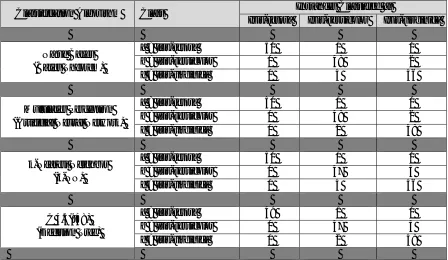
Classification Algorithm Correctly Classified Incorrectly Classified Relative Absolute Error Instances Per% Instances Per%
Naïve Bayes
(Bayes Theorem) 144 96.00 % 6 4.00 % 7.6997 %
Multilayer Perceptron
(Artificial Neural Network) 146 97.33 % 4 2.67 % 7.3555 % k-Nearest Neighbor
(k-NN) 143 95.33 % 7 4.67 % 9.1812 %
C 4.5(J48)
(Decision Tree) 144 96.00 % 6 4.00 % 7.8705 %
Table 3. Result Comparison of Data Mining Algorithm
According to Table 3, we can clearly see the highest accuracy is 97.33% belongs to Multilayer Perceptron (Artificial Neuron Network) and lowest accuracy is 95.33% that belongs to k-Nearest Neighbor (k-NN).
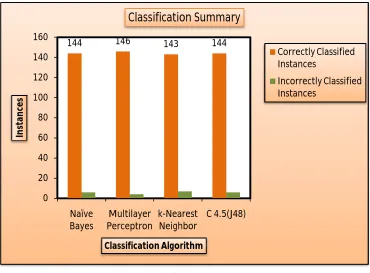
We have two charts to demonstrate classification summary and prediction accuracy of our study.
Fig.3 Distribution of Instance
Figure 3 shows classification summary for various algorithm used in study. It shows correctly classified instances and incorrectly classified instances in chart. Multilayer Perceptron has highest number of 146 correctly classified instances.
144 146 143 144
0 20 40 60 80 100 120 140 160
Naïve Bayes
Multilayer Perceptron
k-Nearest Neighbor
C 4.5(J48)
In
st
an
ce
s
Classification Algorithm
Classification Summary
Correctly Classified Instances
Fig.4 Prediction Accuracy
Figure 4 shows comparison chart of prediction accuracy of data mining algorithm. Multilayer Perceptron has highest number of 146 correctly classified instances.
VI. CONCLUSION AND FUTURE DIRECTION
We have compared the performance of various classifiers for iris data set in experiment. The goal of this study is to evaluate and investigate classification algorithms based on WEKA. The best algorithm in WEKA for our dataset is Multilayer Perceptron classifier (ANN) with an accuracy of 97.33%. These results prove that machine learning algorithm System has the potential to significantly improve over the conventional classification methods. In future, it is possible to improve efficiency of classification technique with Filter and wrapper approaches and combination of classification techniques.
REFERENCES
[1] Agrawal, R., Imieliński, T., & Swami, A. (1993). Mining association rules between sets of items in large databases. ACM SIGMOD international conference on Management of data (pp. 207-216 ). New York: ACM.
[2] Bouckaert, R. R. (2013, July 31). WEKA Manual for Version 3.6.9. Hamilton, New Zealand: University of Waikato.
[3] Chandola, V., Banerjee, A., & Vipin, K. (2009). Anomaly detection: A survey. ACM Computing Surveys, 41 (3).
[4] Fayyad, U., Piatetsky-Shapiro, G., & Smyth, P. (FALL 1196). From Data Mining to Knowledge Discovery in Databases. AI Magazine, 17 (3).
[5] Haykin, S. (n.d.). FeedForward Neural Networks: An Introduction.
[6] Jiawei, H., & Micheline, K. (2006). Data Mining Concepts and Techniques. New York: Morgan Kaufmann Publishers.
[7] Jiawei, H., Micheline, K., & Jian, P. (2012). Data Mining : Concepts and Techniques (3rd ed.). USA: Morgan Kaufmann Publishers.
[8] Kotsiantis, S.B., Supervised Machine Learning: A Review of Classification Techniques, Informatica 31(2007) 249-268, 2007
[9] N.S. , Altman(1992). An Introduction to Kernel and Nearest-Neighbor Nonparametric Regression. The American Statistician, 46 (3), 175-185.
[10] Rish, I. (2001). An empirical study of the naive Bayes classifier. IBM Research Division.
[11] Quinlan, J.: C4.5: Programs for Machine Learning. Morgan Kaufmann, San Mateo (1993)
96.00%
97.33%
95.33% 96.00%
90.00% 91.00% 92.00% 93.00% 94.00% 95.00% 96.00% 97.00% 98.00% 99.00% 100.00%
Naïve Bayes Multilayer Perceptron
k-Nearest Neighbor
C 4.5(J48)
P
re
d
ic
ti
o
n
P
e
r%
Classification Algorithm