DOI: 10.1051/epjconf/20122601029 c
Owned by the authors, published by EDP Sciences, 2012
Measurement of deforming mode of lattice truss structures under
impact loading
J. Liu
1, S. Pattofatto
2, and H. Zhao
1,a1Laboratoire de M ´ecanique et Technologie de Cachan, 61 avenue du Pr ´esident Wilson, 94230 Cachan,
France
2SNECMA-Site de Villaroche, Rond-Point Ren ´e Ravaud, 77550 Moissy-Cramayel, France
Abstract. Lattice truss structures, which are used as a core material in sandwich panels, were widely investigated experimen-tally and theoretically. However, explanation of the deforming mechanism using reliable experimental results is almost rarely reported, particularly for the dynamic deforming mechanism. The present work aimed at the measurement of the deforming mode of lattice truss structures. Indeed, quasi-static and Split Hopkinson Pressure Bar (SHPB) tests have been performed on the tetrahedral truss cores structures made of Aluminum 3003-O. Global values such as crushing forces and displacements between the loading platens are obtained. However, in order to understand the deforming mechanism and to explain the observed impact strength enhancement observed in the experiments, images of the truss core element during the tests are recorded. A method based on the edge detection algorithm is developed and applied to these images. The deforming profiles of one beam are extracted and it allows for calculating the length of beam. It is found that these lengths diminish to a critical value (due to compression) and remain constant afterwards (because of significant bending). The comparison between quasi-static and impact tests shows that
the beam were much more compressed under impact loading, which could be understood as the lateral inertia effect in dynamic
bucking. Therefore, the impact strength enhancement of tetrahedral truss core sandwich panel can be explained by the delayed buckling of beam under impact (more compression reached), together with the strain hardening of base material.
1 Introduction
Cellular materials (such as honeycomb, foam and hollow sphere agglomerate) combining both lightweight and high energy absorbing capacity are widely used in various industrial areas, such as automobiles, naval vehicles, air-crafts [1]. Sandwich panel containing honeycomb cores is one kind of superior material comparing with stochastic foams, like CYMAT foams and Alporas foams. However, most commercial honeycomb core panels are difficult to fabricate into complex curved shapes because of induced anticlastic curvature, and they also trap moisture leading to internal corrosion and facesheet debonding due to their close-cell structure (indicated by Sypeck 2005 [2]). With the development of manufacturing techniques, lattice truss cores structures like triangular or pyramidal truss core topologies attracted a lots of attentions of researchers in last decade. As an open cell periodic structure, lattice truss core structure can exploit to multifunctional applications, for example, heat exchange media [3]. It can also decrease the relative density of the structures to several percents. Therefore, lattice truss core structure is supposed to be a promising substitute.
Lots of theoretical prediction works on the mechani-cal responses of lattice truss cores structures were done in the last decade [4, 5]. The manufacture methods and mechanical behaviors were comprehensively reviewed by Wadley [6] in 2006; while Zok et al. [7] performed the transverse compression, in-plane shear and stretch on 304 stainless pyramidal truss cores, and then established an orthotropic constitutive law for the core. All the works above are concentrated in the quasi-static responses of
ae-mail:[email protected]
these materials. In dynamic aspects, the mitigation of blast wave [8–11] and ballistic perforation [12] were conducted theoretically, experimentally and even numerically. They revealed the dynamic response of the whole sandwich panel. However, to understand thoroughly the dynamic behavior of lattice truss core structures and establish the constitutive model of these structures, the response of the single core under impact is obligatory.
Lee et al. [13] executed a comprehensive research on pyramidal truss core under various strain rate from 10−3s−1(quasi-static) to 102–103s−1(Hopkinson bar), and up to 104s−1 (gas gun). However, they also limited only to the phenomenal behavior of the structure (the overall response under out-of-plane compression). In this paper, quasi-static and dynamic compressive experimental tests on the tetrahedral truss core made from rate insensitive Al3003-O are performed. With the digital images analysis, the failure mechanism of lattice truss core structure is highlighted.
2 Material and method
2.1 Manufacture of tetrahedral truss core material
The specimen is composed of two face sheets and the cores sandwiched between these sheets. The core com-prises three struts or beams which cross together as a regular tetrahedron (as shown in figure 1) with the beams 15.31mm in length, 2 mm in width and 1 mm in thickness. The height of the core is then 12.5 mm while the thickness of the face sheets is 1 mm. The relative density of the core is thus 3.6%.
w t l
60°
l h
Fig. 1.The tetrahedral truss core specimen.
0 0.01 0.02 0.03 0.04 0.05 0.06 0
20 40 60 80 100 120
Strain
Stress(MPa)
˙
ε= 4×10⁻⁴s−1
˙
ε= 80s−1
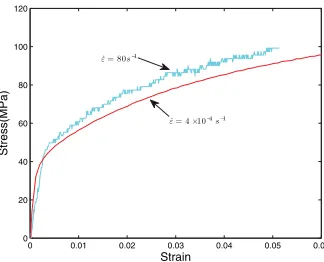
Fig. 2.Measured quasi-static and dynamic uniaxial response of aluminum 3003-O.
The specimens both the face sheets and the cores are manufactured from aluminum 3003-O with density 2730 Kg/m3. The quasi-static and dynamic uniaxial tensile experiments of the base material have been performed on Instron 5882 testing system and 10 mm diameter Hopkinson tensile bars separately.
In the uniaxial tensile testing, especially the dynamic tensile tests, the specimen can’t be clamped absolutely firmly. During loading, the grips will always slip over the specimen surface where it’s clamped. As a result, the strains measured with the traditional method (strain gages in Hopkinson bar and directly given by testing system) are not accurate. To overcome this drawback, a digital image correlation method (CorreliQ4 [14] programed by LMT-Cachan) is applied to the images shot during testing to measure the strain in the specimen. Assuming the deforming state is homogeneous, and then the average strain is contributed to the stress-strain curve.
As shown in figure 2, the strain rate effect of aluminum is not obvious in the range of 6 orders (from 10−4s−1 to 102s−1). Meanwhile, the stress-strain curve of aluminum 3003-O manifests strong strain hardening capacity. When the strain increases to 3% the strength increases to two times of the yield strength.
2.2 Experimental set-up
The quasi-static compression tests are performed on MTS 810 material testing system, which is a well-controlled technique. It provides that the suitable device is used
for the force measurement when the very weak foam-like material are tested. However, experimental techniques differ when the strain rate is important. Rapid hydraulic testing machine [15, 16] or falling weight arrangements [17, 18] are techniques often reported in the literature. Even those techniques can provide a suitable mechanical loading over large range of strain rates, the quality of the measuring approaches associated with those techniques decreases with the increase of strain rates. This is because they both assume an instantaneous equilibrium not only in the loading frame but also in the measuring device. This assumption neglects any wave propagation effect, which is very important in dynamic experiments. As a result, those measuring techniques begin to lose accuracy at medium strain rates ( ˙ε>50/s) and the special short loads cells have to be used. For the high strain rates ( ˙ε>200/s), it is very difficult to obtain reliable results using those devices.
The Split Hopkinson Pressure Bar (SHPB) is a widely used experimental technique to study the constitutive rela-tionship of materials in high strain rates [19, 20]. A typical SHPB is made of long input and output pressure bars with a short specimen sandwiched between them. The impact between the projectile and the input bar generates a compressive longitudinal incident pulseεi(t) in the input
bar. Once this incident pulse reaches the specimen-bar interface, one part is reflected as reflected pulseεr(t) in the
input bar and the other part transmitted as transmitted pulse
εt(t) in the output bar. With the gauges glued on the input
bar and output bar, one can record these three pulses, and then forces and velocities at both interface of the specimen are given by the following:
Finput=SBE(εi(t)+εr(t)), Fout put=SBE(εt(t))
and
Vinput=C0(εi(t)−εr(t)), Vout put=C0εt(t)
(1)
where SB,EandC0 denote cross sectional area, Young’s modulus and wave speed in the bar.
On the use of Hopkinson bar, one important assump-tion is the homogeneity of the specimen during loading. However, in most cases of soft materials with intense local-ized deformation, for example, the lattice truss cores struc-ture presented in this paper, the homogeneous assumption is not valid. Nevertheless, we introduce the output force as a function of the crush of the specimen∆(t) to give an overall idea of the behavior of the material tested, where the crush of the specimen is defined as:
∆(t)= t
0
(Vout put(τ)−Vinput(τ))dτ (2)
correction of this dispersion effect on the basis of a gener-alized Prochhammer’s wave propagation theory should be systematically performed in the data processing of wave shift [21, 22]. In practice, two 3 m long Nylon bars of 60 mm of diameter (density 1200 kg/m3and speed 1800 m/s) are used.
2.3 High speed photography
It is clear that the experimental setups, both standard material testing system and Hopkinson bar, allow only the measurement of the forces and displacement at the interfaces between the platens or the pressure bars and the specimen. Such measurements lead only the global de-scription (the force-crush displacement) of the specimen. However, the local crush mechanism is desired, which can’t be given by the experimental setup introduced above, then digital photography is applied to give a supplementary measurement.
Canon EOS 50D is used to record the deforming process of the lattice truss structure in quasi-static testing. In Hopkinson bar impact testing, the high-speed camera, Photron Fastcam SA5, is applied. A MCDL box is added to synchronize the Hopkinson bars results (force-crush displacement curve) with the images.
3 Experimental results
3.1 Overall experimental response
The specimen is loaded at the rate of 0.025 mm/s and about 12 m/s, which ensure the nominal strain rates (loading rate divided by the height of the core) are 2×10⁻³s−1 and 103s−1respectively.
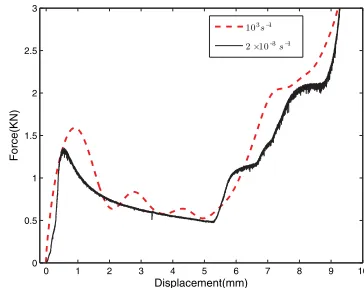
With the Eq. (1) and Eq. (2), the force/crush displace-ment curve under impact loading is obtained. The compar-ison with the quasi-static one is shown in figure 3. Both curves show a common property of lattice core structures, that is, the reaction of the structure is divided into three stages: before buckling, post-buckling and densification. In the first stage, the force increases as the crush displacement increases until the buckling happens, where the force reaches to the peak point. After the buckling happens, the force decreases rapidly. These two stages manifest the structural instability of beam network. The densification stage is commonly observed in many cellular materials, like honeycomb and metal foams. The unique feature of lattice truss core structure is the stair-like increase. This is because of the different contact time instants between the bended beam and the facesheets.
In figure 3, one interesting observation is that the peak force increase 20% from quasi-static loading to impact loading. While, as shown in figure 2, the base material doesn’t exhibit as much strain rate sensibility as the truss structure. It means that some other source contributes to the rate sensibility of the structure. One possible source is the lateral inertia effect.
As indicated by Calladine and English [23] in 1984 and also by Su and Yu [24] in 1995, lateral inertia plays
0 1 2 3 4 5 6 7 8 9 10
0 0.5 1 1.5 2 2.5 3
Displacement(mm)
Force(KN)
103s−1
2×10⁻³s−1
Fig. 3.Comparison of the force/crush displacement under quasi-static loading and impact loading.
a dominant role in the impact problems. Under quasi-static loading, the deformation of the structure predominated by the rotation of plastic hinges. If it’s the same in dynamic loading, large transverse speed must reach very soon after the instant of impact to make geometrical compatibility between the structure and the loading end. However, this is not admissible to reach a certain speed in a sudden because it disobeys the laws of mechanics. The mass in the buck-ling point needs time to be accelerated to a speed which matches the loading speed. Thorefore, the buckling of the beam doesn’t occur and the beam keeps relatively straight until the mass in the center is accelerated. This is so-called lateral inertia protection. While during the acceleration pe-riod, the compression in longitudinal direction continues, Therefore, the compressive strain reached before collapse under impact loading is therefore higher than in the quasi-static case. In cellular materials, lateral inertia effect was proved to be a key factor of their mechanical responses as well. Zhao et al. [25] pointed that the peak force increase in rate insensitive brass tube is caused by the inertia effect associated with the strain hardening of brass. In our case, the base material Al3003-O is a rate insensitive but with a high strain hardening capacity. Then the increase of peak force is assumed to be probably the result of lateral inertia. In next section, image analysis will be used to prove this.
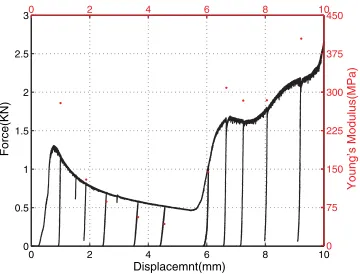
Following the theoretical prediction formulae [4, 6], the out-of-plane Young’s modulus of the tetrahedral core structure sandwich panel (Ecore) is proportional to relative
density ( ¯ρ) of the core:
Ecore=Essin4 ωρ¯ (3)
where Es is the Young’s modulus of the base material,
0 2 4 6 8 10 0
0.5 1 1.5 2 2.5 3
Displacemnt(mm)
Force(KN)
0 2 4 6 8 10
0 75 150 225 300 375 450
Young’s Modulus(MPa)
Fig. 4. The quasi-static loading-unloading process: the black curve and the left Y-axis indicate the load; the red points and the right Y-axis indicate the value of Young’s modulus.
Modulus were proportional to the forces when unloading occurred.
3.2 Digital images analysis
During quasi-static loading, Canon EOS 50D is used in the acquisition frequency 0.33 fps (one image in 3 second). During impact loading, high speed camera Photron SA5 is used to shoot the images of 384×160 pixels at 100 000 fps. The use of high speed camera should require much atten-tion to take the images clearly. In order to make the images not blur, the shutter speed is set to very high value, here, 1/151000 s is used. Two high powerful cold-light spotlights are used to provide enough light in high shooting speed and high shutter speed.
By synchronization, the images of the specimen during both quasi-static and dynamic loading are shown figure 5. It compares the deforming states of only one core in the 6 cores specimen at nearly the same crush displacements. The nominal strains labeled on the right of the images are approximations, because it’s impossible to find the images from both quasi-static and dynamic loading with the exact crush displacement. From this figure, it’s difficult to find whether there is a difference in the deforming mode, because the beams exhibit the same shapes in each crush displacement. What has to be added is that, in repetitive experiments, the two beams in the same plane (the left two beams in each images in figure 5) bend exactly the same, away from or near to the other single beam in the same core. There are four possible combinations of the bending direction in one core (two possible directions of the two beams in the same plane multiply the two possibilities of the other single beam), and in fact the force/crush curves have no obvious differences in no matter which combination.
Even though we can’t find obvious differences in different loading cases, the peak force enhancement indeed exists. Meanwhile, the lateral inertia effect introduced above can’t not influence too much the deforming state of beam. However, the direct result of inertia effect is larger shortening of the beam, that is the strain on the beam. With the development of digital image correlation method, the full field measurement of strain on the surface of material tested becomes realizable. Unfortunately, in the
Quasi-static Dynamic
0%
5.4%
8.5%
15%
22%
Fig. 5.Comparison of deforming states between quasi-static and dynamic loading at different nominal strain.
high shooting speed during impact loading, the resolution of image is limited. Due to the small thickness of the beam, only 7 pixels are located on the beam. It’s not enough to get reliable result by DIC method.
Fig. 6.The extraction of beam deforming profile during impact test.
0 5 10 15 20 25 30 35 40 45 50
79.5 80 80.5 81 81.5 82 82.5 83 83.5 84 84.5
Images
Length (Pixels)
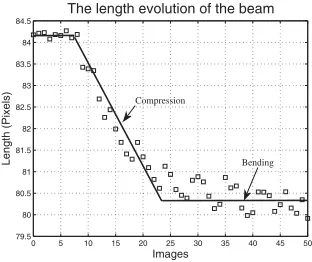
The length evolution of the beam
Compression
Bending
Fig. 7.Beam length evolutions during impact test.
length of beam can be calculated with the knowledge of the deforming profile, see in figure 7. It is found that the length reduces rather linearly at the early stage and stay nearly constant afterward. Such a measurement can be interpreted as the compression of the beam is rather constant at early stage of loading before the bending becomes dominant.
It’s clear that the image shooting angle will influence the shapes of beam in the image and also the absolute lengths of beam exposed to observer, and also due to the difficulty in manipulating the exact same shooting angle in different tests, the absolute lengths is not comparable. Therefore a non-unit value, strain in axial direction, which is defined as the current length divided by original length of beam, is introduced to compare between quasi-static loading and dynamic loading. When the crush arrives 1.2 mm, the quasi-static axial strain is 1.4% while the impact one is 3.4%, shown in figure 8. The more compression under dynamic loading proves the existence of lateral inertia effect. With the increase in the axial strain in the beam, the strength of base material increases 30%, which cause the increase of the peak force shown in figure 3. Considering that the different imperfections of the beams in the specimen will lead different buckling instant, thereupon, decrease the initial peak force, the 20% strength increase of the specimen but 30% increase of the base material is relatively acceptable.
Now, with the knowledge of more compressed of beam under impact loading from the image analysis, we conclude that the strength increase of the truss core struc-ture during dynamic loading is caused by the
combina-0 0.2 0.4 0.6 0.8 1 1.2 1.4 1.6 −0.02
−0.015 −0.01 −0.005 0 0.005 0.01
Crush displacement (mm)
Axial strain
0 0.5 1 1.5 2 2.5 3 3.5 4 −0.05
−0.04 −0.03 −0.02 −0.01 0 0.01
Crush displacement (mm)
Axial strain
(a) Static
(b) Dynamic
Fig. 8. The axial strain evolutions in quasi-static loading and impact loading.
tion of the lateral inertia effect of the structures and the strong strain hardening capability of Al3003-O (the base material).
4 Summary
The out-of-plane compressive behavior of lattice truss core structure was investigated under the nominal strain rate about 2 ×10⁻¹s−1 and 103s−1. The increase of initial peak force was observed by comparing the force/crush curve, which is supposed to be dominated by the lateral inertia effect. Digital cameras were applied to record the real time deformation of the specimen. With the digital images analysis, the deforming profile of the beam was extracted. Furthermore, the introduction of a non-unit value, axial strain, gives a credible comparison between different loading cases. It was found that the beam was more compressed under the impact loading, which is an evidence of the existence of lateral inertia.
References
1. L.J. Gibson, M.F. Ashby, Cellular Solids: Structure and Properties, 2ed (Cambridge University Press, Cambridge, 1997)
2. D.J. Sypeck, Appl. Compos. Mater. 12, (2005) 229-246
3. D.J. Sypeck, Metall. Trans. B36, (2005) 125-131 4. V.S. Deshpande, N.A. Fleck, Int. J. Solids Struct.38,
(2001) 6275-6305
6. H.N.G. Wadley, Phil. Trans. R. Soc. A364, (2005) 31-68
7. F.W. Zok, S.A. Waltner, Z. Wei, H.J. Rathbun, R.M. McMeeking, A.G. Evens, Int. J. Solids Struct. 41, (2004) 6249-6271
8. J. Hutchinson, Z. Xue, Int. J. Mech. Sci.47, (2005) 545-569
9. N.A. Fleck, V.S. Deshpande, J. Appl. Mech. 71, (2004) 386-401
10. K.P. Dharmasena, D.T. Queheillalt, H.N.G. Wadley, P. Dudt, Y. Chen, D. Knight, A. G. Evans, Eur. J. Mech. A. Solids29, (2010) 56-67
11. X.D. Cui, L. M. Zhao, Z.H. Wang, H. Zhao, D.N. Fang, Int. J. Impact Eng,43, (2012) 1-5
12. C.J. Yungwirth, H.N.G. Wadley, J.H. O’Connor, A.J. Zakraysek, V.S. Deshpande, Int. J. Impact Eng. 35, (2008) 920-936
13. S. Lee, F. Barthelat, J.W. Hutchinson, H.D. Espinosa, Int. J. Plast.22, (2006) 2118-2145
14. Exp. Mech.46, (2006) 789-803
15. J.D. Rehkopf, G.M. Mcneice, G.W. Borland, J. Eng. Mater. Technol.118, (1996) 58-62
16. F.S. Chang, Y. Song, D.X. Lu, C.N. Desilva, J. Eng. Mater. Technol.120, (1998) 212-217
17. H.L. Schreyer, Q.H. Zuo, A.K. Maji, J. Eng. Mech. 120, (1994) 1913-1930
18. O. Faruque, N. Liu, C. Chou, SAE Technical Paper 971076 (1997)
19. B. Hopkinson, Philos. Trans. Of the Royal Soc. Of London213, (1914) 437-456
20. H. Kolsky, Proc. Phys. Soc. B 62, (1949) 676-700
21. R.M. Davies, Philos. Trans. Of the Royal Soc. Of London. B240, (1948) 375-457
22. H. Zhao, G. Gary, J. Mech. Phys. Solids.43, (1995) 1335-1348
23. C.R. Calladine, R.W. English, Int. J. Mech. Sci. 26, (1984) 689-701
24. X.Y. Su, T.X. Yu, S.R. Reid, Int. J. Impact Eng. 16, (1995) 651-672
25. H. Zhao, S. Abdennadher, Int. J. Solids Struct. 41, (1994) 6677-6697