Article
Mesoscale Resolution Radar Data Assimilation
Experiments with the Harmonie Model
Serguei Ivanov 1,*, Silas Michaelides 2 and Igor Ruban 1
1 Odessa State Environmental University (OSENU), Odessa, Ukraine; [email protected]; [email protected]
2 The Cyprus Institute, Nicosia, Cyprus; [email protected]
* Correspondence: [email protected]; Tel.: +38-050-631-3655
Abstract: This study presents a pre-processing approach adopted for the radar reflectivity data assimilation and results of simulations with the Harmonie numerical weather prediction model. The method shows an improvement of precipitation prediction within the radar location area in both the rain rates and spatial pattern presentation. With the assimilation of radar data, the model simulates larger water content in the middle troposphere within the layer from 1 to 6 km, with major variations at 2.5–3 km; it also reproduces better the mesoscale belt and cell patterns of precipitation fields.
Keywords: Harmonie model; radar data assimilation; pre-processing; mesoscale precipitation patterns
1. Introduction
Precipitation plays an important role in both the water cycle and energy balance of the atmosphere. However, due to the high spatial and temporal variability of precipitation in the mesoscale, obtaining accurate quantitative precipitation estimates is still a “first-line frontier” task. Moreover, the Global Precipitation Measurement (GPM) mission has shown notable differences in estimations of precipitation obtained from various platforms, especially for low rain rates [1]. Current rain-gauge networks mainly suffer from sparse distribution and limited coverage [2]. Although satellite-based infrared and visible data have high spatial resolution, relations between the radiance from cloud and precipitation are indirect and non-unique [3]. Additionally, the evaluations of satellite quantitative precipitation estimates have some limitations in terms of the deficiency in the observations, the evaluation methodology, the selection of time windows for evaluation and the short periods for evaluation [4]. Passive microwave instruments provide acceptable estimates of precipitation; nevertheless, they exhibit low spatial and temporal resolution [5]. The ground-based radar network in Europe is heterogeneous in terms of hardware, signal processing, transmission and reception frequencies and scanning strategy.
The Operational Program for Exchange of Weather Radar Information (OPERA) was launched for improving the harmonization of radars and their measurements [6]. The program provides three composite products, such as instantaneous surface rain rate, instantaneous maximum reflectivity and one-hour rainfall accumulation; gathered data includes three-dimensional volumes of reflectivity and radial wind. When assimilated in convection-permitting models, radar data could yield significant improvements in the representation of the spatial distribution of cloud and precipitation, as well as rain rates [7–9]. This is achieved due to the fact that ground-based radars have a high spatial and temporal resolution and cover large areas at different altitudes. It is worth noting that radar data are heterogeneously distributed, providing abundant information near radar
locations, while such information becomes sparser with increasing distance from the sensor. Further improvement of assimilation systems is seen in the optimization of pre-processing radar data in terms of homogenizing data coverage, along with increasing confidence in them by averaging stochastic errors.
The objective of this study is to present a pre-processing approach adopted for the radar reflectivity data assimilation and the results of simulations with the Harmonie numerical weather prediction model. Through a case study, it will be shown that the method can improve the prediction of precipitation within the radar location area, both in terms of the rain rates and spatial pattern presentation.
Methods of pre-processing are shortly presented in the following Section 2, in which the model and data used in this study are elaborated, also. Results of simulations with the proposed pre-processing approach are presented in Section 3. Section 4 presents some concluding remarks.
2. Materials and Methods
2.1. Pre-processing of radar data.
Although radars measure the reflectivity and radial wind, this study focuses at the former parameter only. Quality control and other extra technical procedures are also omitted, assuming that they have been performed at preliminary steps, namely, during initial processing of radar data. Further pre-processing is performed in different ways and may include various methods. Among these is the spatial screening of the raw data over some pixels in pursuit both, to reject abundant data and rid horizontal correlations in observation errors. The screening includes either filtering or smoothing procedures. The former is an easy way to routinely perform thinning of high-resolution radar data. Simple thinning of abundant radar observations throws a significant part of data out from the process, but also affects the spectral distribution of sub-scales finer than a thinning parameter. An alternative to the thinning is the averaging of observations within a given box to create a new value located at an averaged position. This also allows to average out random observation errors [10]. This method, called superobbing, is used for remote sensing observations, such as atmospheric motion vectors and Doppler radar radial wind measurements [11]. With this approach, the observation (O) minus background (B) differences (denoted as O – B) or innovations, are averaged. For each observation, its model simulated analogue is computed and an O – B innovation is calculated. These innovations are then averaged and added to the model observation closest to the center of the superobbing cell to provide the super-observation. Optimization of the superobbing processing from dense raw data is the compromise between the above two factors, namely, saving finer than averaging size scales, on one hand, and obtaining more stable estimates for remaining scales due to reducing stochastic errors, on the other hand [12]. Additionally, the problem of representativeness is necessary to be accounted for, while comparing and assimilating data from sources with different spatial resolutions. Experience with assimilating high-resolution data shows that such a data coverage may provide unsatisfactory results. In particular, tests with the Generalized Cross-Validation (GCV) method [13] using a simulated high-resolution data set at full resolution has led to a poorer analysis than a lower resolution data set that preceded it. The larger the nonconformity between the resolution of the observations network, on the one hand, and that of the model, on the other hand, the larger the numerical impact on the result or, equivalently, the larger the representativeness error.
measurements involved at each mesh box1. In short, the proposed method firstly creates a 3D
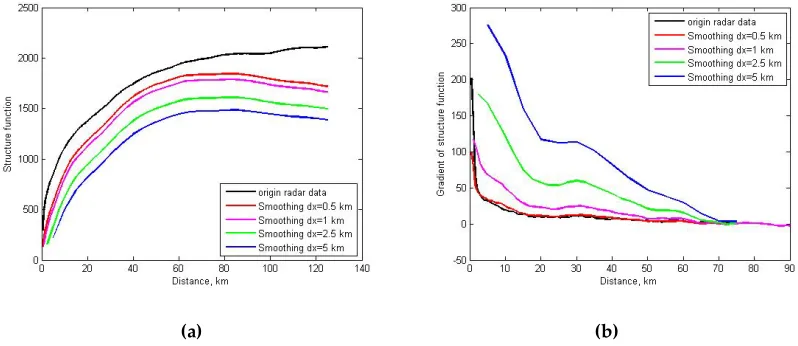
regular grid in which a horizontal size of meshes coincides with a horizontal model resolution. This should minimize the error associated with the discrepancy between resolutions of informational sources [15]. Structure functions for radar reflectivity from lower bins, which with certain assumption measure horizontal size and shape of precipitation patterns, are saturated at a few kilometer distance (Figure 1). Smoothing with 0.5 km yields very similar results, both in the value and behaviors of the gradient, as the original data. In particular, saturation of the structure functions occurs at the shortest lag of about 1 km, confirming the dominant role of mesoscales. Smoothing with the 2.5 and 5 km shows weaker gradients at smallest resolved scales, but also background (secondary) phenomena appear at the scales of about 20–30 km. This numerical (artificial) effect is one of the reasons leading to a systematic phase error in the modelling of precipitation [16]. All structure functions saturate above 60 km lag, where the large-scale circulation dominates.
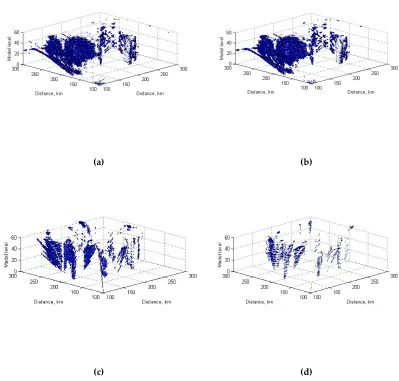
The other drawback even for complete radar data sets is that they fill-in only a part of the physical or model spaces. For instance, the six Finish radars used in this study cover from 5% to about 20% of a model grid, depending on the horizontal smoothing parameter and vertical factor at the pre-processing step (Figure 2). A vertical size for meshes can be chosen on the basis of several criteria. Among the most appropriate ones, are those which correspond either to a list of model levels or to homogeneous filling-in meshes by measurements. The former has too small step in lower layers, which does not allow filling-in most of the model meshes by radar measurements. So far, the latter approach seems ensuring better the homogeneous saturation of the model grid, and it was selected for further pre-processing. At least three direct impacts from pre-processing smoothing are obvious. Oversmoothing with the parameter larger than the model resolution leads to underestimating the total amount of water content; decreases small but intensive cells of precipitation; incorrectly presents spatial patterns of rain water in the atmosphere. To this end, these factors affect the initial conditions and disrupt the subsequent evolution of precipitation patterns. It is worth noting that, smoothing with 0.5 km yields reflectivity distributions similar to the original (Figure 2a).
(a) (b)
Figure 1. (a) Structure functions and (b) their gradients of radar reflectivity measurements for
original data and after pre-processing with various smoothing parameters.
1Averaging over a large number of measurements provides higher confidence for the value obtained, while
(a) (b)
(c) (d)
Figure 2. Filling-in the model grid by radar measurements depending on pre-processing smoothing
parameters: (a) 0.5 km; (b) 1 km; (c), 2.5 km; (d); 5 km.
2.2. Configuration of radar data assimilation experiments
Radar reflectivity data from the BaltEx experiment covering the Finnish domain were used in this study (www.baltex-research.eu). The project operates with high-quality data and has demonstrated to possess a significant value for forecasters and decision-makers. The Finnish domain was chosen due to several reasons. Firstly, a major part of the domain is covered by radar measurements, although their inhomogeneous distribution is a factual issue. Secondly, the smooth orography and relatively homogeneous surface significantly decrease a potential external impact from sharp gradients of the complex orography and surface contrasts.
the horizontal resolution equal to the model’s 2.5 km resolution. The second one (COARSE) explores the operationally implemented procedure based on double subsequent smoothing of the radar network with resolutions of 15 and 8 km, respectively [14].
3. Results of radar data assimilation
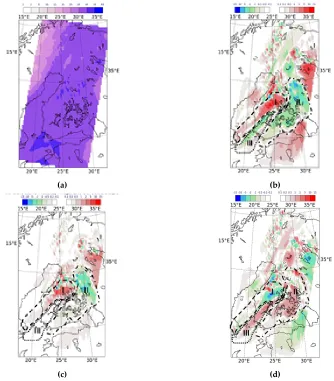
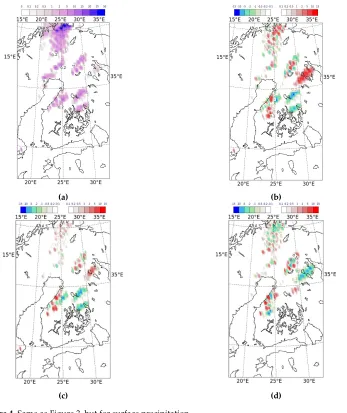
The results of the numerical experiments have revealed a noticeable impact of radar reflectivity data assimilated in the model on the prediction of precipitation patterns and rates. Moreover, it has been shown that this impact varies depending on pre-processing procedures and their corresponding parameters. Figure 3 shows the spatial distribution of precipitable water and its differences in experiments over the Finnish domain for 18:00 UTC 14 August 2010. This variable was chosen as it better pronounces continuous distribution of water in the atmosphere compared to the discrete form of surface precipitation (Figure 4). Although both variables reflect major features of spatial coverage, certain discrepancies can be associated with the resolution in radar data assimilation (RDA) formulations. In particular, both methods of RDA lead to redistribution of precipitation toward fine-scale cells within large areas accompanied by an enlarging of the area of increased precipitation, in total. The COARSE run provides larger amounts of precipitation than the FINE run. However, special attention would be paid to the South Finland area, where six radars (Anjalankoski, Ikaalinen, Korpo, Kuopio, Vantaa and Vimpeli) account for the dense three-dimensional coverage of the water content field in the atmosphere. Analysis shows a rather homogeneous field of precipitable water over this area (see Figure 3a). RDA allows to specify and redistribute precipitable water among several areas, as it is displayed in Figure 3. The first area is associated with the increased precipitation rate in both RDA runs (area I in Figures 3b and 3c), while the gain is sufficiently higher in the FINE run. This is reflected by the negative values in Figure 3d (COARSE-FINE runs). Over the second area (area II in Figures 3b and 3c), both RDA runs decrease the water content in the atmosphere, which is actually reallocated toward the first neighboring one. As in the previous site, changes are larger in the FINE run, which result in the area of positive values in Figure 3d. A belt of lower precipitable water amount in the FINE run corresponds to the third area (area III in Figures 3b and 3c), which however does not appear in the COARSE run.
(a) (b)
(c) (d)
Figure 3. Spatial distribution of precipitable water over the Finnish domain for 18:00 UTC 14 August
2010. (a) in analysis; and differences between runs: (b) FINE-CNTR; (c) COARSE-CNTR; (d) COARSE- FINE. Areas I, II and III outline specific regions in redistributing of precipitable water.
(a) (b)
(c) (d)
Figure 4. Same as Figure 3, but for surface precipitation.
4. Concluding remarks
The data assimilation system in the convection-permitting Harmonie model has been further developed by involving radar reflectivity measurements. The focus was on optimizing the inner parameters of the pre-processing procedures. In pursuing the compatibility between the model resolution and smoothed radar observation density, the “cube-smoothing” approach has been proposed. This shows better simulation of mesoscale cells and belts of precipitation. However, precise verification still remains an issue, due to several reasons, among them being the instrumental error and transient functions for radar measurements, as well as the dominating sizes of precipitation patterns in particular regions and under certain atmospheric flow regimes. The latter will be in the focus of further investigation.
Author Contributions: Serguei Ivanov contributed to the conceptualization, methodology, formal analysis,
investigation, and writing; Silas Michaelides contributed to the supervision, methodology, writing, review and editing; Igor Ruban contributed to the formal analysis, investigation and visualization.
Funding: This research received no external funding.
Acknowledgments: The research was realized under support of the Enviro-PEEX on ECMWF project. The
authors thank Dr Alexander Mahura (FMI), project principal investigator, for facilitating our involvement in the project and Dr Mats Dahlbom (DMI), the author of the preporepa.py script, for fruitful discussions.
Conflicts of Interest: The authors declare no conflict of interest.
References
1. Gao J.; Tang G. Similarities and Improvements of GPM Dual-Frequency Precipitation Radar (DPR) upon TRMM Precipitation Radar (PR) in Global Precipitation Rate Estimation, Type Classification and Vertical Profiling. Remote Sens. 2017, 9, 1142, doi:10.3390/rs9111142.
2. Ma Y.; Zhang, Y.; Yang D.; Farhan S. B. Precipitation bias variability versus various gauges under different climatic conditions over the Third Pole Environment (TPE) region. Int. J. Climatol. 2015, 35, 1201–1211, doi:10.1002/joc.4045.
3. Bellerby T.; Todd M.; Kniveton D.; Kidd, C. Rainfall estimation from a combination of TRMM precipitation radar and GOES multispectral satellite imagery through the use of an artificial neural network. J. Appl. Meteorol. 2000, 39, 2115–2128, doi: 10.1175/1520-0450(2001)040<2115:refaco>2.0.co;2.
4. Bai L.; Shi C.; Li L.; Yang Y.; Wu J. Accuracy of CHIRPS Satellite-Rainfall Products over Mainland China.
Remote Sens.2018, 10(3), 362, doi.org/10.3390/rs10030362.
5. Kidd C.; Bauer P.; Turk J.; Huffman G.; Joyce R.; Hsu K. -L.; Braithwaite D. Intercomparison of high-resolution precipitation products over Northwest Europe. J. Hydrometeorol. 2012, 13, 67–83, doi:10.1175/jhm-d-11-042.1.
6. Huuskonen A.; Saltikoff E.; Holleman I. The Operational Weather Radar Network in Europe. Bull. Am. Meteorol. Soc. 2014, 95, 897–907, doi:10.1175/BAMS-D-12-00216.1.
7. Ducrocq V.; Lafore J. -P; Redelsperger J. -L; Orain F. Initialization of a fine-scale model for convective-system prediction: A case study. Q. J. Roy. Meteor. Soc. 2000, 126, 3041–3065, doi:10.1256/smsqj.57003. 8. Ducrocq V.; Ricard D.; Lafore J.-P.; Orain F. Storm-scale numerical rainfall prediction for five precipitating
events over France: On the importance of the initial humidity field. Wea. Forecasting2002, 17, 1236–1256, doi:10.1175/1520-0434(2002)017<1236:ssnrpf>2.0.co;2.
9. Richard É.; Cosma S.; Tabary P.; Pinty J. -P.; Hagen M. High-resolution numerical simulations of the convective system observed in the Lago Maggiore area on the 17 September 1999 (Map IOP 2a). Q. J. Roy. Meteor. Soc.2003, 129, 543–564, doi:10.1256/qj.02.50.
10. Lorenc A. C. Analysis methods for numerical weather prediction. Q. J. Roy. Meteor. Soc. 1986, 112, 1177– 1194, doi:qj.49711247414.
12. Salonen K.; Järvinen H.; Haase G.; Niemelä S.; Eresmaa R. Doppler radar radial winds in HIRLAM. Part II: Optimizing the super-observation processing. Tellus 2009, 61A, 288 –295, doi:10.1111/j.1600-0870.2008.00381.x.
13. Desroziers G.; Ivanov S. Diagnosis and adaptive tuning of information error parameters in a variational assimilation. Q. J. R. Meteorol. Soc.2001, 127, 1433–1452, doi:10.1002/qj.49712757417.
14. Caumont O.; Ducrocq V.; Watterlot É.; Jaubert G.; Pradier-Vabre S. 1D+3DVar assimilation of radar reflectivity data: a proof of concept. Tellus2010, 62A, 173–187, doi:10.1111/j.1600-0870.2009.00430.x. 15. Ivanov S.; Palamarchuk J. Fine-scale precipitation structure of a cold front and the problem of the
representativeness error. Adv. Geosci.2007, 10, 3–8 doi:10.5194/adgeo-10-3-2007.
16. Ivanov S.; Simmer C.; Palamarchuk J.; Bachner S. The systematic error of precipitation and humidity in the MM5 model. Adv. Geosci. 2008, 16, 97–107, doi:10.5194/adgeo-16-97-2008.
17. Nogueira S. M. C.; Moreira M. A.; Volpato M. M. L. Evaluating Precipitation Estimates from Eta, TRMM and CHRIPS Data in the South-Southeast Region of Minas Gerais State—Brazil. Remote Sens.2018, 10(2), 313, doi:10.3390/rs10020313.
18. Tweedy D. L. Mesoscale precipitation patterns in extratropical cyclones and implications for cyclone development, J. Geophys. Res. Atmos.1990, 95, 1987–1997 doi:10.1029/jd095id03p01987.