© 2016, IJCSMC All Rights Reserved 1 Available Online atwww.ijcsmc.com
International Journal of Computer Science and Mobile Computing
A Monthly Journal of Computer Science and Information Technology
ISSN 2320–088X
IJCSMC, Vol. 5, Issue. 1, January 2016, pg.01 – 09
Determination and Classification of Interesting
Visitors of Websites using Web Logs
Shruthi Ramdas
1, Rithesh Pakkala P.
2, Akhila Thejaswi R.
31, 2, 3Assistant Professor, Department of Information Science & Engineering, Sahyadri College of Engineering & Management, Mangaluru, Karnataka, India
1
[email protected], 2 [email protected], 3
Abstract— The expansion of the World Wide Web has resulted in a large amount of data, hence extraction of useful
knowledge is a challenging research problem. Web mining makes use of data mining classification techniques to
automatically discover Web documents and services, extract information from Web resources, and uncover general patterns
on the Web for analyzing visitor activities in network-based systems. The objective of this paper is to classify the users into
interested or non interested for particular website based on their access pattern using web server log’s by making use of
decision tree classification technique. Web usage mining refers to the technique of extracting interesting patterns in Web
access logs and other Web usage information.
Keywords— Data mining, Interesting Patterns, Web Logs, Classification, Decision Tree
I. INTRODUCTION
A.
Web mining
Application of data mining techniques to the World Wide Web, referred to as Web mining. It aims at discovering and extracting
hidden information from Web documents and services. The common taxonomy of web mining defines three main research
lines:
Web Content mining is the data mining techniques to extract knowledge from web object contents including plain text,
semi-structured documents (e.g., HTML or XML), structured documents (digital libraries), dynamic documents,
© 2016, IJCSMC All Rights Reserved 2
Web Structure Mining refers to the technique of extracting knowledge from Internet links and organization and finding
the Underlying topology of the interconnections between web objects.
Web usage miningisthe application of data mining techniques for extracting interesting patterns in Web access logs
and other Web usage information. It consists of three phases:
Preprocessing Pattern discovery Pattern analysis
The three main phases of web log mining are
Preprocessing is converting the usage, content, and structure information contained in the various data sources into
the data abstractions.
Pattern Discovery draws upon methods and algorithms developed from several fields such as statistics, data
mining and pattern recognition.
Pattern Analysis refers to understanding the results obtained by the algorithms and drawing conclusions.
Data is usually collected from user's interaction with the web, e.g. web/proxy server logs, user queries, registration data.
Successful Web Log Mining must establish a need for analysis, specify information and objective requirements, data sources
and design sample, data and apply results. One of the techniques used in web log mining is classification, where a profile is
built for users belonging to given class or category.
II. METHODOLOGIES
A.
Bayesian NetworkBayesian classifiers are statistical classifiers. They can predict class membership probabilities, such as the probability that a
given tuple belongs to a particular class. Weakness is that it does not allow for categorical output attributes also problem centers
on the quality and extent of the prior beliefs used in Bayesian inference processing.
B. Neural Networks
Neural network is a set of connected input/output units in which each connection has a weight associated with it. It learns by
iteratively processing a data set of training tuples, comparing the network‟s prediction for each tuple with the actual known
targetvalue. The target value may be the known class label of the training tuple. Neural networks have been criticized for their
poor interpretability.
Neural network has the defects of complex structure, poor interpretability and long training time.
C. Nearest Neighbor Method
A technique that classifies each record in a dataset based on a combination of the classes of the k record(s) most similar to it
in a historical dataset (where k 1). Sometimes it also called as k-nearest neighbor technique. Nearest neighbor classifier are
based on learning by analogy that is by comparing a given test tuple with training tuples that are similar to it. When given an
unknown tuple, a k-nearest neighbor classifier searches the patterns space for the k training tuples that are closest to unknown
tuple.
© 2016, IJCSMC All Rights Reserved 3
D. Decision Tree
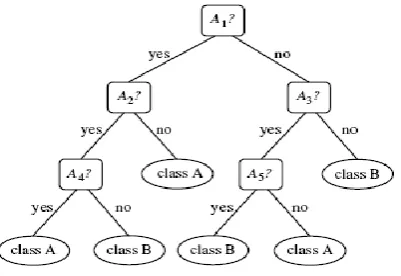
Decision tree [3] induction is the learning of decision trees from class-labeled training tuples. A decision tree is a
flowchart-like tree structure, where each internal node (nonleaf node) denotes a test on an attribute, each branch represents an outcome of
the test, and each leaf node (or terminal node) holds a class label. The top most node in a tree is the root node. Algorithms ID4
adopt a greedy (i.e., nonbacktracking) approach in which decision trees are constructed in a top-down recursive
divide-and-conquer manner. Fig. 1 shows the typical structure of decision tree.
Finally, to chose to work with decision tree technique, because it is easy to understand, robust, gives the clear indication of
which fields/attributes are most important for classification, allows for categorical attributes, and also performs classification
without requiring much computation.
Fig. 1 Typical Structure of Decision Tree
III. WEB LOG CLASSIFICATION
A. User Characteristics
We can subjectively identify visitors who access the websites more frequently and those who don‟t, by their access patterns.
Visitors with interest to access the websites exhibit certain access patterns.
They access certain pages for a rather long time because they need time to read the contents. They navigate down to low-level pages because they need to access specific topics.
Bytes downloaded from that site
Other visitors who are not interested in accessing the websites exhibit these access patterns:
They may not access the websites.
They don‟t navigate down to low-level pages.
B. Web Log Files:
Log files produced by web/proxy servers are used as input for our web log classification. These are text files with a row for
each HTTP transaction. A typical row contains the following information.
212264375.682 724 192.168.22.101 TCP_MISS/200 0 POST
© 2016, IJCSMC All Rights Reserved 4 Where
212264375.682 is the time in UTC seconds 724 is the elapsed time
192.168.22.101 is the IP Address TCP_MISS/200 is the code/status
Where TCP_ codes refer to requests on the HTTP port and TCP_MISS refers that requested object was not in the
cache.
200 means OK
0 is the number of bytes delivered to the client POST is the methodof the transaction
http://207.46.109.48/gateway/gateway.dll is the URL requested.
C.
Building a Classifier
:
To classify Web logs using decision trees. First, we identify the set of attributes we will use (A1, A2, …,An) to classify the Web
logs.
Attributes Purpose
A1 Elapsed Time
A2 IP address
A3 URL
A4 Bytes
A5 The accessing depth (the depth of the pages accessed
from a single page)
Here attribute selection process is done, where
URL is particular website of our choice, here thereby considering www.youtube.com
Elapsed time gives the value when cache was busy while user was accessing that website.
Bytes downloaded and depth is a generated attribute, which gives path information of till what level the user has visited
that website.
Attribute values of depth is got by counting the number of delimiter „\‟ in the website name of that user.
D. Design of Classification Model
There are two main steps in detailed design
Data Preprocessing Building classifier
a) Data Preprocessing
© 2016, IJCSMC All Rights Reserved 5 improve the accuracy, efficiency, and scalability of the classification. This includes following steps:
Data Cleaning: This refers to the preprocessing of data in order to remove or reduce noise and the treatment of the
missing value. In web log file the attribute URL contains two parts website name and query string. Out of which
query string acts as noise, so it‟s removed using perl script.
Relevance Analysis: Many of the attributes in the data may be redundant.
Correlation analysis can be used to identify whether any two given attributes are statistically related.
Attribute subset selection can be used to find a reduced set of attributes such that the resulting probability
distribution of the data classes is as close as possible to the original distribution obtained using all attributes.
Classification process is done considering elapsed time, bytes and URL thereby reducing the set of attributes forming attributes
subset selection. Including such attributes may otherwise slow down, and possibly mislead, the learning step.
The web log file is therefore preprocessed using perl script and making it ready as training data set which looks as follows:
IP address Time Bytes Depth Class
192.168.62.51 low mod high YES
192.168.43.71 mod high high YES
192.168.61.225 low low mod NO
Here class label, YES represents interested users and No represents non interested users. These class labels are set manually,
based on values of attributes.
b) Building Classifier
The classifier is built describing the predetermined set of data classes or concepts. This is the learning step (or training
phase), where a classification algorithm builds a classifier by analyzing a training set made up of database tuples and their
associated class labels.
Getting top ten websites
From given web log file, most accessed websites by users are counted using perl script, out of which top ten websites are
taken.
Classifying the users for one website
By considering one among the top ten the website, we classify the users, based on the most important attributes of the
weblog. Most important attributes are got by information gain.
E. Algorithm
Decision trees built with the C4.5 [12] algorithm performed the best over almost all the experiments.
C4.5 builds decision trees from a set of training data using the concept of information entropy. The training data is a set
S = s1, s2,… of already classified samples. Each sample si = x1, x2,... is a vector where x1,x2,... represent attributes or features
of the sample. The training data is augmented with a vector C = c1, c2, ... where c1,c2,... represent the class that each sample
© 2016, IJCSMC All Rights Reserved 6
C4.5 uses the fact that each attribute of the data can be used to make a decision that splits the data into smaller subsets. C4.5
examines the normalized information gain (difference in entropy) that results from choosing an attribute for splitting the data.
The attribute with the highest normalized information gain is the one used to make the decision. The algorithm then recurs on
the smaller sub lists.
This algorithm has a few base cases; the most common base case is when all the samples in your list belong to the same class.
Once this happens, you simply create a leaf node for your decision tree telling you to choose that class. It might also happen that
none of the features give you any information gain, in this case C4.5 creates a decision node higher up the tree using the
expected value of the class. It also might happen that you've never seen any instances of a class; again, C4.5 creates a decision
node higher up the tree using expected value.
Algorithm :
• Check for base cases • For each attribute a
• Find the normalized information
gain from splitting on a
• Let a_best be the attribute with the
highest normalized information
gain
• Create a decision node that splits on
a_best
• Recur on the sublists obtained by
splitting on a_best and add those
nodes as children of node
C4.5 made a number of improvements to ID3. Some of these are:
Handling both continuous and discrete attributes - In order to handle continuous attributes, C4.5 creates a threshold and then
splits the list into those whose attribute value is above the threshold and those that are less than or equal to it.
Handling training data with missing attribute values - C4.5 allows attribute values to be marked as ? for missing.
Missing attribute values are simply not used in gain and entropy calculations.
© 2016, IJCSMC All Rights Reserved 7
IV. TESTING
Once the model is built, the predictive accuracy [15] of the classifier is calculated. If we were to use training set to measure
the accuracy of the classifier, this estimate would likely to be optimistic. Therefore, a test set is used, made up of test tuples and
their associated class labels. These tuples are randomly generated from the data set and are independent of the training tuples.
Accuracy Checking
The accuracy of a classifier on a given test set is the percentage of test tuples that are correctly classified by the classifier. The
associated class label of each test tuple is compared with the learnt classifier‟s class prediction for that tuple. If the accuracy of
the classifier is considered acceptable, the classifier can be used to classify future data tuples for which the class label is not
known.
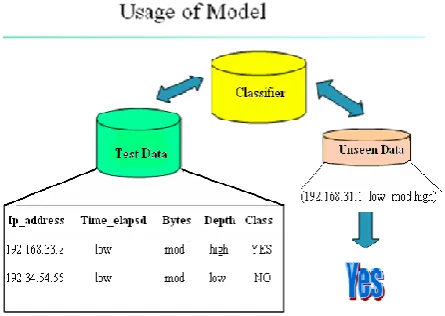
Testing process is initiated by taking each tuple of the test data set as input to our classification model and class label of test data
set is compared to that of model‟s class label. The ratio of total number of class label matched with classifier to the total number
of class labels of test data set, gives the percentage of accuracy.
Figure shows, final step of classification where test data is applied to classifier model to measure the accuracy, based on which
© 2016, IJCSMC All Rights Reserved 8
V. CONCLUSION
The system “data classification model” is able to classify users into interested visitors and non interested visitors. Here the,
classification algorithm predicts the users interest based on the their access pattern which is recorded in the web log, and this
web log is later refined in preprocessing stage to obtain training data set which is given as input to the algorithm.
Finally the classifier‟s accuracy checking is measured using randomly generated test set, made up of test tuples and their
associated class labels. If the accuracy is acceptable then classifier can be used for any unseen data tuples. And it has been
successful in generating a classifier which works almost for any test tuple.
This model can be useful for
1) Web site owners for advertising their websites for interesting users.
2) Helps the designer to improve the web site to attract visitors, or to give regular users a personalized and adaptive service.
3) Target Marketing
REFERENCES
[1] Jeffrey Xu Yu, Yuming Ou, Chengqi Zhang and Shichao Zhang, “Identifying Interesting Visitors through Web Log
Classification”, IEEE Intelligent System, 1541-1672/05, May/June 2005.
[2] Hanady Abdulsalam, David B. Skillicorn, and Patrick Martin, “Classification Using Streaming Random Forests”,IEEE
Transactions on Knowledge And Data Engineering, January 2011, Vol. 23, No.1., pp.22-36.
[3] Smith Tsang, Ben Kao, Kevin Y. Yip, Wai-Shing Ho,and Sau Dan Lee, “Decision Trees for Uncertain Data”, IEEE
Transactions On Knowledge And Data Engineering, January 2011, Vol. 23, No. 1, pp 63-78.
[4] Mahdi Khosravi, Mohammad and J. Tarokh, “Dynamic Mining of Users Interest Navigation Patterns Using Naive
Bayesian Method”, IEEE 6th International Conference on Intelligent Computer Communication and Processing
Transaction, 2010, pp. 119-122.
[5] Qiang Yang and Haining Henry Zhang, “Web-Log Mining for Predictive Web Caching”, IEEE Transactions on
Knowledge and Data Engineering, Vol. 15, No. 4, July/August 2003, pp. 1050–1053.
[6] J. Han and M. Kamber, “Data Mining: Concepts and Techniques”, Morgan Kauf-mann, San Mateo, CA, 2000.
[7] Megha P. Jarkad, Prof. Mansi, Bhonsle, “Improved Web Prediction Algorithm Using Web Log Data”, in International
Journal of Innovative Research in Computer and Communication Engineering, Vol. 3, Issue 5, May 2015, ISSN:
2320-9801.
[8] Sana Siddiqui, Imran Qadri ,“A Review on Mining Web Log Files for web Analytics and usage Patterns to improve web
Organization” in International Journal of Advanced Research in Computer Science and Software Engineering, Volume 3,
Issue 12, December 2013, ISSN: 2277 128X.
[9] Wasvand Chandrama, Prof. P.R.Devale, Prof. Ravindra Murumkar, “Data Preprocessing Method of Web Usage Mining
for Data Cleaning and Identifying User navigational Pattern” in IJISET - International Journal of Innovative Science,
Engineering & Technology, Vol. 1 Issue 10, December 2014, ISSN 2348 – 7968.
[10] L.K. Joshila Grace, V.Maheswari , Dhinaharan Nagamalai , “Analysis of Web Logs and Web User in Web Mining”, in
© 2016, IJCSMC All Rights Reserved 9
[11] Q. Yang, T. Li, and K. Wang, “Web-Log Cleaning for Constructing Sequential Classifiers,” Applied Artificial Intelligence,
vol. 17, nos. 5–6, 2003, pp. 431–441.
[12] Salvatore Ruggieri, “Efficient C4.5", IEEE Transactions on Knowledge and Data Engineering, March/April 2002, Vol. 14,
No. 2, pp. 434 -444.
[13] B. Berendt and M. Spiliopolou, “Analysis of navigation behaviour in web sites integrating multiple information systems”,
VLDB Journal, 9(1):56, 2000.
[14] H. Dai and B. Mobasher, “A road map to more effective web personalization: Integrating domain knowledge with web
usage mining”, in Proceedings of the International Conference on Internet Computing 2003 (IC03), 2003.
[15] W. Li, J. Han, and J. Pei.,” CMAR: Accurate and efficient classification based on multiple class-association rules”, IEEE,