ABSTRACT
SURESH, SAMEERAJAN. Effects of Laptop Touchpad Texturing on User Performance and Usability Assessments. (Under the direction of Dr. David B. Kaber).
Touchpads have become a common haptic interface device through the development of laptops and mobile computing technologies. This research focused on assessing user performance and perceptions of usability while using different laptop touchpad interfaces. Specifically, the study measured discrete movement task completion time and accuracy as well as subjective ratings of touchpad comfort and usefulness. A current touchpad design feature manipulated in the study was texturing of the pad surface or the degree of friction between the finger and the surface. It was hypothesized that texturing would increase task times and reduce perceived usability. Textured surfaces present a coefficient of friction that may degrade smooth dragging and click operations while using a touchpad. It was also expected that an existing model of discrete movement task performance (Fitts’ Law) would be limited in utility for predicting performance with textured touchpads. A frictional
Effects of Laptop Touchpad Texturing on User Performance and Usability Assessments
by
Sameerajan Suresh Babu
A thesis submitted to the Graduate Faculty of North Carolina State University
in partial fulfillment of the requirements for the degree of
Master of Science
Industrial Engineering
Raleigh, North Carolina 2012
APPROVED BY:
_______________________________ ______________________________
David B. Kaber, PhD Michael G. Kay, PhD
(Chairperson of advisory committee)
ii BIOGRAPHY
Sameerajan Suresh was born on October 15, 1988 in Tamil Nadu, India. He studied as a graduate student in the Edward P. Fitts Department of Industrial and Systems Engineering at North Carolina State University, U.S.A. Prior to this, he received his bachelor’s degree from the National Institute of Technology, Trichy, India in Instrumentation and Control
iii ACKNOWLEGMENTS
First and foremost I offer my sincerest gratitude to my advisor, Dr David Kaber, for his invaluable support, guidance, and for providing me with an excellent atmosphere for doing research. Dr. Kaber facilitated the completion of my Masters degree through encouragement and editing of the thesis writing. I learned a lot from this experience that may be applicable to my future research. I would also like to thank Dr. David Dickey and Dr. Michael Kay for serving on my committee and spending valuable time and effort in reviewing my work.
I gratefully acknowledge my colleagues and mentors, Aaron Stewart and Thomas Sluchak from the user experience and design team at Lenovo Inc., Morrisville, for
supervising my work as an intern. Aside from providing the laptop computers and texture samples used in this research, they offered insightful inputs all along the way. The associated experience broadened my perspective on the practical aspects of laptop design in industry.
I would like to extend my appreciation to all my friends at the Ergonomics Lab who made it a convivial place to work. In particular, thank you Chad Uy, Will Heath and Meghan Rogers for being a highly fun and cooperative team to work with. To Biwen Zhu, my sincere thanks for going out of the way in helping me conduct and review several statistical analyses. To Kinley Taylor, Zeno and Shruti, thank you for all the help and tips you provided
throughout the duration of my research.
iv TABLE OF CONTENTS
LIST OF TABLES ... vii
LIST OF FIGURES ... viii
1. Introduction ... 1
2. Review of Literature ... 3
2.1. Existing Touchpad Technology ... 3
2.2. Discrete Movement Tasks and Performance Modeling ... 6
2.3. Accounting for System Lag Conditions in Fitts’ Law ... 9
2.4. Quantifying System Latency Effects on Fitts’ Task Performance. ... 11
2.5. Friction in Touchpad Use and Parallels to Computing System Lag ... 13
2.6. Friction for Haptic Device Performance Enhancement ... 16
3. Experiment Methodology ... 19
3.1. Participants ... 19
3.2. Testing Apparatus ... 19
3.2.1. Hardware ... 19
3.2.2. Touchpad texturing ... 21
3.2.3. Software ... 22
3.2.4. Workstation layout ... 23
3.3. Variables ... 25
3.3.1. Independent Variables ... 25
3.3.2. Dependant Variables ... 26
v
3.5. Experimental task ... 28
3.6. Experimental procedure ... 29
3.7. Research Hypotheses... 30
4. Data Analyses and Results ... 33
4.1. Demographic Statistics ... 34
4.2. Task Performance Statistics ... 36
4.2.1. Task completion time ... 36
4.2.2. Accuracy ... 40
4.3. Comparison of Fitts’ model with Ware and Balakrishnan Lag model ... 42
4.4. Post-experiment questionnaire statistics ... 46
5. Discussion... 48
5.1. Hypothesis 1 ... 48
5.2. Hypothesis 2 ... 48
5.3. Hypothesis 3 ... 50
5.4. Extension of Fitts’ model to Ware and Balakrishnan model ... 51
5.5. Perceived comfort and accuracy rating analysis ... 53
6. Conclusion ... 54
6.1. Touchpad Design Recommendations ... 55
6.2. Limitations ... 56
6.3. Future Research Directions ... 58
vi
APPENDICES ... 63
Appendix A ... 64
Appendix B ... 67
vii LIST OF TABLES
Table 3.1. Experiment data collection table. ... 28 Table 4.1. Aggregated goodness of fit assessments for Fitts’ and Ware and Balakrishnan
viii LIST OF FIGURES
Figure 2.1. Texture in scroll region. ... 5
Figure 2.2. Texture with raised bumps. ... 5
Figure 2.3. Texture with engraved bumps. ... 5
Figure 2.4. Smooth non-textured touchpad (MacBook). ... 6
Figure 2.5. One dimensional Fitts movement along a direct path of length D ... 8
Figure 2.6. Target Acquisition task. ... 11
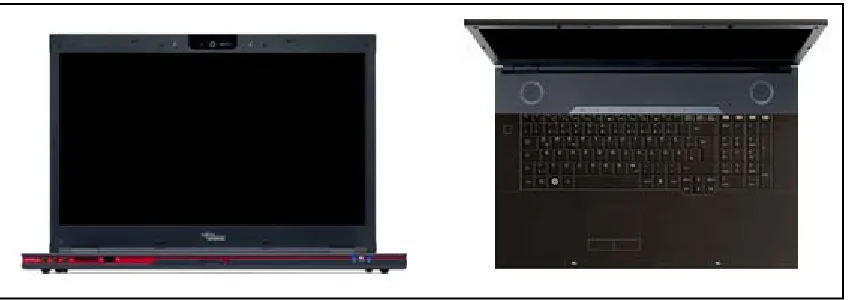
Figure 3.1. Front and top views of Fujitsu Siemens Amilo Xi3650. ... 20
Figure 3.2. Front and top views of Lenovo ThinkPad L512. ... 20
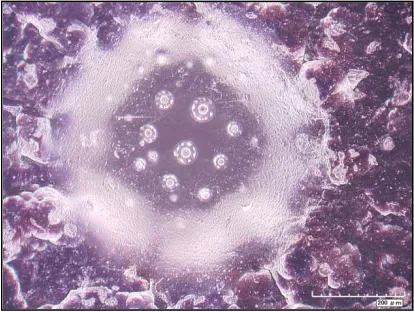
Figure 3.3. A single bump on the touchpad texture at 200µm. ... 21
Figure 3.4. Cross-section of the bump revealing height and diameter. ... 22
Figure 3.5. Test application screen image. ... 23
Figure 3.6. Workstation layout. ... 24
Figure 3.7. Participant at experiment setup. ... 24
Figure 4.1. Daily use percentages for different devices. ... 35
Figure 4.2. Percentage of pointing interface usage. ... 35
Figure 4.3. Movement time vs. ID for all three touchpad conditions. ... 37
Figure 4.4. Ballistic phase movement time vs. ID for all three touchpad ... 39
Figure 4.5. Honing phase movement time vs. ID for all three touchpad ... 40
1 1. Introduction
Since the advent of graphical user interfaces (GUIs), pointing devices and click interaction have become focal points for human-computer interaction research. Pointing devices are used routinely by millions of people all over the world. Mice were the most common input device during the desktop PC era, but with the rapid evolution of laptops and portable computers, other pointing devices have become predominant. Among these,
touchpads are the most common pointing device integrated in notebook computers. Touchpads feature a tactile sensor that can translate the relative position of a user’s fingers to a relative proxy (cursor) position on the screen. Touchpads are often small and are convenient to use when space is scarce. A touchpad is typically positioned close to a laptop keyboard, and very short finger movements are required to move the cursor across the screen (i.e., gains are often high). While advantageous for quick task performance, this positioning also poses an issue regarding inadvertent activation of the cursor via the pad. Users often accidentally run their palm over the touchpad causing the cursor to shift unexpectedly (Ganey et al., 2010). Substantial research has been conducted in order to improve user experiences with touchpads (Buxton B., 2007; Douglas et al., 1999; Douglas et al. 1997). In order to overcome the inadvertent activation problem, researchers have attempted to
incorporate cues into the physical design of pads to maintain user awareness of the touchpad’s location near the keyboard when their gaze is not on the laptop keyboard.
2 at the computer screen, he/she need not have to break the gaze to look down to position their fingers over the touchpad. Another purpose is to maintain user awaness of the sensory boundary of the touchpad. The tactile cue helps the user judge the edges of the touchpad (Hill, 2009).
Concurrently, such tactile cueing brings a frictional parameter into the use of the touchpad in common (cursor/icon) dragging and clicking operations. The raised dimples offer significant resistance to the finger motion over the touchpad. Coefficients of kinetic friction typically depend on the force applied on the touchpad surface by the fingertip. In general, the coefficient of kinetic friction on touchpad surfaces range from 0.1 (glass touchpads) to 0.6 (textured touchpads) (Winfield et al., 2007)
3 2. Review of Literature
2.1. Existing Touchpad Technology
A touchpad is a device for pointing (controlling input positioning) a cursor on a computer display screen. It is an alternative to the mouse, typically used with desktop computing systems. Originally incorporated in laptop computers, touchpads are also now being made for use with desktop computers.
Touchpads typically contain several layers of material. The top layer is the pad that a user touches. Beneath this layer are others (separated by very thin insulation) containing
horizontal and vertical rows of electrodes that form a grid. Beneath these layers is a circuit board to which the electrode layers are connected. The layers with electrodes are charged with a constant alternating (AC). As the finger approaches the electrode grid, the current is interrupted and the interruption is detected by the circuit board. A touch pad works by sensing the user's finger movement and downward pressure. The initial location where the finger touches the pad is registered so that subsequent finger movement is related to the initial contact point. Varying degrees of pressure at the pad may need to be applied for different functions (e.g., dragging, clicking, etc.)
4 scrolling (See Figure 1.1; Cirque Corporation, 2009). Further changes in texture design were motivated by an intent to provide users with a tactile cue to aid in judgment of the touchpad boundaries. As previously mentioned, this was also intended to relieve users of having to break their gaze from a computer screen to distinguish the touch sensitive surface from the palm rest area of a laptop computer. The textures were often bumps on the touchpad surface and these bumps varied by diameter, height, spacing, gloss and hardness. Many different touchpad textures were evaluated in terms of appearance and feel criteria (Hill, 2009). Some testing involved comparing the surrounding palm rest texture to the pad samples in order to ensure users could detect when their fingers moved beyond the pad boundaries. (Hill, 2009)
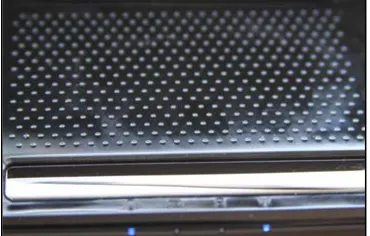
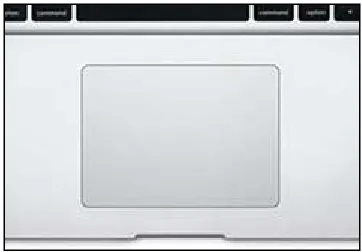
Computer and touchpad manufacturers have since modified the above mentioned texture properties for incorporation in specific touchpad products. Some of the common textures available in the market today are shown in Figure 2.2 to Figure 2.4. In the first figure, it can be seen that a high density pattern of raised bumps is used to provide pad texture. There is also a gap in the bumps to define a scrolling region for users. In Figure 2.1, a less dense pattern of dimples can be seen on the touchpad surface for providing texture. The dimples are larger and are spaced much further apart than the pad bumps in Figure 2.2. Figure 2.4 shows a touchpad for a MacBook, which is smooth and absent of any texture. Laptop
5 Figure 2.1. Texture in scroll region.
Figure 2.2. Texture with raised bumps.
6 Figure 2.4. Smooth non-textured touchpad (MacBook).
Use of pointing devices for screen navigation has changed substantially with advances in multi-touch technology. Computer manufacturers have developed touchpads capable of gesture detection in order to allow a user to invoke system functions with one finger or a combination of fingers. Another driving force behind manufacturer touchpad implementation is to make laptops thinner. With respect to texturing, manufacturers do not want to rely on a recess to define boundaries for the touchpad. This led to a requirement to assist users in identifying the boundaries of the touchpad by using texturing while still maintaining a palm-rest form factor at the same level as the touchpad surface. Textures also aid in the production feasibility of both the factors identified above. Currently textures for touchpads are selected based on appearance and feel and are supported by subjective results from focus groups. Little empirical or quantitative research is used by manufacturers as a basis for selecting touchpad technology.
2.2. Discrete Movement Tasks and Performance Modeling
7 specific distance or amplitude from the start and with a specific width. The start location and target were positioned with a normal seated-work envelope for subjects and visual feedback for error correction was available. (A one-dimensional Fitts’ task is described in greater detail below).
Fitts’ Law has been applied for predicting the time it takes for a computer user to point to a particular element on a display screen with a cursor by using a pointing device (such as a mouse or joystick), based on the size of and distance to the target element. Acquisition of a target can mean clicking on the screen object with the pointing device or directly selecting it on a touch-sensitive screen. The original formulation of Fitts’ Law, as applied to user interface design by Card, English, and Burr (1978), expresses the average time T it takes to tap a target with a mouse-controlled cursor from a fixed point as a linear function of the Index of Difficulty (ID):
𝑇 =𝑘 ×𝐼𝐷
where k ≈ 100ms, although many other constants have been reported (MacKenzie, 1991; MacKenzie, 1995a; Soukoreff and MacKenzie, 2004). The Index of Difficulty (ID) is expressed by Fitts (1954) as:
𝐼𝐷 =𝑙𝑜𝑔2�2𝑊 �𝐷
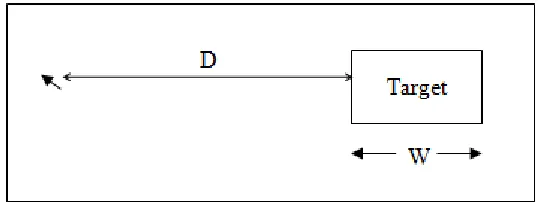
8 experiments, the amplitude or distance of the movement was assumed to be along a direct horizontal path,i.e., along one dimension. The direction of movement from left to right or right to left has been shown by Oel, Schmidt and Schmitt (2001) to be inconsequential.
Figure 2.5. One dimensional Fitts movement along a direct path of length D
from the cursor to the target with width W.
Although the model is based only on target width and amplitude, it “has proven [to be] one of the most robust, highly cited, and widely adopted models to emerge from experimental psychology” (MacKenzie, 1992). Fitts’ Law has also been empirically validated for a variety of computer-based pointing tasks and input devices (MacKenzie & Soukareff, 2003; McGuffin, 2002; Hinckley, Jacob, & Ware, 2004).
9 MacKenzie (1992), the Welford variation (Welford, 1960; 1968, p. 147) is the most widely adopted revision:
𝑀𝑇=𝑎+𝑏𝑙𝑜𝑔2�𝑊𝐴 + 0.5�
MacKenzie (1992) also proposed his own variation of the formulation. He points out that both the original and the Welford formulation sometimes yield unrealistically low and even negative values for ID. This is a theoretical problem for researchers that are left with the difficult task of explaining the meaning of negative ID values in discrete movement (i.e., the log transform of fractional motion amplitude to target width ratios). MacKenzie’s new formulation always yields positive values for task difficulty and more realistic low values of ID.
𝑀𝑇 =𝑎+𝑏𝑙𝑜𝑔2�𝑊𝐴 + 1�
2.3. Accounting for System Lag Conditions in Fitts’ Law
Human-computer interaction involves bidirectional communication between a human and a machine in an interactive task. A user issues commands to the machine through an input channel and receives results through the machine’s output channels (displays). Performance is adversely affected when either the input or the feedback is subject to delay or lag.
MacKenzie and Ware (1993) tested Fitts’ Law to determine if the degradation in
10 measured and at 225 ms performance was degraded substantially. The model they presented included a multiplicative effect between a lag parameter and Fitts’ Index of difficulty:
𝑀𝑇= 𝐶1 + (𝐶2 +𝐶3𝐿𝐴𝐺)𝐼𝐷𝑒
where LAG is in milliseconds and IDe is in bits and C1, C2, C3 are experimentally determined constants. C3 is the human processing time required to make a corrective movement in task performance. The term C2 multiplied by the ID represents the average number of iterations of a control loop to correct for processing errors, and C1 represents the sum of the initial time and the time required to confirm the acquisition of a target.
Based on these findings, the authors concluded that lag is an important parameter to considering in modeling discrete movement task performance. If user performance translates to perception of usability, then system lag may also be a key factor in usability.
Ware and Balakrishnan expanded on this study and tested the effects of lag in one- and two-dimensional (2-D) target acquisition tasks. According to the authors, the lag in a head tracking system is relatively unimportant in predicting performance whereas the lag in a hand tracking system is critical. The effects of lag in hand tracking were modeled by varying the Fitts’ Law formulation with the measured system lag as a multiplicative variable to the Fitts’ index of difficulty. The authors modified Equation 2 as follows:
𝑀𝑇= 𝐶1 +𝐶2(𝐶3 +𝑀𝐴𝐶𝐻𝐼𝑁𝐸𝐿𝐴𝐺)𝐼𝐷𝑒
11 also estimated the lag multiplier to be 40% larger than what was previously found by
MacKenzie and Ware (1993).
In general, these results suggest that any lag in computing system responsiveness to user inputs at control interfaces can degrade performance and possibly usability. The findings also support adaptation of Fitts’ Law, including other parameters in the original model, to reflect system and/or human factors in predicting discrete movement task performance.
2.4. Quantifying System Latency Effects on Fitts’ Task Performance.
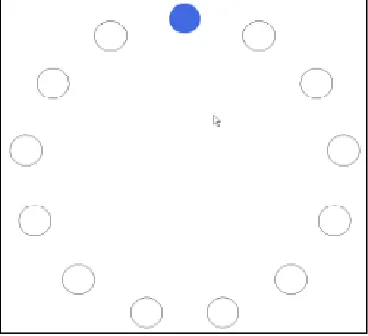
Andriy et al. (2009) studied the effects of system latency (communication delays) on speed and accuracy in 2-D pointing tasks. Experiments were conducted using a regular PC and desktop mouse. Reliable tracking of mouse position occurred through use of textured worksurface. A Fitts’ target acquisition task was set-up in which participants had to move the mouse repeatedly by hand. They were instructed to click on highlighted targets with a mouse cursor as quickly and accurately as possible (see Figure 2.6)
12 Similar to other prior studies of Fitts’ tasks, Andriy et al. (2009) found that performance depended on the ID of the pointing task. The number of targets that subjects could effectively process per time depended on the task error rate and the error rate depended on the target size. Interestingly, Andriy et al. (2009) found that smaller targets were harder to hit even if the distance between the home and target regions were proportionately adjusted to maintain a constant task ID. These findings supported the contention of earlier research (Welford, 1960; Meyer et al., 1982) that Fitts’ Law does not hold for very small values of ID and, in this case, target sizes. Therefore, performance predictions of the model may be inflated for small targets.
In addition to the effect of target width on task performance, Andriy et al. (2009) also found a significant main effect of latency. They concluded that performance degraded with increased communication latency and instability of system response. They also found a corresponding increase in task error rates with increased latency. However, for low levels of system instability (due to latency of about 58ms), the authors found no significant
performance effect. Decreases in task performance only occurred with 50 ms increases in latency. The authors determined that each 50 ms increase in latency led to a 0.8 bit per second reduction in displayed information for subjects; thus, causing the performance degradation.
13 general, system latency had a relatively high impact on task error rate. As latency increased from 33ms to 133ms, the authors found a 10-15% increase in the error rate.
Andriy et al. (2009) compared their data for a zero system instability condition with results from MacKenzie and Ware’s (1993) study of the effects of varying levels of latency on pointing performance. Although they could not determine the exact characteristics of the system used by MacKenzie and Ware (1993), they observed that for small ID values, system latency caused variable results across the two studies. However, for medium to large ID values, the results for both experiments were very close to each other.
Again, these findings suggest the limitation of Fitts’ original model of discrete movement task performance for small values of ID, approaching the limits of human performance. For this reason, the alternative formulations of the model appear to be necessary, such as that used by MacKenzie and Ware (1993), in order to account for additional system and user factors in discrete movement task performance.
2.5. Friction in Touchpad Use and Parallels to Computing System Lag
A number of studies have been conducted on user interaction with touchpads as a basis for improving the input device technology (e.g., Akamatsu et al., 2002; Cockburn et al., 2005). Akamatsu et al. (2002) analyzed changes in forces applied to a touchpad during pointing tasks vs. a mouse. The authors divided their evaluation of pointing devices into two categories. The first category involved use of gross evaluation measures, including
14 The measures were considered adequate for establishing differences among touchpad
configurations but were not considered to be powerful for explaining why differences occurred. The second category of evaluation used fine measures. Such measures involve capturing refined aspects of pointing device behavior, such as x-y coordinates of a pointer path during a test trial. Previously, Accot and Zhai (1997) sampled pointer coordinates in a trajectory formulation and cursor positioning experiment involving hierarchical menu use. Another example of a fine measure evaluation is the study of isometric joystick use by Douglas and Mithal (1997).
For calculating forces applied to the input devices, Akamatsu et al. (2002) required participants to use the touchpad and mouse on a Plexiglas force plate instrumented with a high sensitivity strain gauge. The task in the experiment was a standard target acquisition task. Participants had to use a input device to control the motion of a cursor from the center of the screen to the target location. A circular target was used with two levels difficulty achieved by changing the diameter of the target. The evaluation with gross measures revealed significance of the target size on participant performance. The task performance time was longer for the touchpad compared to the mouse, which is consistent with previous studies (Douglas et al., 1999; MacKenzie et al., 2001; MacKenzie and Oniszczak, 1998). It possible the kinetic friction between the fingertip at the pad was greater than that between the mouse and plexiglass force plate.
15 Maximum velocity was calculated from the sampled x-y coordinates and the timestamp associated with the sample. No main effects or interactions were observed for the device or target size on the maximum velocity. Maximum velocity occurs in the ballistic phase of motion and since there were no significant differences between devices in maximum
velocity, it follows that the touchpad’s longer movement time was due to velocity differences among devices in the honing phase or the need for more exacting corrective movements to position the cursor over a target.
The assessment of the applied force revealed reductions in force to occur on the way to the target, in general. In comparison between the mouse and touchpad, participants increased force on the mouse as they came close to the target (in the honing phase). On the other hand, finger force decreased at the touchpad surface as they approached a target. The reason for this could have been to avoid unstable tracker movements while using the touchpad.
Although subjects decreased force at the pad surface, task time was longer with the touchpad than the mouse. The authors concluded by noting that the force data for the two devices could be used in transfer functions as part of touchpad device drivers to improve motion tracking and increase accuracy in screen target selection. It is important to note here that kinetic friction at input devices may have an effect on user motor behavior and performance in a Fitts’ task similar to that observed for computing system lag. Therefore, adaptation of Fitts’ Law may also be necessary for predicting discrete task movement performance with touchpads posing kinetic friction at a user’s fingertips.
Richard et al. 2000 studied the effects of real and virtual coulomb friction on
16 using the pointing device on an aluminum block or a rubber pad. Virtual friction was
simulated using a virtual coupling of the display cursor and task starting position that
consisted of a virtual spring. This simulation was based on a Karnopp (1985) friction model. The results of this study indicated that a low or moderate amount of kinetic friction at an input device can significantly improve human performance in a computer-based Fitts’ type targeting task in terms of both speed and accuracy. This result was observed for both virtual and real friction conditions. The observation on task speed is in-line with the findings of Akamatsu et al. (2002), who found that force at the touchpad surface decreased as subjects approached a screen target but task time increased. Richard’s result on accuracy supports the notion that increased surface texturing of touchpads might serve to promote user control and accuracy in screen target acquisition. Related to this, in Richard et al. (2000) study,
subjective ratings by participants revealed a preference for the “frictional” input conditions over the baseline case. Futhermore, subjects noted that virtual and real low static friction cases presented in the study “felt” very similar. This supported the validity of the analysis approach used by Richards et al. (2000).
2.6. Friction for Haptic Device Performance Enhancement
17 The first experiment by Lévesque et al. (2011) concerned the speed and accuracy of target selection with and without variable friction. Three levels of friction were incorporated in the study: constant high friction (HF), constant low friction (LF), and variable friction (VF). In the variable friction condition, the simulated friction was high in the target region and low elsewhere. The results of this study showed that variable friction (VF) improved targeting performance over HF. Another outcome was that there was no significant difference between selection speed and accuracy when using a constant low level or a constant high level of friction.
The second study analyzed the same conditions as study 1 but the tasks included
distracter images presented around the screen target. Results of this study showed no main or interaction effects of the interface condition on the dependant measures of time or errors, suggesting that variable friction does not adversely affect targeting performance in the presence of distracter shapes.
The third study was a questionnaire-based investigation. Participant responses to specific questions regarding the haptic device and friction settings as well as comments demonstrated that friction improved the subjective experience of touch interactions. The third study was focused more on user experience rather than on performance.
18 in terms of accuracy and time-to-task completion. These results provided bases for the
19 3. Experiment Methodology
3.1. Participants
Ten students, five males and five females, from North Carolina State University (NCSU) were recruited for this experiment. All participants were between the ages of 19 and 40 years, and were required to have 20/20 or corrected vision and no upper extremity pain or
disabilities. Participants’ visual acuity was verified using a Snellen Eye Chart prior to the experiment. In addition, all persons who consented to participation in the experiment were required to fill-out an upper extremity disability index and none of them recorded severe pain. Each of the participants reported being well experienced in using a computer, and all of them reported being right hand dominant. Participants verbally identified proficiency in computer use. A pre-experiment survey also revealed that participants spent 20-60 hrs. per week using computers use with an average of 40 hrs. (More details are provided on this survey below and in the results section.) Each participant provided a written informed consent (see Appendix A for NCSU Institutional Review Board approved form) prior to participation in the experiment.
3.2. Testing Apparatus
3.2.1. Hardware
20 Figure 3.1. Front and top views of Fujitsu Siemens Amilo Xi3650.
Three 15” Lenovo L512 ThinkPad laptops of identical form factor were used for the test procedure. Figure 3.2 presents front and top views of the machine. All three laptops
integrated Synaptics touchpads (with driver version 15.0.18.0). Each of the touchpads had a different Mylar textured surface. The pads were labeled as “A”, “B” and “C”. The texture for Touchpad B had no bumps and was smooth, while the textures for A and C had bumps with less and more height, respectively (additional details are provided below).
21 3.2.2. Touchpad texturing
Texture properties for two of the touchpads, including dimple/bump height and diameter, were provided by the pad manufacturer. Touchpad B was surface treated to have a depth of 0.02mm with a ultraviolet (UV) coating making the texture smooth. Touchpad C was surface treated with UV printed dimples with 0.7mm diameter, 1.2mm pitch and a height of
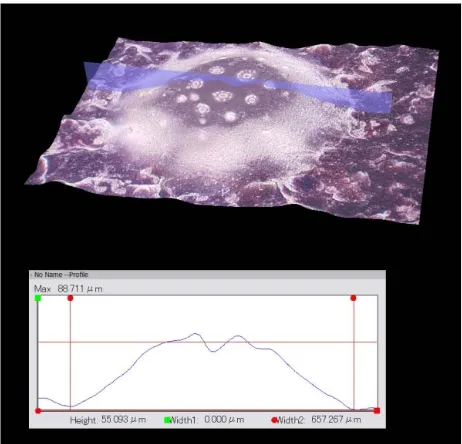
0.055±0.01mm. Texture properties for pad A had to be identified using a Hirox microscope. Figure 3.3 presents a microscopic image of a single dimple/bump on the textured touchpad surface. Figure 3.4 presents a cross-sectional image of the same bump along with a height profile. The bump height was measure in micrometers and the image also reveals the bump diameter. It was found that touchpad A was also surface treated with UV printed dimples with 0.7mm diameter, 1.2mm pitch and height of 0.03±0.01mm (range 0.018mm-0.035mm).
22 Figure 3.4. Cross-section of the bump revealing height and diameter.
3.2.3. Software
The experiment used a custom software application called the “Motion Time Evaluator” (MTE) developed by Martin Schedlbauer (University of Massachusetts, Lowell, USA). The application presents Fitts’ type target acquisition tasks and automatically records trajectory and movement time information. The software executes under a Java runtime environment and interacts with the laptop system’s pointing device through the installed touchpad driver.
23 Figure 3.5. Test application screen image.
3.2.4. Workstation layout
The training and testing laptop systems were setup in a single, large laboratory space. The machine used for participant training was located out of sight of the experiment testing area. Participants trained in the target acquisition task using the Fujitsu machine until they
achieved asymptotic performance. This was determined by comparing participant
performance across trials. Participants were required to perform the target acquisition task within a 1200ms window. Performance data was also reviewed by an experimenter after each trial block to confirm that movement times were stable. Participants were then instructed to move to the testing area.
24 task. They were instructed to use the laptop touchpad only and not the isometric forcestick integrated in the center of each keyboard (see participant performing task at laptop in Figure 3.7). Before participants used the machines, the test software was setup and executed for specific experiment conditions.
Figure 3.6. Workstation layout.
25 3.3. Variables
3.3.1. Independent Variables
The independent variables in this study included: (1) the touchpad texture; and (2) the Fitts’ task ID (index of difficulty). The three touchpads with different surface textures were tested. The texture properties of the pads separated them in terms of the degree of kinetic friction at a participant’s fingertip. Since skin characteristics can vary substantially among participants, a representative coefficient of kinetic friction could not be determined for the study sample. Consequently, the surface characteristics of the pad textures, including the height of the dimples, was used as a surrogate for a friction coefficient in the Fitts’ task performance modeling. The height remained constant for each pad across all test trials.
26 3.3.2. Dependant Variables
Time-to-task completion, accuracy and subjective ratings of comfort and accuracy were the dependant variables collected in this study. The TTC was measured in milliseconds. The MTE software recorded movement times for all the trials under the nine task conditions (3 levels of pad texture x 3 levels of Fitts’ task ID). Movement of the task cursor began when participants moved or applied pressure to the touchpad device. Once the laptop system detected the touchpad had been activated, the pointing time (ms) began. The ending time was recorded when a participant positioned the cursor in the center of the target and depressed the input control key (a left touchpad button click).
Accuracy was measured in terms of the ratio between the actual distance travelled by the pointer on the laptop display screen, divided by the minimum straightline distance between the cursor start position and target location for each trial. This ratio was assumed to be 1.0 or greater in all trials; therefore, accuracy was derived as: (1 – (Ratio – 1)) * 100%.
A subjective rating questionnaire was prepared for the study, including three parts (see Appendix C). The first part required participants to evaluate each of the touchpad textures in terms of perceived comfort and perceived accuracy in performance. Participants assessed the touchpads on these two characteristics using 10-point rating scales ranging from 1,
representing “strong approval” to 10, representing “strong disapproval”. Subjects checked one of ten boxes along the scale associated with integer ratings.
The second part of the questionnaire required participants to designate a relative
27 These relative assessments of pad comfort and use were followed-up by asking participants to indicate their overall touchpad texture preference. Participant simply circled one of the three touchpad labels.
The third part of the questionnaire was presented in an open-ended manner in order to encourage participants to voice their opinions on each of the touchpad textures. Participants were asked to complete the following phrases: “I thought this touchpad was..” and “I thought this touchpad felt..”. Participants were free to use phrases like, “this texture felt too bumpy”, “I felt quickest on this touchpad”, etc.
3.4. Design of Experiment
A two-factor completely within-subjects design was used in this experiment, with the touchpad texture and the task ID being the independent variables. Recall that one of the touchpads had no texture while the other two had varying levels of bump height leading to different levels of kinetic friction at the surface. The index of difficulty had three levels. The difference between each of these ID levels was due to manipulation of the task amplitude but not the target size. Consequently, there were a total of nine conditions; that is, the three levels of ID manipulated within each of the three laptop touchpad conditions.
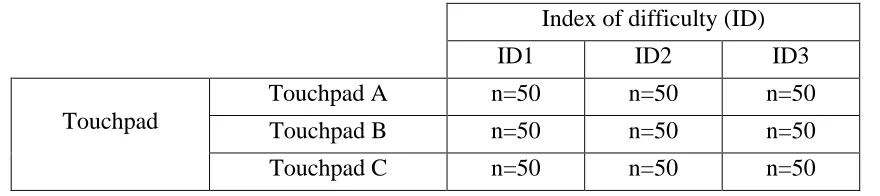
28 center of the task display screen) were programmed into the task software in advance of the tests. Overall, 50 data points were collected on each of the nine condition combinations per participant. Therefore, with the sample of 10 participants, the entire experiment yielded 4500 observations on the TTC and target acquisition accuracy responses. Table 3.1 presents the general form of the data collection table used for each participant in the study.
The subjective questionnaire was only posed once to each participant at the end of all test trials. Therefore, the comfort and accuracy rating responses, which were analyzed in this study, had 10 observations each.
Table 3.1. Experiment data collection table.
Index of difficulty (ID)
ID1 ID2 ID3
Touchpad
Touchpad A n=50 n=50 n=50
Touchpad B n=50 n=50 n=50
Touchpad C n=50 n=50 n=50
3.5. Experimental task
29 for each trial. An error was recorded when participants pressed the touchpad button to
indicate the end of an acquisition when the cursor was outside the target boundaries. Each participant was presented with multiple targets during a block of trials.
3.6. Experimental procedure
Participants first read and completed an informed consent form and completed a background questionnaire. The background questionnaire consisted of two parts. The first part requested the participants to provide demographic information, such as name, gender, and age. The second part of the questionnaire consisted of a survey focused on pointing device usage. Participants had to specify how often they used a set of pointing devices, in percentage of time. They were asked to approximately enter the number of hours they used a laptop, a desktop PC or a tablet (touch-screen device) and what pointing device they used with each. The informed consent and survey took about 10 minutes in total.
Following this survey, participants were given a brief description of a Fitts’ task and what the objective of the study was. Participants were then required to complete the training
30 Once the training was complete, participants were told the formal test process was about to begin and they were instructed that their goal was to click on the target locations as quickly and accurately as possible using only the touchpad and cursor. They were told that there were three laptops with different textured touchpad surfaces being tested and they were to complete a set of three task conditions using each touchpad. (The physical characteristics of each touchpad texture were not identified to the participants.) Participants were then required to complete the test trials. Rest periods were provided after every two blocks of 50 target acquisitions. The formal test procedure lasted for about 25 to 30 minutes. Once the participants completed the target acquisition tasks under all combinations of task difficulty level with touchpad texture, they were instructed to fill-out the post-experiment
questionnaire. They were asked to describe their thoughts on each touchpad texture. This step took about 10 minutes per participant. Once the participants completed the questionnaire, they were required to sign a payment form. Participants were thanked for their time. The total time for the experiment per participant was about 1 hour.
3.7. Research Hypotheses
The specific research hypotheses for this experiment were as follows:
31 Although Lévesque et al. (2011) found that a constant high or low level of touch interface surface friction did not have a significant effect on task performance, they evaluated programmed levels of friction through computer software and the results were contrary to Richard et al. (2002).
• Hypothesis 2 - Akamatsu et al. (2002) evaluated performance differences between a touchpad and a mouse. They found that the distance traversed by the fingertip on the touchpad reached a maximum during the ballistic phase of a Fitts’ task and that the display cursor reached also reached a maximum velocity during this phase. Based on these findings, it was expected that any texturing of a touchpad (and associated kinetic friction) would have the greatest effect on task performance time during the ballistic phase of motion in the Fitts’ target acquisition tasks.
• Hypothesis 3 – Opposite to the expectations on task performance speed, target
acquisition accuracy was expected to be greater with rougher touchpad texturing (or a greater coefficient of kinetic friction) owing to the fact that texturing and friction may slow the user’s finger motion, potentially reducing overshoots. This hypothesis was also consistent with the findings by Richard et al. (2002).
Beyond these hypotheses, it was also expected that as a result of the touchpad texturing, a revised form of Fitts’ Law would be necessary for predicting performance in the computer-based target acquisition task. In specific, a form of the model integrating a parameter to represent the degree of potential kinetic friction at the surface of the touchpad was
32 of Fitts’ Law. With this in mind, the Ware and Balakrishnan (1994) extension of Fitts’s Law, including both human and machine lag components, was expected to be significant for explaining participant performance times in the target acquisition task in the present experiment. The goodness of fit of this model to the actual experiment data was also expected to be greater than for Fitts’ original model.
33 4. Data Analyses and Results
There were six different methods of statistical data analysis used in this research, including:
1. descriptive statistics (e.g., mean and standard deviation) on questionnaire and survey data;
2. repeated measures analysis of variance (ANOVA) for effects testing on those
response measures for which the data sets met parametric statistical assumptions (i.e., random process, normality, linearity, constant variance, etc.) This approach was followed in the interest of eliminating any potential carryover effect in terms of subject performance within trials.;
3. parametric post-hoc analyses using Tukey’s Honestly Significant Difference (HSD) tests – used to identify differences among the touchpad textures and levels of ID in the event of significant main effects on the TTC and accuracy responses;
4. non-parametric statistical tests, specifically the Kruskal-Wallis (one-way test) as a counterpart to the ANOVA for response measures for which the data did not conform with parametric assumptions – this test was primarily applied to the subjective survey rating data;
34 6. linear correlation analyses (Pearson Product-Moment coefficients) for determining
whether participant subjective perceptions of touchpad comfort and accuracy
corresponded with the objective Fitts’ task performance measures, including the TTC and displacement accuracy.
An alpha-criterion of 0.05 was used for establishing statistical significance of all inferential test statistics. Only significant effects were further analyzed using the post-hoc analysis approach. Effects tests yielding p-values between 0.05 and 0.10 were considered to be marginally significant.
Related to the Type I error criterion, the sample size for the experiment was determined based on a power analysis using the data for three persons in a pilot test. The desired Type II error level was set at beta=0.2 (or a power of 80%). The limiting response measure (most variable) in the pilot study appeared to be the time to Fitts’ task completion. The mean responses for each setting of the independent variables were determined for the pilot test along with the mean square error. These values were used in computing the minimum necessary number of observations and participants to ensure the desired beta value (of 0.20 or less for each test).
4.1. Demographic Statistics
The mean age of the participants (5 males and 5 females) was 24.8 years (SD = 6.03). All participants were experienced in touchpad use. On average, participants noted that they used a laptop 91% (range 80% to 100%; S.D = 7.4) of the time for computing needs by
35 participants estimated that they used a touchpad interface 67% (range 25% to 95%, S.D = 27.2) of the time, as the primary pointing device while using a laptop, by comparison with a mouse, pointing stick or other device (see Figure 4.2). Participants were relatively consistent in their use of touchpads with only three persons falling below the average daily use
percentage (ranging from 20% to 55%).
Figure 4.1. Daily use percentages for different devices.
36 4.2. Task Performance Statistics
4.2.1. Task completion time
Diagnostics on the TTC response measure for the Fitts’ task, revealed the data to be best fit by a lognormal distribution (among normal, exponential, etc.). This was expected, as many previous Fitts’ Law studies have found that task performance in terms of movement time is fit by a lognormal distribution. Outliers in the movement time data were identified using a statistical approach. Any movement time values for a specific touchpad by task ID condition greater than the mean TTC plus or minus two standard deviations for a set of 500 observations (1 trial block under the pad by ID condition across all 10 participants) was removed from the data set. These observations were subsequently investigated for a root cause of the statistical deviation. It was found that the majority of outliers occurred for trials in which participants failed to follow the primary instruction of obtaining the target position with the screen cursor as quickly and as accurately as possible. In some cases, the cursor trajectory data revealed participants to control the cursor off the display screen. They then had to return the cursor to the workspace before acquiring the target. For the repeated
measures analysis of variance, the data points within each level of touchpad and ID that were removed owing to outliers were replaced with the mean of the movement times within that level of touchpad and ID.
37 touchpad texture (F(2,72)=3.56) and ID (F(2,72)=41.88) to be significant in movement time. (The interaction term was not significant (see below).) A plot of the TTC data suggested that the smooth touchpad produced quicker performance across task IDs (see Figure 4.3). (Note: The exact Fitts’ ID values for the target acquisition task are shown on the x-axis in Figure 4.3) The plot also provided a check on the task difficulty manipulation; that is, performance time generally decreased with decreasing ID. The post-hoc analysis using Tukey’s test revealed that task performance was not significantly different between pads A and C but both were significantly different (p<0.05) in movement time from touchpad B (the smooth pad). Post-hoc results also indicated the task performance was significantly different (p<0.05) among all the three ID conditions. The results suggested that participants performed fastest on the non-textured touchpad, as compared to the other touchpads, under the lowest task difficulty condition.
38 The ANOVA results showed that the interaction of the touchpad texture and ID were not significant. This lack of an interaction effect suggested that the rate at which movement time decreased across levels of task ID did not differ among the pads. From the interaction plot in Figure 4.3, it appeared that touchpad C produced a dramatic decline in movement time from the moderate to low ID levels as compared to pads A and B, which produced near linear declines in TTC across IDs.
In addition to assessment of touchpad texture and ID affects on the total movement time, the influence of the independent variables on ballistic and honing phase movement times were also assessed. The ballistic and honing phases of the Fitts’ task trials were identified by generating velocity profile plots (distance traveled against time) and graphically identifying the first knee point, or decrease in velocity, along a cursor trajectory. This was painstakingly done for all 4500 target acquisitions observed during the experiment.
With respect to ballistic behavior in the Fitts’ task, the same repeated measures ANOVA model as applied to the overall task time was used to identify main effects and any
39 longest performance times. The interaction between touchpad texture and ID, however, did not significantly influence movement time in the ballistic phase. Under the higher IDs, movement time appeared to be relatively consistent across textures (see Figure 4.4 for ID1 and ID2).
Figure 4.4. Ballistic phase movement time vs. ID for all three touchpad
conditions.
40 performance was fastest in the ID3 condition and slowest in the ID1 condition. The
interaction of pad texture and task ID did not yield significance in terms of task movement time.. There appeared to be differences among all IDs in terms of performance in the honing phase.
Figure 4.5. Honing phase movement time vs. ID for all three touchpad
conditions.
4.2.2. Accuracy
Task performance in terms of accuracy was calculated using the following equation: 𝑨𝒄𝒄𝒖𝒓𝒂𝒄𝒚=�𝟏 − �𝑨′𝑫− 𝟏�� ×𝟏𝟎𝟎%
41 measure. Similar forms of equations have been used in other studies of discrete movement task performance. Accuracy data typically does not follow a non-linear trend and, therefore, the above formulation is superior to a geometric model, such as the ratio of the straightline to actual cursor displacement distance. However, the linear model applied here is limited to actual cursor displacements not exceeding two times the straightline displacement to the target region. When displacement is within this limit, the accuracy response is bounded between 0% to 100%. Data points that exceeded the response limit were removed as outliers. Most of these cases occurred when participants failed to follow user instructions, and the cursor was displaced out of the screen boundaries.
The repeated measures ANOVA model, including a subject term, was used to examine the effect of touchpad textures and ID, as well as their interaction, on task accuracy. The results of this analysis revealed no significance of touchpad texture on accuracy
(F(2,72)=0.76) (see Figure 4.6). Participants performed most accurately with the “non-textured” touchpad.
The task ID was also not significant in terms of accuracy (F(2,72)=0.90). The ANOVA also indicated that the interaction of touchpad texture and ID was not significant in effecting accuracy (F(4,72)=0.71). A plot of the interaction suggested that task accuracy degraded with increasing level of difficulty. The plot also revealed that, on average, touchpad A yielded the highest target acquisition accuracy, followed by pads B and C. Although the accuracy
42 Participants have performed most accurately in the lowest ID condition and least accurately in the highest ID condition.
Figure 4.6. Accuracy vs. ID for all three touchpad conditions.
4.3. Comparison of Fitts’ model with Ware and Balakrishnan Lag model
As described above, linear regression analysis was used to assess the fit of the
experimental data to the original form of Fitts’ Law as well as the Ware and Balikrishnan (1994) revision, accounting for lag induced in task processing due to system characteristics, such as the texture of the touchpads. This analysis was motivated by an interest in identifying which model better explained task performance with touchpads under the effects of a
43 For this analysis, the actual ID measure was calculated for each trial using the following equation:
ID = log�W + 1A �
where, A is the amplitude of movement and W is the width of the target. The three amplitudes of motion for the experiment task conditions (325 pixels, 250 pixels, 125 pixels) were used in the ID calculation, while the width of the target was fixed at 50 pixels.
Consequently, the three forms of Fitts’ equation used for the regression analyses were
determined for each participant (with the subscript i denoting the participant number (1 to 10) for each of the parameters in the models) as follows:
ID3: MTi = ai + bi (1.8) ID2: MTi = ai + bi (2.6) ID1: MTi = ai + bi (2.9)
With respect to the Ware and Balakrishnan’s formulation of Fitts’ Law, the ID parameter in the extended model also took into account the surface characteristics of the touchpads. Specifically, the ID was multiplied by the average pad dimple height. Therefore, the models for each type of pad and level of experiment task difficulty were determined for each
participant (with the subscript i denoting the participant number (1 to 10) for each of the parameters in the models) as follows:
44 Pad B; ID3: MTi = ai + bi (1.8 * 0.02)
Pad B; ID2: MTi = ai + bi (2.6 * 0.02) Pad B; ID1: MTi = ai + bi (2.9 * 0.02) Pad C; ID3: MTi = ai + bi (1.8 * 0.055) Pad C; ID2: MTi = ai + bi (2.6 * 0.055) Pad C; ID1: MTi = ai + bi (2.9 * 0.055)
In order to evaluate the fit of both the Fitts’ model and the Ware and Balakrishnan model formulation to the cursor movement time data from the experiment, a series of simple linear regression analyses was conducted. The data for each participant under each task ID and touchpad texture condition was analyzed using the appropriate equation from the above lists. The observed target acquisition time was used as the response in all models. For the Fitts’ model, the predictor variable was limited to the actual task ID. For the Ware and
Balakrishnan model, the product of ID and touchpad height was used as the predictor. Goodness of fit assessments were made of each of the three Fitts’ model for each participant and each of the nine Ware and Balakrishnan formulations for each participant. The R2 value for each model was used as a measure of fit. These values were aggregated across models within type (i.e., Fitts’ or Ware and Balakrishnan) on participant-by-participant basis.
45 Table 4.1. Aggregated goodness of fit assessments for Fitts’ and Ware and
Balakrishnan (WB) models for each participant.
Participant Fitts R2 WB R2
1 0.06 0.41
2 0.31 0.39
3 0.16 0.18
4 0.22 0.28
5 0.28 0.40
6 0.30 0.32
7 0.17 0.23
8 0.21 0.21
9 0.29 0.42
10 0.15 0.26
Average 0.21 0.31
46 4.4. Post-experiment questionnaire statistics
The participants’ survey data was compiled and statistical analysis was performed on the various subjective responses, including perceived pad comfort and accuracy in performance. The objective was to determine whether the texture was significant in influence on
participant impressions of device usability.
Diagnostics on the survey data revealed violations of the assumptions parametric tests. Due to the discrete nature of the data and lack of characterization of a normal distribution, parametric tests were applied to this data. A Kruskal-Wallis test (one-way
non-parametric ANOVA counterpart) was performed with the touchpad texture as the predictor and the perceived accuracy and perceived comfort as response measures. Test results revealed a marginally significant effect of touchpad texture on (p = 0.0679) perceived comfort. Perceived accuracy, however, was not significantly influenced by the touchpad texture (p=0.2253).
Based on these findings, additional Kruskal-Wallis tests were performed on the comfort ratings for touchpad A vs. touchpad B, touchpad B vs. touchpad C, and touchpad A vs. touchpad C. These pairwise comparisons revealed no significant differences between pads A and B (p=0.0109) with an adjusted alpha-criterion of 0.10. The same was true for pad A vs. pad C (p=0.2081). However, touchpad B did prove to be significantly different (p=0.0433) from touchpad C in terms of perceived comfort, even at the alpha=0.05 level. Pad B (the smooth pad) was found to yielded higher ratings of comfort than Pad C with the texturing.
In general, the comfort rating results indicated that participant perceptions were
47 the various touchpads. Perceptions of comfort were positively correlated with performance and the correlation coefficient was found to be significant (r=0.3828, p=0.0368). Ratings of perceived accuracy also corresponded with the objective measures of target acquisition accuracy among pad types (i.e., the degree of actual cursor displacement from the center of a target). The correlation coefficient proved to be marginally significant (r=0.3128,
48 5. Discussion
5.1. Hypothesis 1
In line with expectation, overall task performance degraded with a rougher touchpad surface (i.e., higher potential coefficient of kinetic friction). The fastest performance occurred with the “non-textured” pad, as compared to the two textured alternatives. Task time increased with greater touchpad dimple height. This finding was also in agreement with Richard et al. (2002) results. Furthermore the touchpad texturing effect was apparent across levels of ID with the greatest effect occurring when transitioning from a low to moderate difficulty in the discrete movement task. This finding was in line with Fitts’ (1954) early work showing that changes in ID significantly affected discrete movement time.
The absence of a significant interaction between the ID and touchpad texture, indicated that the influence of task difficulty on user performance was irrespective ofthe lag in system responsiveness to user inputs due to friction at the touchpad surface.
Aside from the literature review, this served as additional motivation for investigating an adaptation of Fitts’ Law for predicting user movement time, including a parameter to
represent the potential friction at the touchpad. Therefore, an attempt was made to fit a reformulation of Fitts’ Law, by Ware and Balakrishnan, to the pointing device data. More discussion on this is provided below.
5.2. Hypothesis 2
49 acquisition trial were identified. As reported in the results, the touchpad texture was found to be significant in the ballistic phase but only marginally significant in the honing phase. This suggested that the touchpad texturing had a greater affect on movement time in the ballistic phase.
Post-hoc analyses on the texture effect on ballistic motion within the different task ID conditions revealed all textures to increase task time when participants were posed with higher difficulty target acquisitions. However, during the honing phase, the “non–textured” touchpad was significantly better for performance, as compared to the other two textured pads. Participants appeared to control the cursor faster with the non-textured touchpad during honing phase while performing slower and relatively the same with the textured pads. A probable cause for this is that during fine pointer movement, any degree of touchpad surface roughness (or friction) affects finger movements in a relatively consistent manner as the distances moved are typically very small.
50 5.3. Hypothesis 3
Contrary to initial hypothesis, increases in touchpad roughness (bump height or dimple depth and the potential coefficient of kinetic friction) did not necessarily lead to increased pointing accuracy. On average, the “non-textured” pad (B) proved worse than the minimally textured pad (A) but better than the high roughness pad (C). However, ANOVA results indicated no statistically significant difference among pad textures in terms of the accuracy of movement. The deterministic statistics were also inconsistent when compared to results from previous research where friction was simulated on a pointing device (Richard et al., 2000). Richard et al. (2000) found that a low kinetic friction tended to improve performance in terms of accuracy.
51 reference points for positioning the fingertip. Furthermore, the touchpad surfaces were
extremely sensitive to touch and any differences in pressure applied by participants due to pad roughness was likely accounted for by the device drivers.
5.4. Extension of Fitts’ model to Ware and Balakrishnan model
It was also hypothesized that as a result of the touchpad texturing, a revised form of Fitts’ Law would be necessary for predicting performance in the computer-based target acquisition task. Linear regression analysis was used to apply the original form of Fitts’ model, as well as the adapted form by Ware and Balakrishnan (1994), to the experimental data set. Results revealed the latter model to produce a better fit across all participants. The Ware and Balakrishnan model included an additional parameter to capture the effects pad roughness (potential surface friction) on performance. The parameter was geometrically applied to the Fitts’ ID parameter.
In general, the task completion time data showed a weak fit and did not fully conform to Fitts’ Law. This supported the need for an additional parameter to address the variations in the characteristics of the touchpad pointing device. This observation was consistent with previous findings by MacKenzie and Ware (1993).
52 Table 5.1. Regression intercept and slope coefficients for each participant.
Participant Intercept Slope
1 962.7 774.4
2 706.03 1049.24
3 831.13 708.7
4 833.78 1299.75
5 876.07 1198.59
6 824.34 1037.18
7 736.26 776.62
8 782.34 785.55
9 641.02 1918.4
10 916.63 822.21
From the tabled values, it can be seen that there were some individual differences in minimum performance times (the model intercept values). These differences were also revealed by the ANOVA models on overall task movement time as well as the ballistic and honing phase movement times. It can also be seen that for persons with lower Fitts’
(minimum) task times, the rate at which movement time increased across IDs was greater than for others with higher minimum performance times. Some participants essentially exhibited a broader range of task performance capability.
53 5.5. Perceived comfort and accuracy rating analysis
The post-experiment questionnaire data revealed a marginal effect of touchpad texture on comfort. Half of the participants preferred using the “non–textured” pad rather than the two textured alternatives. Several participants also commented that the rougher the textures were, the more “weird” they felt under their fingertips.
54 6. Conclusion
With the ever-expanding use of laptop computers, there is a need to optimize pointing device design and performance. Detailed performance and usability analyses of various physical and functional design features can support manufacturer decision making in highly competitive laptop and computer peripheral markets.
This research assessed how touchpad texture influences human motor control behavior in generic computer-based point and click tasks, as well as perceived user comfort and accuracy in performance. A discrete movement task simulation was used along with multiple textured touchpads and a smooth alternative. Findings indicated that the degree of texturing (surface roughness) was significant in task time across different degrees of pointing task difficulty. Furthermore, user performance under specific difficulty conditions appeared to be mediated by pad texture. There was, however, no effect of texturing on the objective accuracy of pointing in the simulation. Overall, the research showed that although the cursor control accuracy was not influenced, there was speed degradation as the pad surface roughness (and potential friction) increased.
In a further breakdown of the discrete movement task performance, it was found that the degradation in pointing task time due to pad texturing was worse in a ballistic phase of motion than in a honing phase. In general, increases in surface roughness increased
55 however, found that alternative pad textures produced relatively similar degradations in performance within a setting of ID.
Based on the observed user performance effects of touchpad texturing and task difficulty, it was inferred that a variation of Fitts’ Law of motor control might be necessary to account for the influence of touchpad characteristics in predicting discrete movement task times. An adaptation of Fitts’ Law developed by Ware and Balakrishnan (1994) was investigated and found to have a significantly better fit to the experimental data than the original form of Fitts’ model. The results confirmed that a model parameter representing lag in performance due to system characteristics (i.e., the touchpad surface roughness) was important for more
accurately explaining motor control behavior. The findings show that an increase in surface roughness interacts with the level of discrete movement task difficulty to cause a negative effect on task performance time.
6.1. Touchpad Design Recommendations
The results of this study indicate that texturing touchpad surfaces to provide tactile cues on pad boundaries for use without direct viewing needs to be balanced with the potential negative effects of surface friction on user performance. Although texturing does not appear to significantly affect pointing accuracy, it slows down finger motion. Therefore, pad size awareness may be supported by surface roughness but speed in pointing is compromised. These findings are also applicable across various touchpad surface roughnesses
56 pad with minimum disruption to finger movement speed. Based on the tactile resolution of the fingertip, as discussed earlier, user perception of textures and cursor positioning performance may be enhanced by spacing bumps at least 1mm apart such that each can be identified and used as a reference point at the fingertip. This design may help in generating more refined movements and greater accuracy while having a limited affect on pointing speed.
From a perceived usability standpoint, participants indicated a consistent preference for the “non–textured” touchpad in terms of both comfort and accuracy. These perceptions all significantly corresponded with actual task time and accuracy responses. One surprising but common concern among participants was that continuous long-term use of textured pads might wear on one’s fingertips leading to an uncomfortable feeling while moving over the touchpad surface.
6.2. Limitations
The results of the present research need to interpreted and applied with caution based on several caveats of the experiment. These include the following:
1. A small sample of users was recruited for participation in the study. Although the sample provided adequate statistical power of the tests, a large more diverse sample would be desirable for further generalizability of results.
2. Prior to the experiment, the participants were not surveyed on their touchpad
57 caused a bias in subjective preferences towards the textured or non-textured
touchpads.
3. Although the discrete movement task used in the study was a typical point and click task commonly executed by users at desktop and latop computer interfaces, the number of consecutive target acquisition was not common. That is, people rarely perform 50 point and click operations in a row in a daily computer use cycle. 4. A very limited set of touchpad textures were used for analysis. Only three touchpad
alternatives were provided by a partnering manufacturer. Furthemore, the two textured pads were somewhat close in physical characateristics (e.g., dimple height). 5. The study was conducted in a laboratory environment and participant performance
was likely different than would be expected under usual use case scenarios. The participants were aware that they were being observed during the task simulation and that their performance was being measured. This might have led to some bias in speed of target acquisition.
6. Another likely limitation was participant fatigue. The study followed a completely-within experiment design and participants may have been bored, fatigued or overwhelmed by having to perform 450 point and click operations in the course of less than 1 hour.