Exploring the Use of a “Safe Subset” of Extreme Programming:
An Industrial Case Study
Laurie Williams
1,
Lucas Layman
1, William Krebs
2, Annie I. Antón
1 1North Carolina State University, Department of Computer Science
{lawilli3, lmlayma2, aianton}@ncsu.edu
2
IBM Corporation, [email protected]
Contact Author: Laurie Williams 919-513-4151
Keywords: case study, extreme programming, agile software development
Abstract
A year-long case study was performed with a team at IBM to assess the effects of adopting practices of the
Extreme Programming (XP) methodology. The case study was structured using the Extreme Programming
Evaluation Framework. Through two software releases, this team transitioned and stabilized its use of a subset
of XP practices. The use of a “safe subset” of the XP practices was necessitated by corporate culture, project
characteristics, and team makeup. The team improved productivity and achieved a four-fold improvement in
the post-release quality of new code when compared to similar metrics from an earlier release. Our findings
Exploring the Use of a “Safe Subset” of Extreme Programming:
An Industrial Case Study
Laurie Williams
1,
Lucas Layman
1, William Krebs
2, Annie I. Antón
1 1North Carolina State University, Department of Computer Science
{lawilli3, lmlayma2, aianton}@ncsu.edu
2
IBM Corporation, [email protected]
Abstract
A year-long case study was performed with a team at IBM to assess the effects of adopting practices of the
Extreme Programming (XP) methodology. The case study was structured using the Extreme Programming
Evaluation Framework. Through two software releases, this team transitioned and stabilized its use of a subset
of XP practices. The use of a “safe subset” of the XP practices was necessitated by corporate culture, project
characteristics, and team makeup. The team improved productivity and achieved a four-fold improvement in
the post-release quality of new code when compared to similar metrics from an earlier release. Our findings
suggest that it is possible to adopt a partial implementation of XP practices and yield a successful project.
1. Introduction
The introduction of Extreme Programming (XP) as a viable alternative in software development has been
met with both enthusiasm and skepticism. Many articles have appeared in major software engineering
publica-tions and conference proceedings extolling the virtues of XP and questioning its weaknesses. Most often, these
reports take the form of anecdotal success stories or lessons-learned from organizations that have adapted XP
for a project [19, 20, 30]. While valuable, many of these articles do not fulfill the growing need for formal
ex-perimentation and well-ordered case studies to provide empirical evidence of XP’s virtues and shortcomings.
A common theme amongst these anecdotal reports is that the practices of XP have been altered and applied
to varying degrees on each project. These reports diverge from the assertion of XP originator Kent Beck, who
purports that the set of 12 practices support each other [5], implying that the reduction and/or elimination of any
practices might have a detrimental and dangerous effect on this potentially delicately-balanced support system.
The goal of our case study is to provide a formal investigation into the outcome of a project that uses a subset of
1. whether it is possible to prudently utilize a subset of XP practices (thereby defining a “safe” subset); and
2. which practices are essential to the balance of the XP practice support system in a particular context.
Compelling empirical evidence is often not available when a new technology is introduced. Instead, such
evidence typically evolves with the technology’s rate of adoption [8]. For example, strong empirical evidence
of the value of the Software Capability Maturity Model (CMM) [23] came after wide initial adoption [8]. We
increase the existing evidentiary base of empirical XP knowledge with a detailed study of an industrial team
within the context of the XP Evaluation Framework [31-33]. Our findings are useful for organizations seeking
scientific investigation into the real-world impacts of utilizing subsets of XP practices.
Our research follows the “industry-as-laboratory” [25] approach in which software engineering researchers
work closely with industry to create and evaluate solutions [25]. A year-long Extreme Programming (XP) case
study was performed with an IBM software development team in the United States. Given various
environ-mental constraints and the differing personalities of team members, a full adoption of all 12 XP practices was
infeasible. Therefore, the team adopted a subset of XP practices deemed appropriate for their project personnel,
corporate culture, and project characteristics. In the case study, detailed project data was collected during two
releases of a product. Additionally, the team members were interviewed to provide qualitative substantiation to
our quantitative investigation.
We tested six null hypotheses. Because we are reporting a single case study, we cannot conclusively reject
or accept these hypotheses. Our results build up the weight of evidence in the support or refutation of these
propositions. We triangulate upon this support or refutation via objective and subjective quantitative methods
and via qualitative data collection and analysis. The null hypotheses were as follows:
When used by teams operating within the specified context, the use of a specified subset of XP practices
leads to no change in:
H10: internal code structure (as measured by CK metrics and McCabe complexity)
H20: pre-release quality (as measured by defects found before product release)
H30: post-release quality (as measured by defects found by the customer after release)
H50: customer satisfaction (measured via interview and customer feedback)
H60: team morale (assessed via a survey)
The remainder of this paper is as organized as follows. Section 2 provides background information, and
Section 3 sets the context for our IBM case study. Section 4 presents the results of the case study. Finally,
Sec-tion 5 summarizes our findings and future work.
2. Background and Related Work
In this section, we discuss the advantages and limitations of case study and qualitative research in software
engineering. We also discuss the Extreme Programming Evaluation Framework created by the authors and
pro-vide a brief survey of other XP research.
2.1. Case Study Research
Case studies can be viewed as “research in the typical” [10, 15]. As opposed to formal experiments, which
often have a narrow focus and an emphasis on controlling context variables, case studies in software
engineer-ing test theories and collect data through observation of a project in an unmodified settengineer-ing [35]. However,
be-cause the corporate, team, and project characteristics are unique to each case study, comparisons and
generaliza-tions of case study results are difficult and are subject to quesgeneraliza-tions of internal validity [16]. Nonetheless, case
studies are valuable because they involve factors that staged experiments generally do not exhibit, such as scale,
complexity, unpredictability, and dynamism [25]. As such, case studies are particularly important for industrial
evaluation of software engineering methods and tools [15]. Researchers become more confident in a theory
when similar findings emerge in different contexts [15]. By performing multiple case studies and/or
experi-ments and recording the context variables of each case study, researchers can build up evidence through a
fam-ily of experiments. Replication of case studies addresses threats to experimental validity [3].
2.2. Qualitative Research
Qualitative methods can be used to enrich quantitative findings with explanatory information, helping to
explain “why” and to handle the complexities of issues involving human behavior. Seaman [28] discusses
In-terviews are used to collect historical data from the memories of interviewees, to collect opinions or
impres-sions, or to explain terminology that is used in a particular setting. Interviews can be structured, unstructured,
or semi-structured [28]. Semi-structured interviews, which we applied in this case study, are a mixture of
open-ended and specific questions designed to elicit unexpected types of information.
Another form of qualitative research that can be used to study complex real-life problems and the
immedi-ate concerns of practitioners is action research [2, 4]. Action research is an iterative process in which
research-ers and practitionresearch-ers collaborate on a cycle of activities, including problem diagnosis, action intervention, and
reflective learning. Avison et al. [2] encourage the use of action research as a way to make academic theories
relevant to practitioners in real situations. The third author on this paper was an action researcher for this study.
2.3. Extreme Programming Evaluation Framework
In this case study, we employ a benchmark for expressing the context of the case study, the extent to which
an organization has adopted and/or modified XP practices, and the result of this adoption. The benchmark,
called the XP Evaluation Framework (XP-EF) [31], is composed of three parts: XP Context Factors (XP-cf); XP
Adherence Metrics (XP-am); and XP Outcome Measures (XP-om). The metrics are focused, concise, and can
be collected by a small team without a dedicated metrics specialist.
In the XP-EF, researchers and practitioners record essential context information about their project via the
XP Context Factors (XP-cf). Recording factors such as team size, project size, criticality, and staff experience
can help explain differences in the results of applying the methodology. The second part of the XP-EF is the
XP Adherence Metrics (XP-am). The XP-am enables one to express concretely and comparatively via objective
and subjective metrics the extent to which a team utilizes the XP practices. By examining multiple XP-EF case
studies, the XP-am also allows researchers to investigate the interactions and dependencies between the XP
practices and the extent to which the practices can be separated or eliminated. Several of the XP-am metrics
require validation via repeated use of the XP-EF. Part three of the XP-EF is the XP Outcome Measures
par-tial set of XP practices. The XP-om consists of traditional external software development metrics, such as
pro-ductivity and quality.
A more detailed discussion of the XP-EF, its creation, rationale, and shortcomings may be found in [32].
Instructions and templates for measuring and reporting an XP case study data via XP-EF Version 1.2 have been
documented by the authors of this paper [31].
2.4. XP studies
Practitioners and researchers have reported numerous, predominantly anecdotal and favorable, studies of the
XP methodology in the proceedings of three annual conferences dedicated to agile methods1 and in special
is-sues of high-impact publications2. A number of these reports discuss the partial adoption of subsets of XP
prac-tices with varying results. Murru et al. describe a corporate research study in which a team of developers
adopted different subsets of XP practices on two pilot projects [22]. In the first failed project, the team
elimi-nated the planning game and metaphor practices and partially adopted the simple design, continuous integration,
and coding standard. Comparatively, in the second project, the team fully adopted both the planning game and
simple design; the second project was more successful. Müller and Tichy observed the use of XP by computer
science graduate students [21] in a university case study. The authors found that pair programming, iteration
planning, and test-driven development had mixed benefits and implementation difficulties. Reports by Poole
and Huisman [24], Wood and Kleb [34], and Bowers et al. [7] describe successful projects and lessons learned
from adapting subsets of XP practices to suit their organization’s culture and the project characteristics.
El Emam surveyed project managers, chief executive officers, developers, and vice-presidents of
engineer-ing for 21 software projects in Canada. Most notably, El Emam found that none of the companies adopted agile
practices in a “pure” form. Project teams chose which practices to adopt selectively and developed customized
approaches to operate within their particular contexts [8].
1
The International Conference on Extreme Programming and Agile Processes in Software Engineering (http://www.xp2004.org/); XP/Agile Universe (http://www.xpuniverse.com/); and Agile Development Conference (http://agiledevelopmentconference.com/). 2
Robinson and Sharp [26, 29] performed a participant-observer study based on ethnography. The
research-ers immresearch-ersed themselves in and participated with an XP team to examine the relationship between the 12 XP
practices and the four XP values: communication, feedback, simplicity, and courage. Robinson and Sharp
con-cluded that the practices can be used to create a community that support and sustains a culture that includes the
XP values. However, the specific 12 practices are not the only means for achieving the same underlying values;
teams that adopt a subset of the practices can produce a similar culture. There is a reflexive relationship
whereby, “the practices create and sustain values and values support, shape and frame practices” [26].
Abrahamsson [1] conducted a controlled case study of four software engineers working on a software
pro-ject for managing research data at a Finnish research institute using the XP methodology. The engineers were
fifth-sixth year students with between one and four years of industrial experience and were novices to XP.
Though the subjects were students, the development was not part of a university course. The project lasted
eight weeks with a fixed development schedule and fixed resources. The requirements were not well known to
the customer (the author of the paper) prior to starting the project. The study compared the results of the first
release (after the second week) and the second release (after the fourth week). The first release is considered to
be a learning release for all stakeholders. The team experienced the following results when comparing the first
and second releases: estimation accuracy was improved by 26%, productivity was increased by 12 lines of code
(LOC)/hour, and the defect rate remained low, i.e., 2.1 defects/thousand LOC (KLOC). The productivity rate
25.12 LOC/hr was comparable to that found in published Personal Software Process (PSP) [12] research [11].
3. IBM case study
We add to the knowledge about XP by performing a case study within an IBM development team in the
United States. This seven-person team develops Servlet/XML applications for a toolkit that other IBM teams
utilize to create products for external customers. In our research, we compare the second and third releases of
their product. From this point forth, we refer to the second release as the “old release” and the third release as
the “new release.” In the old release, the team had begun their initial adoption of XP practices. The team
Four of the team’s seven full-time members were interviewed seven months after the completion of the new
release. The interviews were semi-structured, and each interviewee was asked the same set of questions. A
semi-structured, phone interview was also conducted with the customer at this time. This case study will now
be described in terms of the XP-EF and its sub-categories.
3.1. XP-cf: Context factors
The XP-cf utilizes the five categories of context factors outlined by Jones [13]: software classification,
sociological, project-specific, ergonomic, technological, and geographical and an additional category,
develop-mental factors, based upon work by Boehm and Turner [6].
Software classification. In the XP-EF, projects are classified as one of six software types: systems [used to
control physical devices]; commercial [leased or marketed to external client]; information systems [for business
information]; outsourced [developed under contract]; military; or end user [private, for personal use]. The IBM
team developed software under contract for another IBM organization that ultimately marketed the product to
external customers. We thus classify this project as outsourced software.
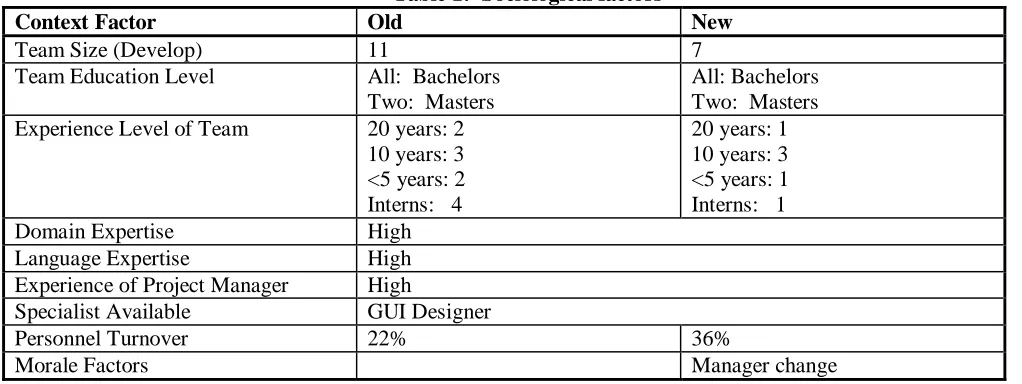
Table 1: Sociological factors
Context Factor Old New
Team Size (Develop) 11 7
Team Education Level All: Bachelors Two: Masters
All: Bachelors Two: Masters Experience Level of Team 20 years: 2
10 years: 3 <5 years: 2 Interns: 4
20 years: 1 10 years: 3 <5 years: 1 Interns: 1 Domain Expertise High
Language Expertise High Experience of Project Manager High
Specialist Available GUI Designer
Personnel Turnover 22% 36%
Morale Factors Manager change
Sociological. Team conditions for both releases are shown in Table 1. In the old product, turnover
con-sisted of one intern returning to school and a new intern joining the team. In the new release, two agile veterans
with high domain knowledge left the team for a new project, though one was available part time for questions.
are the same individuals. The team’s experience with the problem domain and software development (in
gen-eral) helped to alleviate the difficulties of learning new technologies alongside learning a new methodology.
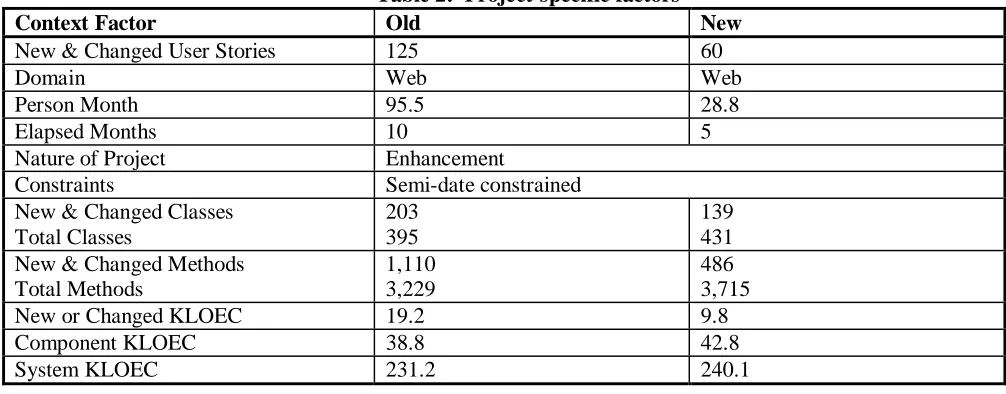
Project-specific. Table 2 compares the project-specific factors for the two releases. The language and
do-main were the same for both releases. Based upon the number of new classes, methods, and lines of code
(LOC), the new release is approximately half the size of the old release. LOC in the Table 2 (KLOEC) are
non-blank, non-comment lines.
Table 2: Project-specific factors
Context Factor Old New
New & Changed User Stories 125 60
Domain Web Web
Person Month 95.5 28.8
Elapsed Months 10 5
Nature of Project Enhancement
Constraints Semi-date constrained
New & Changed Classes Total Classes
203 395
139 431 New & Changed Methods
Total Methods
1,110 3,229
486 3,715
New or Changed KLOEC 19.2 9.8
Component KLOEC 38.8 42.8
System KLOEC 231.2 240.1
Ergonomic. Table 3 documents the projects’ ergonomic factors. Because both the old and new releases
had the same conditions, no comparison is made. Ideally, XP is implemented in an open space office landscape,
however no common programming area was available. The team sat in one aisle of cubicles with room for two
people to pair program. A white noise generator masked distractions between sets of pairs, but also impaired
information flow. Flat panel monitors assisted pairing by providing more space for the programmers to work.
Table 3: Ergonomic factors
Physical Layout Cubicles large enough to allow pair programming; flat panel monitors al-lowed for more workspace
Distraction level of office space Low. White noise generators, semi-private cubicles Customer Communication E-mail, chat programs, phone, and databases
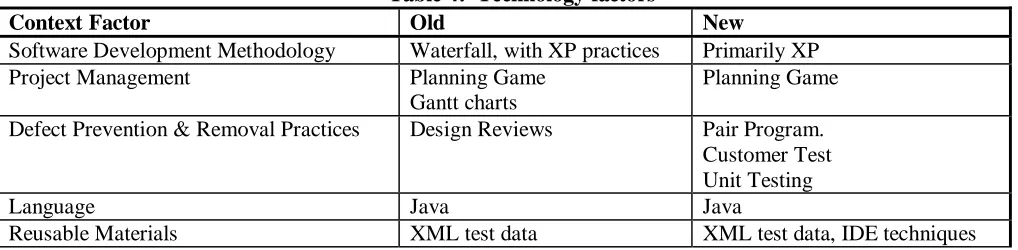
Technological. During the three years prior to the old release, the team used a blend of waterfall phases
and informal, small team practices. Due to their past success and their aversion to heavy process, the team often
code inspections. The planning process for this team had to be compatible with other teams who were not using
XP and who were accustomed to traditional design artifacts. A Slim Design Up Front (SDUF) template was
used, which included the user story, test case, and a design checklist. Since this was a follow-on release, the
base of the code had already been written for which no JUnit tests were available. The team’s technology
fac-tors are summarized in Table 4.
Table 4: Technology factors
Context Factor Old New
Software Development Methodology Waterfall, with XP practices Primarily XP Project Management Planning Game
Gantt charts
Planning Game
Defect Prevention & Removal Practices Design Reviews Pair Program. Customer Test Unit Testing
Language Java Java
Reusable Materials XML test data XML test data, IDE techniques
Geographical. Table 5 documents the geographical factors. Because both the old and new releases had the
same conditions, no comparison is made. The product was used by multiple remote customers, as opposed to
an on-site customer. The team frequently communicated with the customers or customer representatives using a
combination of problem database entries and chat programs, supplemented by the occasional phone call.
Table 5: Geographic factors Team location Collocated
Customer cardinality and location Multiple; remote; multi-national, several time zones, some very far away Supplier cardinality and location Multiple; both remote and local; two time zones
Developmental. Boehm and Turner acknowledge that agile and plan-driven methodologies each have a
role in software development and suggest a risk-based method for selecting an appropriate methodology [6].
Their five project factors (team size, criticality, personnel understanding, dynamism, and culture) aid in
select-ing an agile, plan-driven, or hybrid process. These IBM development team’s factors are graphed on a polar
chart’s five axes, shown in Figure 1. When a project’s data points for each factor are joined, shapes distinctly
toward the graph’s center suggest using an agile method. Shapes distinctly toward the periphery suggest using a
The IBM team’s shape indicates that a hybrid “mostly agile, partially plan-driven method” is appropriate. The
developmental factor that appears to necessitate plan-driven practices is criticality.
Figure 1: Developmental factors (adapted from [6])
3.2. XP-am: Adherence metrics
The XP adherence metrics enable case study comparison, the study of XP practice interaction, and the
de-termination of contextually-based, safe XP practice subsets. These metrics also provide insight into whether a
team has adopted XP’s core values. This case study provides initial validation of the am metrics. The
XP-am is comprised of both subjective and objective measures as well as qualitative analysis about the teXP-am’s use
of XP practices. The results of the team member interviews are shared in this section to aid in understanding
the quantitative findings.
The Shodan Adherence Survey (described fully in [18] and adapted from [17]) is an in-process, subjective
means of gathering XP adherence information from team members. Since the Shodan survey is subjective, it is
not advisable to compare survey results across teams. Seven people took the survey for the old release, and six
took it for the new release (which matches the number of full time team members). A survey respondent reports
shown in the tables below are from the end of each release, though the survey was also taken and analyzed
every two months to allow for reinforcement of the practices and for course correction if necessary.
We present the combined results of these adherence metrics based upon three categories: planning (Table
6), testing (Table 7), and coding (Table 8). For each section, we first present the results of the Shodan survey.
We then provide the objective metrics followed by substantiation based on interviews with team members.
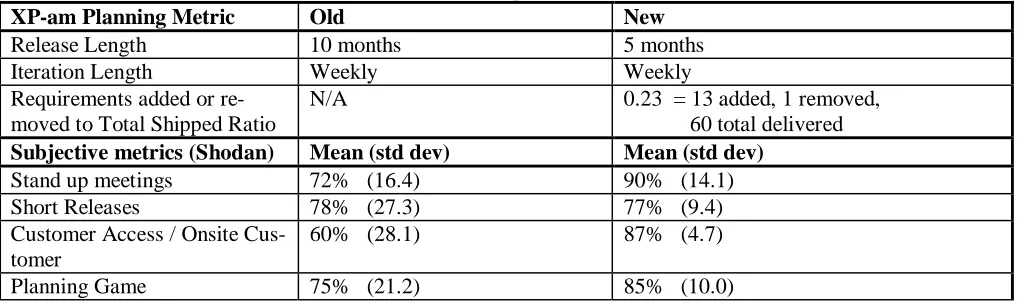
3.2.1 Planning adherence metrics
Table 6: Planning adherence metrics
XP-am Planning Metric Old New
Release Length 10 months 5 months
Iteration Length Weekly Weekly
Requirements added or re-moved to Total Shipped Ratio
N/A 0.23 = 13 added, 1 removed, 60 total delivered Subjective metrics (Shodan) Mean (std dev) Mean (std dev)
Stand up meetings 72% (16.4) 90% (14.1) Short Releases 78% (27.3) 77% (9.4) Customer Access / Onsite
Cus-tomer
60% (28.1) 87% (4.7)
Planning Game 75% (21.2) 85% (10.0)
Though the customer was remote, the team was comfortable with their remote communication, feedback,
and responsiveness via e-mail, chat programs, phone, and databases. This remote communication took place at
least two to three times per week, along with a number of phone calls throughout the release, particularly at the
end of the release cycle. Customer involvement increased as the team took more overt steps to include the
cus-tomer in the prioritization and validation of new requirements. Initially, stand-up meetings met with cultural
resistance and scheduling difficulties since team members worked at different hours. The team decided to meet
three times per week after lunch and to hold a longer, more formal meeting once per week. In interviews, team
members repeatedly stated the importance and benefits of the stand up meetings. They provided an excellent
means for intra-team communication and allowed members to get rapid feedback on problems. However, the
meetings often lasted longer than the allotted time. Also, the planning game was not always an essential part of
their activities, but its use was beneficial overall. Achieving small releases proved difficult for the team since
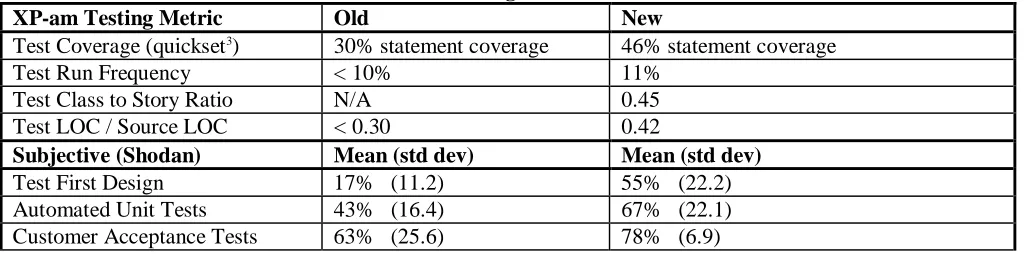
3.2.2. Testing adherence metrics
Table 7: Testing adherence metrics
XP-am Testing Metric Old New
Test Coverage (quickset3) 30% statement coverage 46% statement coverage
Test Run Frequency < 10% 11% Test Class to Story Ratio N/A 0.45 Test LOC / Source LOC < 0.30 0.42
Subjective (Shodan) Mean (std dev) Mean (std dev) Test First Design 17% (11.2) 55% (22.2) Automated Unit Tests 43% (16.4) 67% (22.1) Customer Acceptance Tests 63% (25.6) 78% (6.9)
The team’s goal for test coverage was 60%, and coverage of new and modified code was high. However,
since test coverage is averaged over the entire component, including code that was not modified or added, the
calculated number is an underestimate of the testing effort in the new release. Test-run frequency was measured
because the existence of JUnit test classes does not necessarily indicate they are used. This measure was
manu-ally calculated and partimanu-ally estimated due to the lack of an automated means for tracking this metric. Team
members were encouraged to run the entire automated suite of tests once per day, but did not due to difficulty
for some members in setting up the tools environment and the occasional lack of test discipline. To facilitate a
more thorough unit-testing effort, the team was given a goal of one automated test class per user story.
How-ever, this proved difficult to attain because some product components used techniques that the test tools could
not process. The developers became more comfortable with the concepts of the planning game and calculating
estimates over time. Customer acceptance tests were run manually.
In interviews, team members stated that automated tests were not always written before the product code;
often the product code was written first, contrary to the test-first design paradigm. Automated testing was
re-garded as a helpful exercise, but the testing of GUIs and dynamically-generated interfaces proved very difficult
because of limitations in current unit testing technology. Also, many prerequisite structures made mock objects
difficult to write. Some team members felt that involving the external test team early in development was more
beneficial than spending time writing automated unit tests.
3
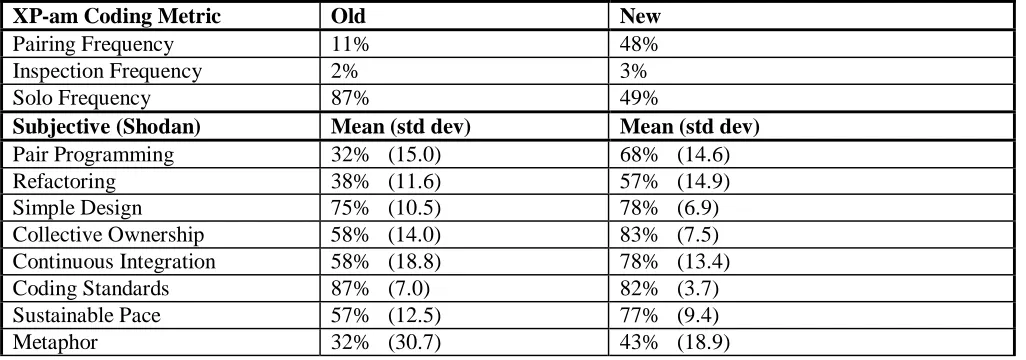
3.2.3. Coding adherence metrics
Table 8: Coding adherence metrics
XP-am Coding Metric Old New
Pairing Frequency 11% 48%
Inspection Frequency 2% 3%
Solo Frequency 87% 49%
Subjective (Shodan) Mean (std dev) Mean (std dev) Pair Programming 32% (15.0) 68% (14.6) Refactoring 38% (11.6) 57% (14.9) Simple Design 75% (10.5) 78% (6.9) Collective Ownership 58% (14.0) 83% (7.5) Continuous Integration 58% (18.8) 78% (13.4) Coding Standards 87% (7.0) 82% (3.7) Sustainable Pace 57% (12.5) 77% (9.4)
Metaphor 32% (30.7) 43% (18.9)
Pairing frequency was calculated by examining file headers. The developers indicated in the program
comment banner who worked on any file creation or modification, and pairing frequency was calculated by
searching for a symbol in these comments. For the new release, people were given a choice of pairing,
inspect-ing, or justifying why code was written alone. Team members grew more accustomed to pair programming
dur-ing the course of the project. However, team members report that pairdur-ing was sometimes abandoned due to
tight scheduling and when working on new components, but that it was often used during feature enhancement
and debugging. Similarly, the team felt more comfortable with other XP practices as time progressed, which
led to a higher rate of adoption for collective ownership, continuous integration, and sustainable pace. Despite
an increase in refactoring, the score still remained low. Reasons for this include a lack of time and resources
when refactoring major components, as well as a fear of injecting defects in the code due to inadequate
auto-mated tests. Adding a metaphor for an existing system was neither easy nor useful for this team.
3.3. Case study limitations
The third author of this paper tested, coded, and led the IBM team while participating as an action
re-searcher in this study. This intimate knowledge potentially introduces bias into the study. An experiment by
Müller and Tichy describe the necessity for active coaching until XP is fully adopted [21]. The third author’s
enthusiasm for XP may have influenced the team’s successful adoption of XP. However, his direct involvement
knew the study was occurring so a Hawthorne effect is a concern. However, the team was more interested in
completing the project and was generally ambivalent about the case study results. A peer team participated in
part of the product test, which should help remove some bias.
Team selection is a point of concern. The IBM team in this case study was selected in large part due to the
third author, who expressed eagerness to participate in an XP project. Also, as documented in the
Developmen-tal Factors in Section 3.1, the team’s risk factors indicated that they were fairly well suited for using an agile
development methodology. Since no formal selection of the case study team took place, it cannot be stated
whether this team is representative of other teams in the organization.
The comparison is made between two consecutive releases, however, we aimed to reduce internal validity
concerns by studying the same software project with a team comprised largely of the same personnel. The new
release was approximately half the size of the old release and had a smaller development team. Smaller projects
with smaller teams are often considered to be less complex. However, the new release involved understanding
and updating the larger code base. A portion of the defects discovered in field use of the new release resulted
from unmodified code of old release; these were counted as old release defects. There is also a learning curve
to be considered. The team members were learning to use some new XP practices, such as test-driven
devel-opment, and they became more comfortable with these practices in the new release.
4. Results
Of utmost importance to decision makers is whether or not adopting XP aids in productively creating a
higher quality project. We provide quantitative output measurements of productivity and quality, as well as
qualitative information gathered from team member interviews. We performed member checking with the team
members to discuss our findings and receive any final feedback on their XP experience. When asked to identify
the most important, practical, and essential practices for their team, all interviewees independently answered
that customer acceptance tests, pair programming, and the stand-up meeting were the most valuable. The only
practice deemed inessential was metaphor. Team members observed that not all practices were appropriate at
various times during development, but that the practices did seem to support one another. However, time and
full extent. Team members responded that the most important aspects of XP were not the individual practices.
Instead, the fostering of customer involvement throughout development and the increased communication
among team members yielded the most benefit. Members agreed that adopting a subset of XP practices tailored
to their development team and having XP coaching early in development were adequate to improve their
proc-ess and create a succproc-essful project.
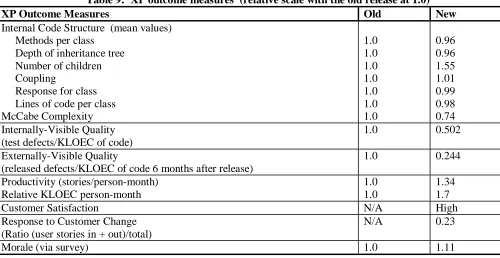
The IBM business-related results, structured via the XP-Outcome Measures (XP-om), are shown in Table 9.
A relative scale is used to protect proprietary information.
Table 9: XP outcome measures (relative scale with the old release at 1.0)
XP Outcome Measures Old New
Internal Code Structure (mean values) Methods per class
Depth of inheritance tree Number of children Coupling
Response for class Lines of code per class McCabe Complexity 1.0 1.0 1.0 1.0 1.0 1.0 1.0 0.96 0.96 1.55 1.01 0.99 0.98 0.74 Internally-Visible Quality
(test defects/KLOEC of code)
1.0 0.502
Externally-Visible Quality
(released defects/KLOEC of code 6 months after release)
1.0 0.244
Productivity (stories/person-month) Relative KLOEC person-month
1.0 1.0
1.34 1.7
Customer Satisfaction N/A High
Response to Customer Change (Ratio (user stories in + out)/total)
N/A 0.23
Morale (via survey) 1.0 1.11
Internal Code Structure. Since “big design up front” (BDUF) is not emphasized in XP, software developers
can be concerned with the resulting design of the implemented code. Table 8 displays the differences of the CK
metrics between releases. With the exception of Number of Children, the internal code structure stayed
rela-tively constant. In all cases, the mean values for these metrics did not exceed industry-standard thresholds [14,
27]. Moreover, the McCabe Complexity decreased. Additionally, the CK metrics of three representative,
fre-quently-modified classes were compared between releases on a relative scale. For these classes, Methods per
Class dropped on average to 60%, coupling to 86%, Response for Class to 83%, and lines of code to 66% (the
code components, it would be possible to draw a more formal conclusion about overall code structure based on
CK metrics and McCabe complexity. However, isolating the new and changed components for metric
collec-tion was difficult and sizeable task that must be done by hand. At this time, we can make no statement relative
to the null hypothesis H10 concerning internal code structure.
Pre-release Quality. Internal (pre-release) defect density, which concerns defects identified by an external
IBM testing organization, improved by a factor of two. For the old release, 65 scenarios were tested. For the
new release, these plus an additional 31 scenarios were tested. These findings support the alternative hypothesis
H21: when used by teams operating within this specified context, the use of a specified subset of XP practices
leads to an improvement in pre-release quality. More accurate and in-depth recordings of the testing effort and
of the involvement of the external test team during development would aid in substantiating these findings.
Post-release Quality. The new release’s post-release defect density of new code has improved by a factor
of four. The defect numbers presented reflect a collection period of 6 months after each release. The severity
distribution of the pre- and post-release defects was similar between releases. A direct comparison cannot be
made because the defect classification scheme changed for the new release. These findings support the
alterna-tive hypothesis H31: when used by teams operating within this specified context, the use of a specified subset of
XP practices leads to an improvement in post-release quality. Evidence of similar use of the product by the
customer in the old and new releases would aid in determining the accuracy of the post-release defect
compari-son for this project. According to the customer, the new release was utilized extensively during development
(in the form of pre-release drivers), and immediately after official release. The customer states that the amount
of use of the new release is comparable to that of the old release.
Productivity. The team increased the amount of user stories delivered per person month, reflecting an
in-crease in the rate of feature delivery. A dein-crease in the relative complexity of the features can potentially affect
this measure. For example, the team had to learn and employ a new API set in the old release, but the team
of-ten had the simpler task of exof-tending APIs in the new release. Also, as the team became more experienced at
the planning game, the generation of more concise user stories and work estimates may have influenced this
increase in the amount of LOC output occurred despite writing unit test code, which is not included in the total.
These findings support the alternative hypothesis H41: when used by teams operating within this specified
con-text, the use of a specified subset of XP practices leads to an improvement in developer productivity. Recording
the amount of developer effort spent on non-production activities, such as installation, training, or customer
support activities, would help account for variations in these results. Anecdotally, the team spent approximately
the same amount of time on non-developmental activities in both releases.
Customer satisfaction. Proponents of XP profess that customers are more satisfied with the resulting
pro-ject because the team produced what they actually wanted, rather than what they had originally expressed they
wanted. In the future, we plan to author and validate a customer satisfaction survey instrument. In an interview
with the customer for the IBM project, he stated that the new release was the best release of the product to date,
and that he was extremely happy with the product. Increased communication with the team, close interaction in
solving problems and in feature support, and more input into features and needs were credited as the primary
contributors to customer satisfaction. Other improvements reported by the customer include better project
or-ganization, a better mechanism for reporting features and defects, and more familiarity with the development
team. These findings support the alternative hypothesis H51: when used by teams operating within this
speci-fied context, the use of a specispeci-fied subset of XP practices leads to an improvement in customer satisfaction.
Re-lated to customer satisfaction is response to customer change. The number of user stories added and removed
based on customer priority/preference change is important because it relates to an XP team’s degree of agility.
Response to Customer Change was not computed for the old release. However, anecdotally, fewer
require-ments were added during the old release than in the new release. The team was able to successfully adapt to
changing requirements while meeting project deadlines.
Morale. Morale was assessed via an additional question placed on the Shodan Adherence Survey. The
question read, “How often can you say you are enjoying your work?” The results of the survey indicated an
overall increase in morale as the team utilized more XP practices. These findings support the alternative
hy-pothesis H61: when used by teams operating within this specified context, the use of a specified subset of XP
methods over the methods developers had previously used and perceived agile methods as enhancing morale
and team building [8].
5. Summary and Future Work
As is often the case with software engineering innovation, empirical research on the efficacy of XP is
lag-ging behind adoption of the methodology and its practices. Complicating this research issue is the fact that
most organizations that adopt XP do not use all of 12 the practices that define the methodology; organizations
customize the methodology for their own culture and project characteristics. Moreover, Kent Beck has defined
a structure whereby the practices support each other, implying that reduction and/or elimination of any of the
practices might have a detrimental and dangerous effect on this potentially delicately-balanced support system.
A year-long case study was performed of an IBM team that transitioned and stabilized the use of a subset of
XP practices. We examined six hypothesis related to the results of their partial adoption in their context. We
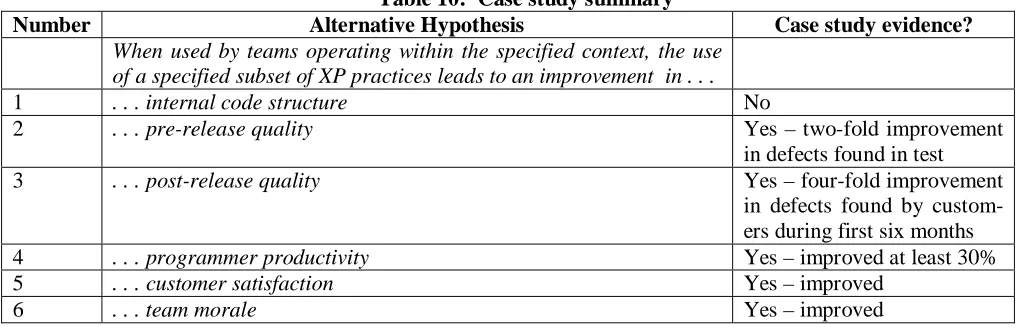
summarize our case study findings in the format suggested by Fenton [9] in Table 10. We remind the reader
that these results are based on one case study in one particular context. Our results can be used to build upon
the weight of evidence about XP, but we cannot conclusively accept or reject the hypotheses. Our findings
suggest that practitioners can adopt a “safe subset” of XP practices without destabilizing the XP practice
sup-port structure. Our findings also suggest that agile/XP methodologies can be adopted in environments reliant on
traditional software methods. While the team members already considered themselves to be “lightweight” and
less formal, the traditional process at IBM was not and could not be totally abandoned.
Table 10: Case study summary
Number Alternative Hypothesis Case study evidence?
When used by teams operating within the specified context, the use of a specified subset of XP practices leads to an improvement in . . .
1 . . . internal code structure No
2 . . . pre-release quality Yes – two-fold improvement
in defects found in test
3 . . . post-release quality Yes – four-fold improvement
in defects found by custom-ers during first six months
4 . . . programmer productivity Yes – improved at least 30%
5 . . . customer satisfaction Yes – improved
We are currently analyzing three additional industrial XP case studies structured via the XP-EF. Two
addi-tional case studies are about to commence. The results of this family of case studies and that of others will
build an empirical body of research results on XP in various contexts in various organizations. Specifically, we
intend to examine trends in the variety of safe and unsafe subsets of XP practices that emerge.
Acknowledgements
The authors wish to thank the individuals on the IBM development team for participating in this case study.
This research was supported by NCSU Center for Advanced Computing and Communication Grant 02-02.
References
[1] P. Abrahamsson, "Extreme Programming: First Results from a Controlled Case Study," 29th EUROMICRO
Confer-ence, Belek, Turkey, 2003,
[2] D. Avison, F. Lau, M. Myers, and P. A. Nielsen, "Action Research," Communications of the ACM, vol. 42, no. 1, pp.
94-97, January 1999.
[3] V. Basili, Shull, F.,Lanubile, F., "Building Knowledge through Families of Experiments," IEEE Transactions on
Soft-ware Engineering, vol. Vol. 25, No.4, 1999.
[4] R. L. Baskerville, "Investigating Information Systems with Action Research," Communications of the Associate of
In-formation Systems, vol. Volume 2, no. 19, October 1999.
[5] K. Beck, Extreme Programming Explained: Embrace Change. Reading, Massachusetts: Addison-Wesley, 2000.
[6] B. Boehm and R. Turner, Balancing Agility and Discipline. Boston, MA: Addison Wesley, 2003.
[7] J. Bowers, J. May, E. Melander, M. Baarman, and A. Ayoob, "Tailoring XP for Large System Mission-Critical
Soft-ware Development," Extreme Programming/Agile Universe, Chicago, IL, 2002,
[8] K. El Emam, "Finding Success in Small Software Projects," Agile Project Management, vol. 4, no. 11.
[9] N. Fenton, "Viewpoint Article: Conducting and Presenting Empirical Software Engineering," Empirical Software
En-gineering, vol. 6, no. 3, pp. 195-200, September 2001.
[10] N. E. Fenton and S. L. Pfleeger, Software Metrics: A Rigorous and Practical Approach: Brooks/Cole Pub Co., 1998.
[11] W. Hayes and J. W. Over, "The Personal Software Process: An Empirical Study of the Impact of PSP on Individual
Engineers," Software Engineering Institute, Pittsburgh, PA CMU/SEI-97-TR-001, December 1997.
[12] W. S. Humphrey, A Discipline for Software Engineering. Reading, MA: Addison Wesley, 1995.
[13] C. Jones, Software Assessments, Benchmarks, and Best Practices. Boston, MA: Addison Wesley, 2000.
[14] S. Kan, Metrics and Models in Software Quality Engineering: Addison Wesley, 2003.
[15] B. Kitchenham, L. Pickard, and S. L. Pfleeger, "Case Studies for Method and Tool Evaluation," IEEE Software, vol.
[16] B. A. Kitchenham, S. L. Pfleeger, L. M. Pickard, P. W. Jones, D. C. Hoaglin, K. El Emam, and J. Rosenberg,
"Pre-liminary Guidelines for Empirical Research in Software Engineering," IEEE Transactions on Software Engineering, vol.
28, no. 8, pp. 721-733, 2002.
[17] W. Krebs, "Turning the Knobs: A Coaching Pattern for XP Through Agile Metrics," Extreme Programming/Agile
Universe, Chicago, IL, 2002,
[18] W. Krebs, L. Layman, and L. Williams, "The Extreme Programming Evaluation Framework Version 1.1," North
Carolina State University Department of Computer Science TR-2003-17.
[19] M. Marchesi and G. Succi, "Extreme Programming Examined," Boston: Addison Wesley, 2001.
[20] M. Marchesi, G. Succi, D. Wells, and L. Williams, "Extreme Programming Perspectives," in XP Series, K. Beck, Ed.
Boston: Addison Wesley, 2002.
[21] M. M. Müller and W. F. Tichy, "Case Study: Extreme Programming in a University Environment," 23rd International
Conference on Software Engineering (ICSE2001), May 2001, 537-544.
[22] O. Murru, R. Deias, and G. Mugheddue, "Assessing XP at a European Internet Company," IEEE Software, vol. 20,
no. 3, pp. 37-43, May-June 2003.
[23] M. C. Paulk, B. Curtis, and M. B. Chrisis, "Capability Maturity Model for Software Version 1.1," Software
Engineer-ing Institute CMU/SEI-93-TR, February 24, 1993.
[24] C. Poole and J. W. Huisman, "Using Extreme Programming in a Maintenance Environment," IEEE Software, vol. 18,
no. pp. 42-50, Nov/Dec 2001.
[25] C. Potts, "Software Engineering Research Revisited," IEEE Software, no. pp. 19-28, September 1993.
[26] H. Robinson and H. Sharp, "XP Culture: Why the twelve practices both are and are not the most significant thing,"
Agile Software Development, Salt Lake City, UT, 2003, 12-21.
[27] L. Rosenberg, "Applying and Interpreting Object Oriented Metrics," NASA Software Assurance Technology Center.
[28] C. B. Seaman, "Qualitative Methods in Empirical Studies of Software Engineering," IEEE Transactions on Software
Engineering, vol. 25, no. 4, pp. 557-572, 1999.
[29] H. Sharp and H. Robinson, "An ethnography of XP practice," Psychology of Programming Interest Group, Keele
Uni-versity, UK, 2004,
[30] D. Wells and L. Williams, "Extreme Programming and Agile Methods -- XP/Agile Universe 2002," in Lecture Notes
in Computer Science. Berlin: Springer-Verlag, 2002.
[31] L. Williams, W. Krebs, and L. Layman, "Extreme Programming Evaluation Framework for Object-Oriented
Lan-guages -- Version 1.2," North Carolina State University, Raleigh, NC Computer Science TR-2004-1, January 5, 2004.
[32] L. Williams, w. Krebs, L. Layman, and A. Antón, "Toward a Framework for Evaluating Extreme Programming,"
North Carolina State University, Raleigh, NC Computer Science TR-2004-2, January 15, 2004.
[33] L. Williams, W. Krebs, L. Layman, and A. I. Antón, "Toward a Framework for Evaluating Extreme Programming,"
submitted to Empirical Assessment in Software Engineering (EASE) 2004, Edinburgh, Scotland, 2004,
[34] W. Wood and W. Kleb, "Exploring XP for Scientific Research," IEEE Software, pp. 30-36, May-June 2003.
[35] M. V. Zelkowitz and D. R. Wallace, "Experimental Models for Validating Technology," IEEE Computer, vol. 31, no.
![Figure 1: Developmental factors (adapted from [6])](https://thumb-us.123doks.com/thumbv2/123dok_us/1447833.1177382/11.612.198.431.122.353/figure-developmental-factors-adapted.webp)