ABSTRACT
MITCHELL, RACHEL COURTNEY. Evaluating the Effects of a Teacher Implemented Reading Fluency Program for Low-performing Second-grade Readers. (Under the direction of John Begeny).
BIOGRAPHY
ACKNOWLEDGEMENTS
TABLE OF CONTENTS
List of Tables ... vi
INTRODUCTION ...1
CHAPTER 1: REVIEW OF THE LITERATURE ...4
Underscoring the Importance of Reading Competence ...4
Reading Fluency: Definitions, Statistics and Relationships with Other Reading Processes...7
Interventions Designed to Improve Reading Fluency ...10
Repeated reading ...11
Listening passage previewing ...16
Phrase-drill error correction ...18
Combining fluency-based reading interventions ...19
Bridging the Gap between Research and Practice ...22
Implementation Integrity ...26
Implementation integrity measurement tools ...27
Improving implementation integrity ...28
CHAPTER 2: PURPOSE OF THE STUDY ...31
Research Questions and Hypotheses ...32
CHAPTER 3: METHOD ...34
Participants and Setting ...34
Teacher participants ...34
Coaches ...37
Student participants ...38
Setting ...39
Assessment Materials ...39
Dynamic Indicators of Basic Early Literacy Skills, 6th Edition (DIBELS)Oral Reading Fluency (DORF) ...40
Test of Word Reading Efficiency (TOWRE)... 41
Broad Reading Test of the Woodcock-Johnson Tests of Achievement, .Third Edition (WJ-III) ...41
Gray Oral Reading Test-Fourth Edition (GORT-4) ...42
Instructional Material ...42
Procedures ...43
Assessment procedures ...43
Implementation procedures ...43
Implementation Integrity ...48
CHAPTER 4: RESULTS ...47
Doubly-repeated Multiple Analysis of Variance...51
Pre-test and post hoc t-tests ...53
GORT Comprehension ...56
CHAPTER 5: DISCUSSION ...58
Practical Implications ...59
Limitations and Future Directions...63
REFERENCES ...65
APPENDICES ...81
Appendix A. Reading Instruction and Teacher Background Questionnaire ...82
Appendix B. HELPS Program Implementation Quiz ...83
Appendix C. Steps and Guidelines for Consulting with Teachers during their Implementation of the HELPS Program ...87
Appendix D. HELPS Program: Implementation Protocol ...89
Appendix E. Scripted Protocol—HELPS ...91
Appendix F. Tips and Reminders for Implementing the HELPS Program ...92
Appendix G. HELPS Program Progress Tracking ...94
Appendix H. Reading with Effort Prize Charting ...96
Appendix I. Primary Procedural Protocol: HELPS Program...97
Appendix J. HELPS Program Tips and Reminders Checklist ...98
LIST OF TABLES
Table 1 Doubly Repeated-Measures Multiple Analysis of Variance of Groupby Time and Reading ...52 Table 2 Pre- and Post-Test Means and Standard Deviationsby Group ...54 Table 3 Effect Size Comparisons between HELPS and Control Group Across All
Introduction
Due to the critical importance of developing reading competence, a relatively extensive amount of research has been conducted over the last couple decades regarding the elements of reading instruction that should be integrated into an effective early reading program. The five essential components include: phonics, phonemic awareness, fluency, comprehension, and vocabulary (Armbruster, Lehr, & Osborne, 2001; National Institute of Child Health and Human Development [NICHD], 2000). Of the five essential reading components, an increasing interest has been placed on the construct of reading fluency (Chard, Vaughn, & Tyler, 2002; NICHD, 2000). Reading fluency is a
complicated, multifaceted process defined as the ability to read text with speed, accuracy and proper expression, and it is a preliminary and imperative step in the process of reading comprehension (NICHD, 2000).
Even with the advances in knowledge about effective reading instruction and the importance of reading fluency, a nationally representative study of 1,779 US fourth-grade students suggests that 40% of US students are ―nonfluent‖ readers (Daane, Campbell, Grigg, Goodman, & Oranje, 2005). Other important findings from this study indicate a strong correlation between fluency and comprehension, as well as a strong correlation between oral reading fluency and students’ overall reading ability (as measured by the 2002 National Assessment of Educational Progress [NAEP] measure of US students’ reading ability). Thus, it is critical that students receive reading instruction and
strategies that have shown to improve reading fluency include: repeated reading, listening passage preview, and phrase drill. Through the use of such evidence-based, procedurally standardized intervention strategies, teachers may be able to make meaningful
contributions that improve low-performing students’ reading fluency.
Unfortunately, a large portion of empirically supported educational and
psychological interventions are not being applied within schools, as generalization from research to practice settings is not a straightforward process (Kazdin, Kratochwill, & VandenBos, 1986; Kratochwill & Stoiber, 2000; Kratochwill & Stoiber, 2002; Stoiber & Kratochwill, 2000). However, in both education and school psychology, attempts have been made to better bridge the gap between research and practice. For more than a decade, there has been increased interest in the development and dissemination of empirically supported interventions in psychology and education (Lonigan, Elbert, & Bennett Johnson, 1998; Stoiber & Kratochwill, 2000; Wampold, Lichtenberg, & Waehler, 2002).
Given the importance of reading fluency in early reading instruction, there is a fundamental need to systematically evaluate fluency-based interventions that can be feasibly implemented in elementary school classrooms. Thus, the primary purpose of the study was to continue the empirical investigations of a multi-component, evidence-based reading fluency intervention, the Helping Early Literacy with Practice Strategies
teacher assistants implementing the HELPS Program in the classroom, and (b) research assistants serving as coaches and evaluators of program implementation integrity (i.e., implementation integrity), and (c) a control-group comparison.
Chapter 1:
Review of the Literature
The following review highlights the importance of reading fluency in early reading instruction, along with the need to systematically evaluate fluency-based
interventions that can be feasibly implemented in elementary school classrooms. To make this case, the following topics are addressed: (a) the critical importance of developing reading competence, (b) a comprehensive examination of research in the area of reading fluency, (c) a review of intervention strategies designed to improve reading fluency, (d) the call to investigate the effectiveness of programs designed for applied settings, and (e) the fundamental need to monitor implementation integrity.
Underscoring the Importance of Reading Competence
their own experiences or extend the ideas in the text by making simple inferences‖ (p. 20).
Other longitudinal research demonstrates how the discrepancy in reading performance between groups of poor readers and strong readers becomes even more pronounced as children progress through the early school grades (Good, Simmons, & Smith, 1998). Persistence of reading problems has been explained as stemming from deficits in early foundational skills and exacerbated by reduced exposure to print and eventual reductions in motivation to read (Stanovich, 1986). This is evidence that proficiency in foundational skills in beginning reading is causally linked to the development of overall reading competence (NICHD, 2000).
Taking all of this into account, it is essential that struggling readers receive targeted and effective reading instruction that addresses their core weaknesses (Lloyd, 2005). Reading scholars also suggest that it is necessary to begin early and assess dynamically in order to prevent reading failure (Good, Gruba, & Kaminski., 2002). Through instruction, important skills can be taught, and research indicates that if low-achieving students can be brought up to grade level within the first three years of school, their reading performance tends to stay at grade level (Adams, 1990).
Reading Fluency: Definitions, Statistics and Relationships with Other Reading Processes
Of the five essential components of reading, an increasing interest has been placed on the construct of reading fluency (Chard, Vaughn, & Tyler, 2002; NICHD, 2000). Reading fluency is a complicated, multifaceted process defined as the ability to read text with speed, accuracy and proper expression, and it is a preliminary and
imperative step in the process of reading comprehension (NICHD, 2000). Fluency is also one of the most difficult of the dimensions to remediate for children with reading
difficulties (Kamps & Greenwood, 2005; Lovett & Steinbach, 1997; O’Connor, White, & Swanson, 2007; Torgesen, 2000). It entails a reader’s ability to ―(a) automatically
read aloud effortlessly and with expression as the student is not forced to concentrate on decoding and instead can focus attention on comprehension (LeBerge & Samuels, 1974; NICHD, 2000; Perfetti, 1977). In theories regarding information processing and verbal efficiency, improving lower level processes (speed and accuracy of reading words) frees students to devote their attention to understanding the meaning of text (O’Connor et al, 2007).
Additionally, much research supports oral reading fluency as being a strong predictor of students’ overall reading competence (Daane et al., 2005; Fuchs et al., 2001; McGlinchey & Hixson, 2004; Therrien, 2004). As noted by Daane et al. (2005), ―oral reading performance, measured by the components of accuracy, rate and fluency, constitutes a cluster of critical literacy proficiencies and functions as a significant indicator of overall reading ability‖ (p. iii). With the intent to inform educators and researchers about these three aspects of fourth-graders’ oral reading performance, the National Assessment of Educational Progress (NAEP) conducted a nationally
reading passage and 12 comprehension questions based on that passage. The passage represented one of the easiest fourth-grade reading passages from the larger NAEP reading assessment, which was conducted one week prior to the Special Fluency Study.
Although reading fluency is commonly described as a person’s ability to read with speed, accuracy, and proper expression, the Special Fluency Study considered fluency a distinct attribute of oral reading, separate from accuracy (i.e., defined as the degree to which a student’s oral reading conforms to the letter-sound conventions of printed English and measured as a percentage of words read correctly) and rate (i.e., measured by the speed at which students read aloud). Specifically, fluency was defined in terms of phrasing, adherence to the author’s syntax, and expressiveness, and measured at one of four levels on NAEP’s Oral Reading Fluency Scale. The lower half of the scale (levels 1 and 2) represented two levels of nonfluent performance, generally characterized by awkward word-by-word readings and sometimes nonmeaningful syntax. The upper half of the scale (levels 3 and 4) designated two levels of fluent performance,
characterized by preservation of author’s syntax, appropriate phrase groupings, and sometimes expressive interpretation. Accuracy referred to the degree to which a student’s oral reading conforms to the letter-sound conventions of printed English and was
measured as a percentage of words read correctly.
There were several important findings in this study. An examination of students’ fluency ratings and their average scores on the primary NAEP reading assessment
fourth-grade students were categorized as ―nonfluent‖ on the reading fluency task, suggesting that many students would benefit from an intervention aimed to improve reading fluency (Daane et al., 2005). Furthermore, a close relationship between fluency and reading comprehension was found: students who scored lower on measures of fluency also scored lower on measures of comprehension. As a whole, these data from a national sample of fourth-grade students highlight the importance of reading fluency and suggest that oral reading fluency skills may be overlooked in several U.S. classrooms. Indeed, others have argued that reading fluency is commonly neglected in U.S.
classrooms (Allington, 1983; Fuchs, et al., 2001; Rayner, Foorman, Perfetti, Pesetsky, & Seidenberg, 2001).
Interventions Designed to Improve Reading Fluency
Over the past 25 years, several studies have recognized the importance of improving students’ reading fluency by describing effective strategies for increasing students’ reading fluency and demonstrating how fluency-based strategies can also enhance other important reading abilities, including reading comprehension (Begeny & Martens, 2006; Chard et al., 2002; NIHD, 2000; Therrien, 2004). Results from reading fluency studies indicate that students should be provided with reading material on their instructional level (Gibb & Wilder, 2002; Scott & Shearer-Lingo, 2002); multiple opportunities for repeated practice (Chard et al., 2002; Coleman & Vaughn, 2000; Scott & Shearer-Lingo, 2000); corrective feedback (Chard et al., 2002; NCIHD, 2000;
displays to monitor student progress (Gibb & Wilder, 2002; Scott & Shearer-Lingo, 2002). Of the instructionally based reading fluency interventions that have been commonly described as effective for improving students’ reading fluency, repeated reading, listening passage preview, and (to a somewhat lesser extent) phrase drill error correction have been reported frequently in the research literature. Each of these strategies is described below, as they are also included in the HELPS Program.
2000; O’Shea, Sindelar, & O’Shea, 1987; Rashotte & Torgesen, 1985; Sindelar, Monda, & O’Shea, 1990; Vaughn, Chard, Bryant, Coleman, & Kouzekanani, 2000).
Chard and colleagues (2002) performed a meta-analysis to examine the effects of the components of fluency interventions (most of which were RR interventions)
conducted specifically with elementary students with LD. Intervention studies published and all dissertations conducted within the past 25 years were evaluated. The
comprehensive search yielded 24 studies between 1975 and 2000 that met inclusion criteria (i.e., eight multiple groups, five single groups, and 11 case studies or single-subject design studies). The studies were categorized into the following areas: RR
Without a Model; RR With a Model; RR Interventions with Multiple Features; and Word Practice Interventions.
RR Without a Model studies were analyzed to determine if repeatedly reading text is an effect way to improve reading fluency of students with LD. Effect sizes ranged from d = 0.02 to 3.02, with an average d = 0.68. RR With a Model was categorized into three groups: modeling by an adult, modeling by a more proficient peer, and modeling by audiotape or computer. An average effect size for each of these areas was not reported; however, it was concluded that RR with a model seems to be more effective than RR with no model. This was particularly true for students with below average reading fluency. With respect to RR Interventions with Multiple Features, which included
In sum, Chard and colleagues (2002) suggested that effective interventions for building fluency specifically include an explicit model of fluent reading, multiple opportunities to repeatedly read familiar text independently, corrective feedback, and established performance criteria for increasing text difficulty. Also important to note, while the focus of the study was not on examining students’ gains in reading
comprehension, in many cases growth in fluency was associated with comprehension growth.
In a more recent meta-analysis, Therrien (2004) confirmed RR as an effective procedure for improving the reading fluency and comprehension of both nondisabled (ND) students and students with LD. In this meta-analysis of RR studies, the effects on students’ reading fluency and comprehension were examined, as well as the impact of the specific instructional components sometimes used with RR interventions. Twenty-seven repeated reading studies were identified. Studies were included if they: (a) were
This analysis separated results into nontransfer measures (i.e., measures of students’ ability to fluently read or comprehend a passage after reading it multiple times) and transfer measures (i.e., measures of students’ ability to fluently read or comprehend new passages after having previously reread other reading material). Nontransfer results from this analysis indicate that RR is an effective strategy for improving reading fluency and comprehension on a passage that is read repeatedly. Across all nontransfer studies, the mean fluency increase was large (ES = .83, SE = .07), and mean comprehension effect size was moderate (ES = .67, SE = .08). Thus, when students reread a passage, they read it more fluently and better comprehend its meaning.
Nontransfer studies varied in the instructional components used within the interventions (i.e., cued reading, corrective feedback, and performance criteria). In cued reading, students were cued to focus on speed, comprehension, or both. Students cued to focus on speed obtained an ES = .72 (SE = .19) and a mean comprehension ES of .66 (SE = .20). Those cued to focus on comprehension obtained a mean fluency ES of .81 (SE = .10) and a mean comprehension ES of .75 (SE =.13), and students cued to focus on speed and comprehension obtained a mean fluency ES of .94 (SE = .14) and a mean
comprehension ES of .67 (SE = .14).
nontransfer interventions looked at the effect of including corrective feedback on students’ comprehension ability.
Studies that used a performance criteria obtained a mean fluency ES of .81 (SE = .07) and a mean comprehension ES of .66 (SE = .08). Mean fluency ES, based on number of readings, were as follows: two times, ES = .57, (SE = .14); three times, ES = .85 (SE = .09); and four times, ES = .95 (SE = .15).
RR may also improve students’ fluency and comprehension of new passages based upon transfer results from this analysis. Students across all transfer studies
obtained a moderate mean fluency effect size increase (ES = .50, SE = .06) and a smaller, but still significant, mean comprehension effect size increase (ES = .25, SE = .07). As a result, RR provides students with the capability to improve their overall reading fluency and reading comprehension.
of .10 (SE = .10), all studies that included a modeling component were implemented by a peer rather than an adult.
Transfer interventions used either a set number of readings or a performance criterion to determine when to move to a new passage. Interventions that used a
performance criteria obtained a mean fluency ES = 1.70 (SE = .19), whereas interventions that used a fixed number of readings obtained a mean fluency ES of .38 (SE = .06). Interventions that provided corrective feedback from an adult obtained a mean fluency ES = 1.37 (SE = .18). Interventions implemented by adults that charted student progress obtained a mean fluency ES of 1.58 (SE = .21).
Results from the analysis confirm previous findings that RR improves students’ reading fluency and comprehension, and also helps to identify essential instructional components (i.e., cuing, performance criteria, adult instructor, charting) that should be included in a reading fluency intervention. Only adult implementation is recommended because the fluency and comprehension effect sizes for students in transfer interventions conducted by adults were more than three times larger than those obtained by students in interventions conducted by peers.
important components of instruction, modeling and practice, are included in the LPP strategy. Difficult words are modeled for the student while the student silently follows along. The student then practices reading those words immediately after having previewed the passage during the model reading. LPP has been shown to increase students’ oral reading fluency and accuracy (Daly & Martens, 1994; Skinner, Cooper, & Cole, 1997).
Daly and Martens (1994) compared the effects of three instructional interventions: (a) listening passage preview; (b) subject passage preview (SSP), in which the subject independently reads a passage before being assessed; and (c) taped words, in which the subject reads along with a list of words presented by audiotape. Four male students with LD (average age of 10 years, 8 months) were assessed to determine the effects of treatment conditions on reading performance: accuracy and fluency on passages and word lists. A multi-element design was used to compare the effects of the three
Phrase-drill error correction. Like RR, phrase-drill error correction (PD) calls for students to repeatedly read text; however, in the PD procedure, students read a particular phrase from a passage repeatedly (e.g., three times consecutively) rather than reread the entire passage (Begeny, Daly, & Valleley, 2006). The phrases read contain at least one word that was incorrectly read on a previous reading of the passage, and the correct pronunciation of the incorrectly read word is usually modeled for the student before he or she reads the phrase. By reading phrases repeatedly (as opposed to isolated words) contextual cues for students are provided, and thus should allow them to read the words with greater ease. It is also thought that PD may increase reading fluency better than a word-drill procedure because students are not practicing word-by-word reading, but are reading larger linguistic units (O’Shea, Munson, & O’Shea, 1984).
Daly, Martens, Dool, and Hintze (1998) implemented a variety of interventions (e.g., RR, contingent reinforcement, LPP, PD) with three elementary aged students who were identified by their teacher as having reading difficulties. Interventions were
implemented in isolation or in combination in an attempt to determine the most effective intervention for increasing reading fluency. PD was only used in combination with other intervention components. However, results from this study demonstrated that including PD with other interventions was often more effective than using the other interventions in isolation, as there was typically an increase in reading fluency compared to baseline conditions.
Begeny et al. (2006) more recently compared the effects of RR and PD. RR and PD were alternated with a baseline and a reward condition within an alternating treatment design with an 8-year-old boy referred for reading difficulties. Results indicated that RR and PD improved the student’s reading fluency equally well relative to baseline and reward conditions; however, PD was more effective in reducing errors than RR. When these results are viewed with the data from the O’Shea et al. (1984) and Daly et al. (1998), it appears that PD, in isolation or in combination, can be considered an effective strategy that helps to improve students’ reading accuracy and reading fluency.
Combining fluency-based reading interventions. Because several reading intervention components have demonstrated success in increasing students’ reading fluency, it is not surprising that researchers have developed multi-component
better reading outcomes for students (e.g., Chard et al., 2002; Daly et al., 1998; Daly et al., 1999; Eckert, Ardoin, Daisey, & Scarola, 2000). In fact, Therrien’s meta-analysis (2004) demonstrated that intervention components are less often implemented in isolation, and more frequently combined in a treatment package.
Daly, Martens, Hamler, Dool, and Eckert (1999) evaluated the effects of different groupings of five intervention components for improving oral reading fluency for 4 students from the ages of 4-12 that had been referred for reading problems by their teacher and parents. Treatment strategies included the following components: a reward for fast reading, RR, LPP, application of a treatment to both the instructional passages (IPs) and the high content passages (HCOPs), and lowering the difficulty level of the materials by using passages that were taken from one level lower than the prior level at which the student was being instructed. Following a baseline condition, instructional treatments were combined with prior conditions until there was improvement in oral reading fluency in the IPs and HCOPs. Differentiated response patterns, assessed via a multielement design, were obtained for all students. The effects of treatment conditions on students’ reading were assessed by measuring the number of correctly read words per minute in the IPs and HCOPs. All students improved their reading fluency in at least one condition relative to baseline in both the IPs and HCOPs and in one treatment condition relative to prior treatments in both the IPs and HCOPs.
doubled for each participant under at least one combination of strategies. Eckert, Ardoin, Daly, and Martens (2002) compared brief exposures to a LPP + RR package alone and in combination with performance feedback and contingent reinforcement. The largest gains in oral reading fluency were obtained when the two instructional procedures were
combined with either performance feedback or reinforcement for 5 of the 6 participants. Promising results have also been made by Martens, Eckert, Begeny, Lewandoski, DiGennaro, Montarello, et al. (2007) who evaluated the effects of a fluency-based, after-school reading program that combined multiple intervention components (RR, PD, and LPP) with 15 second and third-grade students. Intervention was either conducted individually or in small groups for all students reading the same passage. Their findings are consistent with previous research demonstrating the efficacy of combined
intervention components for increasing oral reading fluency (e.g., Chard et al., 2002; Daly et al., 1999).
More recently, Begeny and colleagues (in press) conducted a study to evaluate the efficacy of time-efficient, fluency-based, procedurally standardized reading programs that were designed to supplement all early-elementary aged students’ core reading
significantly higher than students in the control group across several measures of early reading with effect sizes ranging from medium to large. No other statistically significant differences were found among groups.
Bridging the Gap between Research and Practice
It is crucial that students receive reading instruction and interventions in the classroom that have empirical evidence of effectiveness. As previously noted by Begeny et al. (in press), this is not usually the case. Unfortunately, a large portion of empirical educational and psychological interventions are not being applied within schools, as generalization from research to practice settings is not a straightforward process (Kazdin, Kratochwill, & VandenBos, 1986; Kratochwill & Stoiber, 2000; Kratochwill & Stoiber, 2002; Stoiber & Kratochwill, 2000). However, in both education and school psychology, attempts have been made to better bridge the gap between research and practice.
For more than a decade, there has been much interest in the development and dissemination of empirically supported interventions in psychology and education
demonstrated research support (Kratochwill, 2007). For example, in regard to research in reading fluency, the primary purpose is the promotion of evidence-based fluency building strategies in schools to help ensure that students are receiving strategies in the classroom that have been proven to be most effective in the research setting.
In education, the NRP (2000) reported evidence-based strategies in reading and in 2002 the U.S. Department of Education’s Institute of Education Science funded a major project called What Works Clearinghouse (WWC) to help manage, evaluate, and disseminate evidence-based interventions. WWC provides educators, policymakers, researchers, and the public with a central and trusted resource of scientific evidence that has been shown to work in education so that informed educational decisions can easily be made via accessible databases and user-friendly reports.
Within the field of psychology, the American Psychological Association (APA) has launched a number of initiatives to improve the gap between research and practice. One primary initiative was the formation of the Task Force on Evidence-Based
The Task Force agreed on the following definition: ―Evidence-based practice in psychology (EBPP) is the integration of the best available research with clinical expertise in the context of patient characteristics, culture, and preferences‖ (p. 273). This definition of EBPP closely parallels the definition of evidence-based practice adopted by the
Institute of Medicine (2001; as adapted from Sackett, Straus, Richardson, Rosenberg, & Haynes, 2000): ―Evidence-based practice is the integration of best research evidence with clinical expertise and patient values‖ (p. 147). The Procedural and Coding Manual for Review of Evidence-Based Interventions (hereafter called the Manual) was formed to help professionals identify, review, and code interventions that have been subjected to empirical research and evaluation. Specifically, the Manual is intended to assist in reviewing outcome research for the following purposes: (a) to identify prevention and intervention outcome studies that might influence educational and psychological prevention and intervention programs, (b) to code the studies according to Task Force criteria and provide information on the characteristics of the interventions, (c) to determine the degree to which the interventions are evidence-based on a variety of criteria, (d) to offer the field of school psychology and related fields guidelines for adopting effective programs, and (e) to provide a template for improving psychological and educational research.
and efficacy (American Psychological Association, 2002; Chambless & Hollon, 1998; Fonagy, Target, Cottrell, Phillips, & Kurtz, 2002; Nathan & Gorman, 2002). Efficacy is the standard for evaluating interventions in controlled research, whereas effectiveness is the standard for evaluating interventions in a practice context (Kratochwill & Stoiber, 2002). Efficacy studies use well-designed protocols and precise methodology, and generally are conducted in laboratories or clinical research settings. Conversely,
effectiveness studies are mostly focused on issues of generalizability of the intervention and consider such issues as the intervention’s feasibility, use, and acceptability across different settings and clients (Kratochwill & Stoiber).
Both efficacy and effectiveness studies are critical in evaluating the success of an intervention. Chorpita (2003) conceptualized research designed to advance evidence-based practice into four types. Type I, efficacy studies, as noted above, evaluate
interventions in a controlled research context. Type II, transportability studies, examine the degree to which intervention effects generalize from research to practice settings, along with the feasibility and acceptability in the practice settings, allowing for the evaluation of the various contextual issues such as training requirements, training resources, cost and time efficiency (Kratochwill, 2007; Hoagwood, Burns, Kiser, Ringeisen, & Schoenwald., 2001; Schoenwald & Hoagwood, 2001).
supervision, which may impact the effectiveness of the intervention (Kratchowill, 2007). Type IV, system evaluation studies, establish independence from investigator control and Chorpita (2003) suggested this as "the final inference to be made: whether the practice elements can lead to positive outcomes where a system stands entirely on its own" (p. 46).
Carrying out this study was necessary to investigate the effectiveness and
feasibility of the HELPS Program in an applied setting. The present study also addresses the need for increased program evaluation of reading programs that are intended for use in school settings. Additionally, for most studies evaluating classroom interventions, focus has primarily been on the development and evaluation of whether the intervention is capable of producing both strong and reliable effects (Martens, Witt, Elliott, & Darveaux, 1985). The effectiveness of an intervention is critical to evaluate; however, it is also necessary to recognize that a number of factors can mitigate the successful implementation of interventions in applied settings. Thus, it is important that interventions in applied settings be monitored to best ensure that they have been implemented in the manner intended.
Implementation Integrity
The degree to which an intervention is implemented as planned is referred to as implementation integrity (Gresham, 1989; Gresham, Gansle, Noell, Cohen, &
changes in the environment (Baer, Wolf, & Risley, 1968; Gresham, 1989; Gresham et al., 1993). Gresham (1989) suggested a number of variables that influence implementation integrity, including (a) how difficult the intervention is to implement, (b) how much time the intervention requires, (c) how many individuals are required to implement the
intervention, (d) how the intervention strains the implementing agent’s resources, and (e) how acceptable the intervention is to the person responsible for implementing it.
Implementation integrity measurement tools. Although implementation integrity has often been assumed rather than assessed by many researchers in the past (Gresham et al., 1993), there is general concurrence that measuring implementation integrity is
necessary, and both direct and indirect measures can be used to evaluate an intervention’s effectiveness. Many of the proponents of direct measurement favor direct observational ratings by utilizing a checklist that has been tailored to the intervention. Using this method, an independent observer monitors the degree to which the teacher implements the intervention as planned (Sterling-Turner, Watson, Wildmon, Watkins, & Little, 2001). Gresham et al. (1993) recommended direct observational measures as well, suggesting each component of an intervention be measured directly using an
information as the number of stars earned on behavioral charts or the number of words read using curriculum-based measurement (CBM) probes.
Also, indirect measures such as implementation agents’ self-reports via rating scales, procedural checklists, and conducting interviews with implementation agents are tools that can be utilized. However, self-reports methods should only be used as a supplement to direct observation as they are inherently subjective and limited by biases and oversights (i.e., failure to recognize when incorrectly implementing or omitting an important component of an intervention) (Gresham et al., 1993).
Improving implementation integrity. Implementation integrity oftentimes is unstable and tends to decrease over time (Greenwood, Terry, Arreaga-Mayer, & Finney, 1992; McEvoy, Shores, Wehby, Johnson, & Fox, 1990; Noell, Duhon, Gatti, & Connell, 2002; Vermilyea, Barlow, & O’Brian, 1984). Several researchers have proposed methods to increase correct implementation of interventions. Three primary means of improving integrity of an intervention include training in the intervention, scripting, and providing performance feedback.
al., 2001). This underscores the importance of providing sufficient, direct training with feedback to teachers who are implementing an intervention
Ehrhardt, Barnett, Lentz, and Stollar (1996) concluded that the use of intervention scripts (e.g., literal, written scripts of what to do and say for each component of an
intervention) is another practical method for increasing implementation integrity. These specific scripts serve as guidelines for the proper implementation of an intervention. Last, performance feedback has been shown to effectively increase teachers’
implementation integrity (DiGennaro, Martens, McIntyre, 2005; Mortenson & Witt, 1998; Noell, Witt, Gillbertson, Ranier, & Freeland, 1997, Witt, Noell, LaFleur, & Mortenson, 1997). This method can be used during training and during the
Chapter 2: Purpose of the Study
Given the importance of reading fluency in early reading instruction, as well as the need for systematically evaluating fluency-based interventions that can be feasibly implemented in elementary school classrooms, the primary purpose of this study was to continue the empirical investigations of the HELPS Program by evaluating it in a more ―effectiveness-based‖ context rather than a more tightly controlled ―efficacy-based‖ context. According to Chorpita (2003), the goal of this study is therefore to evaluate HELPS as a Type II transportability and/or Type III dissemination study. A Type I efficacy investigation has already been carried out to evaluate HELPS under more controlled conditions (Begeny et al., in press). The present study differs from this previous study in that (a) teachers and teacher assistants (rather than research assistants) implemented the HELPS Program, and (b) research assistants served as coaches and evaluators of teachers’ implementation integrity.
In addition, Begeny et al. (in press) evaluated the HELPS Program as a
supplement to all second-grade students’ core reading curriculum (including participants with low, average, and high levels of reading ability); however, the present study
Research Questions and Hypotheses
The primary research question of the present study addressed: When HELPS is implemented by classroom teachers in a minimally controlled setting with 2nd-grade participants of low reading abilities, does the program produce reading outcomes that differ significantly from a control group? It was hypothesized that the low-performing 2nd students who receive HELPS would outperform students on reading measures when compared to low-performing students who did not receive the program. This hypothesis was based on the rationale that students who received HELPS in the past made
significantly larger reading gains than students who did not receive the program (Begeny et al, in press) and previous studies that have demonstrated a combination of reading fluency building strategies typically result in better reading outcomes for students (e.g., Chard et al., 2002; Daly et al., 1998; Daly et al., 1999; Eckert, Ardoin, Daisey, & Scarola, 2000).
Chapter 3: Method Participants and Setting
Teacher participants. Four second-grade teachers and their teacher assistants from a rural school in the southeast region of the U.S. were randomly selected from a total of 9 second-grade teachers to implement HELPS with low-performing students in their
classroom. Students from the other 5 teachers’ classrooms served as control group students.
range of 3-22 years, and an average of 7 years, 0 months (SD = 5.05) of experience teaching second-grade, with a range of 1-11 years experience. Control teacher assistants had an average of 8 years, 0 months (SD = 4.08) experience teaching, with a range of 5-14 years, and an average of 4 years, 9 months (SD = 3.59) teaching experience in second-grade, with a range of 2-10 years.
Prior to working with student participants, HELPS teachers and teacher assistants (henceforth referred to as teachers) were instructed on HELPS procedural roles and program components in two 4-hour training workshops that were held within one week of each other during the month of October.
During the first workshop, the primary focus was to acquaint teachers with HELPS. First, a 30-minute presentation of the most current research findings regarding reading fluency and goals for the program was given to teachers. Next, teachers received binders that included all HELPS materials (scripted protocols, stories, graphs, star charts, etc.) they would use for the study. The HELPS components were then introduced.
Teachers were given a brief rationale for the use of CBM as an assessment tool as well as how the procedures are used as part of the RR program component. Teachers were then given the opportunity to practice using CBM as a measure of oral reading fluency. Next, an overview of each intervention component of the program (i.e., PD, LPP, charting) was provided, along with opportunities for teachers to practice implementing each
the teachers as needed. Additionally, two coaches modeled the HELPS procedures, with one coach modeling the implementation of the program and the other performing the role of a student. Two examples were modeled—one with the student meeting the reading goal, and one with the student not meeting the reading goal. Teachers followed along with HELPS protocols during this modeling phase. Teachers were then paired so they could practice the full HELPS protocol while coaches observed and provided feedback as needed.
The main purpose of the second workshop was to provide teachers additional time to practice implementing the HELPS Program. For approximately 2.5 hours, coaches paired with teachers, so that teachers could individually practice implementing the
HELPS protocol with coaches playing the role of student. Teachers were required to do at least two practices—one with the student meeting the reading goal, and one with the student not meeting the reading goal. Coaches provided immediate corrective feedback for any steps missed. Teachers were required to reach mastery criterion according to the HELPS implementation protocol. Mastery criterion was set at 100% implementation integrity during two consecutive practice sessions. Logistical questions were also addressed during the second workshop, such as how long teachers would implement the program, how many times per week, how many students would be receiving HELPS, and why coaches would be observing the teachers as they implemented the program.
answer/applied items (see Appendix B). Individually, a coach reviewed the correct answers from the quiz with each teacher and teachers’ incorrect responses were discussed to better ensure teachers understood the correct implementation procedures.
Within one to two days after the coach and teacher reviewed the implementation quiz, each teacher began implementing HELPS with seven to eight low performing readers within their classrooms. All teachers’ implementation integrity was monitored regularly throughout the study with the same procedural protocol used for training purposes.
Coaches. Throughout the course of the study, four coaches (two female graduate students, one female post-baccalaureate studentand one female undergraduate student) trained in implementation of the HELPS Program participated. Coaches were required to demonstrate proficiency in the program by reaching mastery criterion based on the implementation protocol. Mastery criterion was set at 100% implementation integrity during two consecutive practice sessions. All coaches had at least one year of experience directly implementing HELPS with second-grade students. Furthermore, coaches were selected based on their demonstrated leadership ability, and ability to communicate with others in a professional setting.
Coaches were introduced to teachers during the two training workshops, in which they provided assistance and feedback as teachers became acquainted with the
teacher implementation of the HELPS Program. Coaches were instructed in steps and guidelines for coaching and providing feedback to teachers (see Appendix C).
Student participants. Sixty students were selected from the nine second-grade classrooms to participate in the study. However, data is representative of 59 students as one student in the HELPS group moved during the course of the project. Twenty-nine students across the four randomly selected classrooms received the HELPS Program, and 30 students from the other five classrooms served as control group students. The average student age was 7 years, 8 months (SD=0.49) with a range from 7 years, 0 months to 8 years, 10 months. Of the 59 participants, 33 were female (55.9%), 31 were Caucasian (52.5%), 17 African-American (28.8%), 9 Hispanic (15.3%), and 3 were identified as Other Ethnicity (5.1%). None of the students received English as Second Language services. Additional student demographic information (e.g., eligibility for free or reduced lunch, presence of an educational and/or psychological disability) could not be obtained due to state and county regulations at the time of the study. At the participants’ school, 33% of students received free or reduced lunch, 16.9% received special education services, and 18.6% had been retained in a grade. Within the study, there were six students in the HELPS group and four students in the control group that were eligible for special education services. However, a chi-square test confirmed that these differences between groups were not significant (p = .451).
approximately 90 minutes, each utilized the Houghton Mifflin basal reading series, and each included daily reading groups (with small groups determined by student reading ability), independent reading, phonics and vocabulary lessons, and writing activities. Reading instruction for HELPS students differed only by the fact that 10 minutes of that reading instruction was devoted to the HELPS Program.
Setting. All HELPS sessions were implemented in a one-on-one (i.e., teacher-student) format in the participant’s classroom or in a quiet hallway outside each participant’s classroom. Each teacher determined whether it was best for her to implement the HELPS Program in the classroom or in the hallway. Coaches simply ensured that teachers were implementing the program with students in a setting that was free from noise and distractions.
Assessment Materials
The above measures were selected to evaluate reading skills considered critical for early reading instruction (e.g., fluency, phonics, comprehension). According to the Institute for the Development of Educational Achievement and their Analysis of Reading Assessment Instruments for K–3 (Big Ideas in Beginning Reading–Assessment Domain, 2005), the following measures were indicated as having sufficient evidence for assessing specific reading areas: WJ-III (i.e., assessment of phonics); DORF, GORT, and TOWRE (i.e. assessment of fluency). Also, these measures were utilized as each met important standards for reliability and validity, as assessed by expert committees affiliated with national reading centers such as the Florida Center for Reading Research (Florida Department of Education, 2005) and the Institute for the Development of Educational Achievement (Big Ideas in Beginning Reading – Assessment Domain, 2005).
Dynamic Indicators of Basic Early Literacy Skills, 6th Edition (DIBELS)-Oral
elementary students ranges from .92 to .97; alternate form reliability ranges from .89 to .94, and criterion-related validity ranges from .52 to .91.
Test of Word Reading Efficiency (TOWRE). The TOWRE contains two subtests: the Sight Word Efficiency (SWE) subtest assesses the number of real printed words that can be accurately identified within 45 seconds, and the Phonetic Decoding Efficiency (PDE) subtest measures the number of phonemically constructed printed nonwords that can be accurately decoded within 45 seconds. TOWRE test/retest coefficients ranges from .83 to .96, average alternate forms reliability coefficients all exceed .90, and scorers’ inter-rater reliability is reported to be .99 (Torgesen, Wagner, & Rashotte, 1999).)
Broad Reading Test of the Woodcock-Johnson Tests of Achievement, Third
Gray Oral Reading Test, Fourth Edition (GORT-4). The GORT-4 assesses students' reading accuracy, rate, and comprehension on 14 developmentally sequenced passages of 50 to 200 words in length. Five scores are provided from the test: Accuracy; Rate; Fluency (Rate + Accuracy); Comprehension; and a composite score (i.e., the Oral Reading Quotient) comprised of the sum of the Fluency and Comprehension standard score. Coefficient alphas for the Oral Reading Quotient, and the separate Fluency and Comprehension components are all at or above .90 for early primary students. Alternate form reliability is .95 for the Oral Reading Quotient, .90s for all subtests except for Comprehension (r = .78). Test-retest reliability ranges from .85 to .95 for the four subtest scores and .95 for the Oral Reading Quotient (Wiederholt, & Bryant, 2001).
Instructional Materials
HELPS instructional materials included 88 passages ranging in difficulty (from the beginning of first-grade to the end of fourth-grade). These passages consisted of 80 DORF progress monitoring passages (Good & Kaminski, 2002). These passages were representative of first through fourth-grade reading levels based on the Spache readability formula (Spache, 1953), which calculated the readability levels for the first 130 to 150 words of each DORF, ranging from 2.37 to 4.99. Eight first-grade passages from the Silver, Burdett, and Ginn (Pearson et al., 1989) first-grade reading series were also included, with readability levels ranging from 1.71 to 2.31 for these passages. All 88 passages were sequenced by readability levels.
Assessment procedures. At pre- and post-test, all participants were administered two DORF benchmark passages representative of second-grade reading material, approximately 110 to 160 words per passage. Student passages were typed and did not include pictures, and examiner copies of passages contained a cumulative word count at the end of each word line. Students’ average score across passages was used for analyses. All participants were also administered the TOWRE, the GORT, and the LWI and WA subtest of the WJ-III. Participants had not been assessed using any of these materials prior to this study.
Implementation procedures. While participants in the control group received the standard reading curriculum throughout the duration of the study, participating students in the experimental classrooms received HELPS two to three times per week from mid-October to early April, an average of 50.43 sessions (SD=2.98) throughout the study (range = 44 to 58). HELPS instructional materials were used during all sessions and for ongoing progress monitoring of students’ performance. HELPS instructional passages were typed and did not include pictures. Examiner copies of the passage contained a cumulative word count at the end of each word line. Students’ average score across passages was used for analyses. Participants had not read any of these passages prior to this study.
integrity, teachers required an average of 12 min 44 sec (SD=2.87) to complete a session with a student.
Three main elements made up the HELPS implementation protocol: (a)
introduction and initial assessment, (b) reading Track A or Track B, and (c) praise and feedback. This implementation protocol is found in Appendix D. Teachers also used scripted directions to instruct students through each program component (see Appendix E). Additionally, a sheet with important tips and reminders for implementing the program were provided to teachers. Such reminders included ensuing all necessary materials were ready prior to starting the session with student, and remembering to do the
comprehension component immediately after the student reads the first story of the session (for more examples see Appendix F).
At the beginning of each session, the teacher reviewed the program goals with the student by stating, ―When we read together today, I’d like you to try your best to
As the student read aloud for a one-minute timing, the teacher recorded words correct per minute (WCPM) and words incorrect per minute (WIPM). Words that were read incorrectly included the following: mispronunciations of words, substitutions of words, omissions of words, transpositions of words/word pairs, skipping a line in the reading passage, adding endings to words, or words read by the teacher if the student paused for three seconds while otherwise reading aloud. After one minute, the teacher prompted the student to recall as much of the story as possible. Student performance on this initial read-aloud determined whether the student would complete Track A (and meet the reading goal) or Track B (and not meet the reading goal) of the program for that day.
Three criteria were used to determine whether the student met their reading goal and if he or she would complete Track A or Track B. To progress to Track A the student needed to (a) read at least 100 words correctly on the initial passage, (b) make three or fewer errors on that passage, and (c) retell contents of that story for 30–45 seconds. If any of the three criteria were not met, the student failed to meet the daily reading goal and completed Track B for that day.
that required the student to read each incorrectly read word within a two to five word phrase three times (Begeny & Martens, 2006). Next, the student read the passage again for one minute while the teacher recorded errors. Following this reading, the teacher read the passage aloud with fluency and expression as the student followed along (i.e., the teacher modeled fluent reading of the passage). Last, the student read the passage for a third one-minute timing while the teacher recorded errors. As described, Track A
program sessions requires a student to read a previously read passage one time during the initial assessment and then read a new passage aloud three times.
If the student did not meet all three mastery criteria on the initial reading passage, the student did not move on to a new reading passage. Instead, the teacher followed Track B by modeling fluent and expressive reading of the same passage. Following the modeling component, the student read the passage a second time for one minute while the teacher recorded errors. Next, the teacher implemented the phrase drill error correction procedure for any errors the student made during the second reading. After completing the phrase drill, the student read the passage for a third time while the teacher recorded errors. Finally, the teacher repeated the phrase drill for any errors made during the third reading.
pertinent notes about the session and any procedural steps that the teacher may have recognized she had missed (see Appendix G).
Within each session, a star chart was used as part of a token economy
motivational procedure. During the first session (and repeated in subsequent sessions as a reminder), the teacher showed the student his or her ―Star Chart‖ (see Appendix H) and explained thoroughly how the chart would be used. At the end of each session, the student received stars based on his or her reading performance. The student earned two stars if he or she met the reading goal, and put forth effort on the new passage. The student earned one star if he or she did not meet the reading goal but put forth effort. The star chart consisted of 11 rows of boxes, with 15 boxes per row on a standard 8.5‖ x 11‖ sized page. After the student reached the 15th box on a row, the same process was continued for the subsequent rows on the chart. When the student received a star in the 15th box of a row, he or she was each able to select a small prize (e.g., eraser top, sticker book, pencil, or baseball card) from the prize box. Also, intermittently, two to three shaded boxes were located on each row of the chart and when students earned a star on a shaded box, he or she was able to select a ticket from the ―bonus bag.‖ Each ticket in the bonus bag listed a number of bonus stars the student could earn on their chart.
and its use, along with an overall system of praise and rewards, it was consistent with protocols other fluency-based instructional programs.
Traditional (equal-interval) graphing charts were used as a visual aid for students to monitor their reading progress and also provided teachers a way to give performance feedback to students (see Appendix I). The graphs included words read correctly and incorrectly on the y-axis, and session numbers on the x-axis.
Implementation Integrity
Prior to working with student participants, and as previously indicated, teachers were required to reach mastery criterion based on the implementation protocol. Mastery criterion was set at 100% implementation integrity during two consecutive ―practice‖ sessions (i.e., sessions conducted with coaches playing the role of the student). In addition, all teachers’ implementation integrity was monitored regularly throughout the study with the same procedural protocols used for training purposes. Each teacher received a rating based on her ability to follow the primary procedural protocol and remember important tips and reminders necessary for successful implementation (see Appendix I and Appendix J). At the end of each coaching session, coaches filled out a consultation summary form, which provided important summary information such as length of coaching session, length of student session, and any questions or concerns raised by the teacher or consultant during the session (see Appendix K).
coach due to scheduling conflicts, coaches met with teachers weekly approximately for the first five sessions; however, this was faded to once every two to three weeks when a teacher demonstrated 100% implementation integrity of the primary protocol procedures across three consecutive observations.
Chapter 4: Results Reading Measures Factor Analysis
A principal component analysis (PCA) was used to verify the underlying psychometric structure of the six reading measures used in this study as one unified construct of ―basic reading competence.‖ Pre-test measures from the 59 student participants in the study were analyzed. The measures in the principal components analysis included TOWRE-Sight Word Efficiency (SWE), Fluency, GORT-Comprehension, DIBELS Oral Reading Fluency (DORF), WJ-Letter-Word Identification (LWI), and WJ-Word Attack (WA). This analysis was necessary to verify that the
reading measures were at least moderately correlated (> .60; Tabachnick & Fidell, 2007) so that the outcome analysis (using multivariate analysis of variance; MANOVA) with all measures would be appropriate. If the results of the PCA revealed a measure having less than a moderate relationship with the other measures, it was determined that it be
evaluated in a separate analysis (Tabachnick & Fidell, 2007).
used. The results of this analysis showed an adequate sample for factor analysis (Kaiser-Meyer-Olkin = .764), explaining 67% of the variance as a unified reading construct. Principal components or factor loadings ranged from .871 to .763, which are considered excellent in terms of a pure measure of the factor analyzed construct (Comrey & Lee, 1992). Therefore, these five measures of reading skills were used as a basic reading competence outcome measure of the HELPS Program. GORT-Comprehension was evaluated separately fr as a measure of reading comprehension.
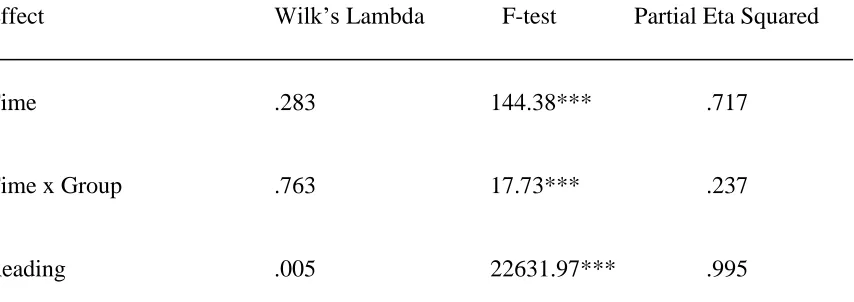
Doubly-repeated Multiple Analysis of Variance
To evaluate the overall differences in basic reading competence from pre-test to post-test when comparing students who received the HELPS Program and students in the control group, a doubly-repeated multiple analysis of variance was used (Tabachnick & Fidell, 2007). A repeated-measures, within-subjects factor of time (i.e., pre-test to post-test) and reading (i.e., the five pre-test reading measures and the five post-test reading measures) by a between-subjects factor of condition (i.e., control group and HELPS group) was the statistical design. The test statistic Wilk’s Lambda was used to determine whether there were significant differences between the control group and the HELPS group. Wilk’s Lambda transforms into an F-statistic and provides a direct measure of the proportion of variance not explained by the group differences. The effect size as
Statistically significant and large effects were found for the changes in overall reading by time and individual reading measures from pre- to post-test, as would be expected provided that all students in schools receive satisfactory reading instruction to make progress in their reading ability. Therefore, evaluating the interaction effects due to the differences between the students who received HELPS and the control group was of particular importance in this study. Specifically, we were interested in determining the effects due to the interaction of the control group and HELPS group with the repeated measures of time, reading measures, and the three-way interaction between time, reading measures, and group. A statistically significant interaction was found between time and group accounting for about 24% of the variance, and there was also a three-way
interaction between time, reading, and group, accounting for 21% of the variance.
Table 1
Doubly Repeated-Measures Multiple Analysis of Variance of Groupa by Timeb and Readingc
Effect Wilk’s Lambda F-test Partial Eta Squared
Time .283 144.38*** .717
Time x Group .763 17.73*** .237
Table 1 Continued
Reading x Group .924 1.11 .076
Time x Reading .155 73.41*** .845
Time x Reading x Group .789 3.60** .211
Notes. Levels of statistical significance: *** at p < .001, ** at p < .01, and * p < .05.
a
Group = Between subjects groups, control (n = 30), and HELPS (n = 29).
b
Time = Within subjects factor Pre-Test to Post-Test.
c
Reading = Within subjects factor of reading including these five measures: TOWRE-Sight Word Efficiency (SWE), GORT-Fluency, GORT-Comprehension, DIBELS Oral Reading Fluency (DORF), WJ-Letter-Word Identification (LWI), and WJ-Word Attack (WA).
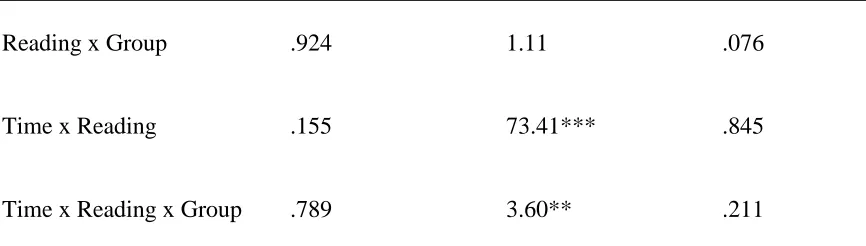
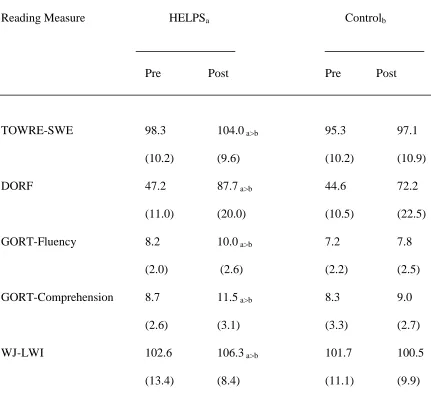
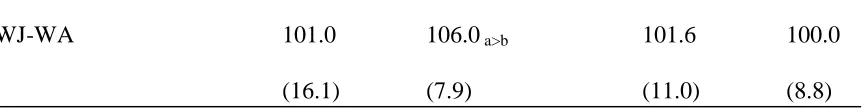
implementation. The means, standard deviations, and statistically significant differences are shown in Table 2.
Table 2
Pre- and Post-Test Means and Standard Deviations by Group
Reading Measure HELPSa Controlb
Pre Post Pre Post
TOWRE-SWE 98.3 104.0 a>b 95.3 97.1
(10.2) (9.6) (10.2) (10.9)
DORF 47.2 87.7 a>b 44.6 72.2
(11.0) (20.0) (10.5) (22.5)
GORT-Fluency 8.2 10.0 a>b 7.2 7.8
(2.0) (2.6) (2.2) (2.5)
GORT-Comprehension 8.7 11.5 a>b 8.3 9.0
(2.6) (3.1) (3.3) (2.7)
WJ-LWI 102.6 106.3 a>b 101.7 100.5
Table 2 Continued
WJ-WA 101.0 106.0 a>b 101.6 100.0
(16.1) (7.9) (11.0) (8.8)
Notes. Post-hoc t-test statistical significance was set at p < .05. Subscripts denote which groups performed reliably higher. Parentheses denote standard deviations.
Post-test t-test comparisons between the control and HELPS group showed statistically significant differences (p > .05) on all five reading measures. These statistically reliable differences between control and HELPS group means included TOWRE-SWE (t = 2.550, p < .014), GORT-Fluency (t = 3.295, p < .002), DORF (t = 2.790, p < .007), WJ-LWI (t = 2.432, p < .018) and WJ-WA (t = 2.766, p < .008).
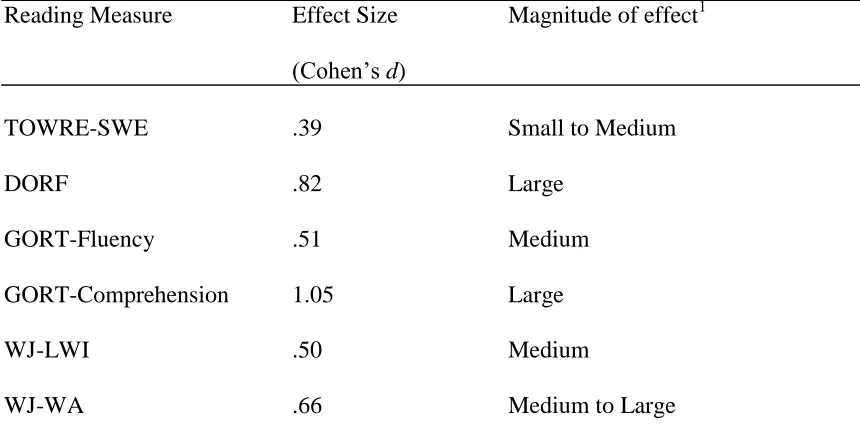
Table 3
Effect Size Comparisons between HELPS and Control Group Across All Reading
Measures
Reading Measure Effect Size Magnitude of effect1 (Cohen’s d)
TOWRE-SWE .39 Small to Medium
DORF .82 Large
GORT-Fluency .51 Medium
GORT-Comprehension 1.05 Large
WJ-LWI .50 Medium
WJ-WA .66 Medium to Large
1
Magnitude of effect was determined by the recommendations set forth by Cohen (1988). GORT-Comprehension. A repeated measures ANOVA, with a within-subjects factor of time (i.e., pre-test to post-test) by a between-subjects factor of condition was used to evaluate possible differences between the HELPS group and the control group on the GORT-Comprehension measure. Wilk’s Lambda was again used to determine
Chapter 5: Discussion
The primary purpose of this study was to evaluate HELPS in a more
―effectiveness-based‖ context rather than a more tightly controlled ―efficacy-based‖ context. This was based on the known importance of reading fluency in early reading instruction, as well as the need for systematically evaluating fluency-based interventions that can be feasibly implemented in elementary school classrooms. The present study primarily differed from an earlier evaluation of HELPS (Begeny et al., in press) in that (a) teachers and teacher assistants (rather than research assistants) implemented the program, and research assistants served as coaches and evaluators of teachers’
implementation integrity; and (b) the present study evaluated HELPS as an intervention for low-performing second grade readers rather than as a supplement to all second-grade students’ core reading curriculum.
Comparisons between the HELPS group and the control group revealed significant differences (from pre-test to post-test) on the measure of basic reading competence, with low-performing students who received HELPS making significantly larger reading gains than students who did not receive the program. Furthermore, post-hoc analyses showed significant differences between the HELPS and the control group, with students in the HELPS group performing significantly better on all reading
and WJ-WA. Overall, findings strongly suggest that HELPS may be a beneficial program to implement with early readers with below average reading skills.
Findings from this study add to the strong body of evidence supporting the effectiveness of fluency-based instructional strategies (e.g., RR, LPP) and motivational strategies (e.g., goal-setting, performance feedback, the star chart reward procedure) for improving students’ reading fluency (Chard et al., 2002; Martens & Witt, 2004; Therrien et al., 2004). Although a considerable amount of research supports instructional and motivational strategies such as RR, LPP, and performance feedback, very little research has evaluated instructional programs that combine fluency-based strategies into one, well-structured and easy-to-implement instructional package. Therefore, this study is distinctive given that it specifically: (a) evaluates a program that integrates fluency-based instructional strategies into one structured program, (b) suggests that HELPS is a
program that can be easily implemented following initial training. This distinction underscores the primary goals in developing of the HELPS Program: to help facilitate a bridge between research and practice and create an effective program that can feasibly be used in schools. Another important result of this study is that it helped to elucidate additional benefits of using the HELPS Program in schools.
Practical Implications
implemented by research assistants as a supplement to all second-grade students’ core reading curriculum. However, this research had not yet answered important questions about the effectiveness of the HELPS Program. For example, the present study helped to show that (a) students can achieve significant reading gains when HELPS is implemented by teachers and teacher assistants rather than research assistants, and (b) HELPS is effective when implemented as an intervention for second grade students with low reading skills.
These findings have important practical implications for educators. Namely, teachers and teacher assistants should be able to implement HELPS Program procedures accurately and consistently with only a reasonable amount of training and coaching in the HELPS Procedures—and doing so should improve struggling readers’ reading skills. This finding also suggests that other educators (e.g., school psychologists, reading specialists, special education teachers, librarians, and well-trained school volunteers) should be able to learn HELPS procedures without much difficulty, thereby increasing the capacity for implementing this program with multiple students in a given school and/or distract.
implemented with a student in a feasible amount of time (i.e., approximately 10 minutes per day, 2 to 3 days per week).
Related to implementation benefits of the HELPS Program, this program is also designed to facilitate high levels of implementation integrity. First, approximately 5-10 hours of training and practice are required to learn how to use HELPS Program materials and implement the program with integrity (Begeny, 2009). Second, teachers are
specifically instructed after each session to self-monitor and record their implementation integrity. This record represents one form of evidence that implementation procedures occurred as intended and it also helped to emphasize the more general purpose of promoting teachers to place a higher value on implementation integrity. Self-reports methods, however, are inherently subjective and limited by possible biases and
oversights. Thus, direct observation, as done by the coaches in the study, helps to ensure the program is being delivered with high levels of implementation integrity (Gresham et al., 1993).