Abstract
ODUOR, KENYA FREEMAN. The Effects of Automated Decision Aid Reliability and Algorithm Modality on Reported Trust and Task Performance. (Under the direction of Eric N. Wiebe.)
As IT systems grow more complex and become more prevalent, understanding the collaborative nature of the relationship between humans and automation becomes more important. Several factors influence the human-automation relationship. Research has shown that trust and perceived reliability are key factors in whether a relationship will develop between humans and automation. Presenting automation reliability and
automation algorithms are ways to potentially improve this relationship. To explore this question, an experiment was conducted in which an automated decision aid presented suggestions to participants while they managed a simulated city (i.e., Policity). The goal was to maximize the health of the city’s population by adding hospitals, housing,
THE EFFECTS OF AUTOMATED DECISION AID RELIABILITY AND ALGORITHM MODALITY ON REPORTED TRUST AND TASK
PERFORMANCE by
KENYA FREEMAN ODUOR
A dissertation submitted to the Graduate Faculty of North Carolina State University
in partial fulfillment of the requirements for the Degree of
Doctor of Philosophy PSYCHOLOGY Raleigh, North Carolina
2006
APPROVED BY:
_______________________________ _______________________________ Eric N. Wiebe, Ph.D. Robert St. Amant, Ph.D.
_______________________________ _______________________________ Denis O. Gray, Ph.D. Rupert W. Nacoste, Ph.D.
Biography
Kenya was born in Pittsburgh, Pennsylvania and moved to the Bronx, New York as a child. She spent most of her childhood in Queens, New York, where she attended
Catholic school through the 12th grade. Kenya attended the University of Maryland, in College Park where she received a Bachelor’s of Science degree in Psychology. After spending several years in the physical therapy field, Kenya pursued a graduate degree in Ergonomics. She attended North Carolina State University in Raleigh, where she
obtained a Master’s of Science degree in Ergonomics and completed the present research as part of the requirement for the Doctoral program in Ergonomics.
Kenya spent most of her graduate school career working as an intern at IBM in Research Triangle Park, North Carolina. The position primarily involved web
application software user interface design. Kenya joined the team at IBM full time, after 4 years as a coop.
Acknowledgements
First and foremost, I would like to thank the Almighty Father. Without Him, none of this would have been possible. It took a great deal of faith and prayer to get through the challenging aspects of graduate school and performing research.
I want to thank my parents for all of their encouragement and prayers. I appreciate each and every sacrifice that you made to help me get here. I will never forget all that you have done for me.
I would like to thank my academic advisor for his guidance and support in helping me successfully complete this research. I would also like to thank my thesis advisor and my formal and informal mentors who have aided in my spiritual, academic, and personal growth over the years.
Table of Contents
Page
LIST OF TABLES……… vi
LIST OF FIGURES………... viii
1. INTRODUCTION….……….. 1
1.1 What is automation?……… 3
1.2 Automation Complexity……….. 9
1.3 Patterns of Automation Usage……… 12
1.4 Overview………. 13
1.5 The Relationship Between Humans and Automation………. 14
1.6 Trust in Automation……… 19
1.7 Trust as a Social Psychological Construct……….. 21
1.8 Algorithms and Mental Model Development………. 30
1.9 Learning and Mental Model Development………. 32
1.10 Visual Representation of Information……… 35
1.11 Impact of Automation Purpose, Process, and Performance on User Trust…. 39 2. METHOD……… 43
2.1 Participants………. 43
2.2 Materials……… 43
2.3.1 Policity……… 43
2.3 Treatment Conditions………. 49
2.4 Procedure……… 49
2.5 Dependant Variables……….. 51
3. RESULTS ………... 55
3.1 HCT Questionnaire Responses……….. 58
3.1.1 Perceived Reliability (R)……….... 58
3.1.2 Faith (F)……….. 59
3.1.3 Perceived Technical Competence (T)………. 60
3.1.4 Perceived Understandability (U)………. 61
3.1.5 Personal Attachment (P)………. 63
3.2 Open-ended Questionnaire Responses……… 65
3.2 Objective Data……… 69
4. DISCUSSION..……… 74
4.1 Practical Implications……….. 83
5. BIBLIOGRAPHY……… 85
6. APPENDICES..……….. 94
6.1 Appendix A: Human-Computer Trust (HCT) Rating Scale (Madsen & Gregor, 2000)……… 95 6.2 Appendix B: Subjective Questionnaire of Understanding of Automation’s
List of Tables
Page
Table 1 Fitts’ allocation of function list adopted from Fitts (1951)..……….…… 5
Table 2 Sheridan-Verplank scale of human-machine interaction from Sheridan & Verplank (1978)………...………. 6
Table 3 Experimental conditions ……….. 49
Table 4 Experimental design ……… 53
Table 5 Users’ patterns of decision aid usage ……….. 53
Table 6 Video game experience ……… 55
Table 7 Ethnicity/race of participants ……….. 56
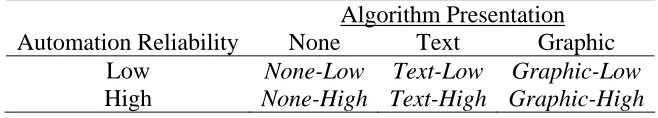
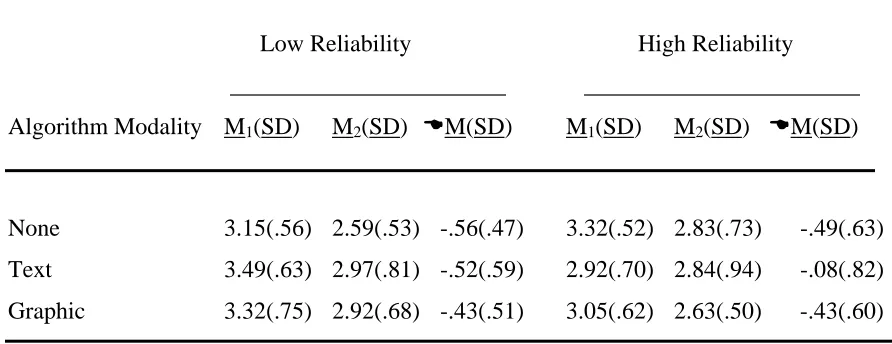
Table 8 Change in perceived reliability (R) of the decision aid for high and low reliability groups by algorithm modality………. 58
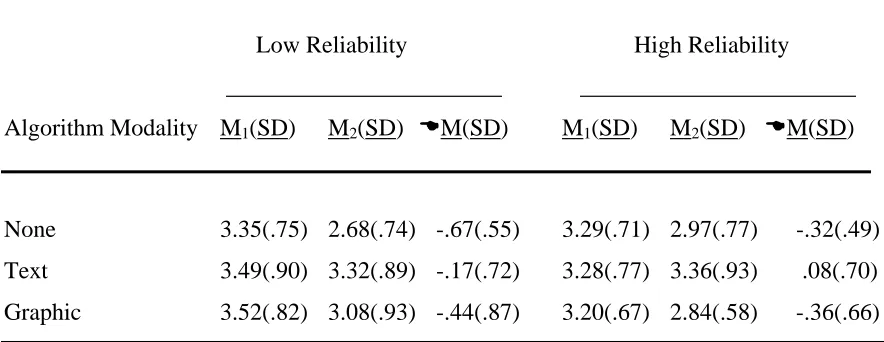
Table 9 Change in faith (F) in the decision aid for high and low reliability groups by algorithm modality from time 1 to time 2 ……… 59
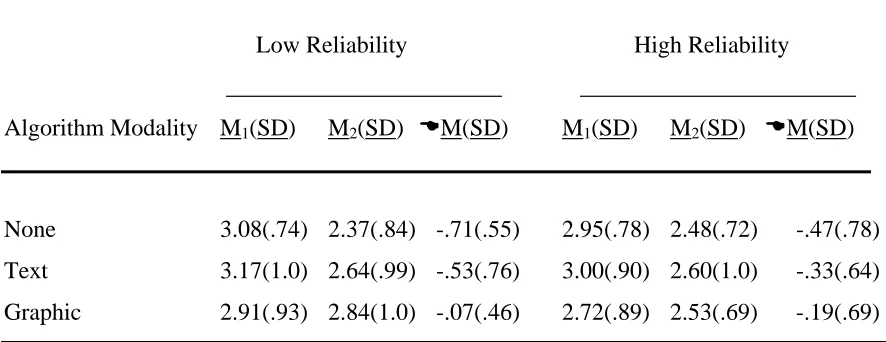
Table 10 Change in perceived technical competence (T) of the decision aid for high and low reliability groups by algorithm modality from time 1 to time 2 …… 60
Table 11 Change in perceived understandability (U) of the decision aid for high and low reliability groups by algorithm modality from time 1 to time 2 ……….. 62
Table 12 Change in perceived personal attachment (P) to the decision aid for high and low reliability groups by algorithm modality from time 1 to time 2 …… 64
Table 13 Open-ended responses to decision aid (DA) usage in percentages …….. 66
Table 15 Open-ended responses on how to improve the decision aid’s (DA) algorithm in
percentages ………... 68
List of Figures
Page Figure 1 Azjen & Fishbein’s (1980) framework of the relationship between trust
and reliance…….……… 25
Figure 2 Policity interface showing the city and buildings (top-left) in San Francisco, the decision aid (center), city, a selected hospital’s properties (bottom-left), and city’s properties……… 44 Figure 3 Decision aid algorithm representations for no algorithm (right), graphical
(center), and textual (left) modalities………. 48 Figure 4 Number of suggestions provided by the decision aid for each experimental
session ……… 70
Figure 5 Mean number of suggestions executed by participants for high and low
reliability groups by algorithm modality ……… 71 Figure 6 Mean health levels for participants based on DA trust levels and usage
Introduction
Oliner & Sichel (2002) provided estimates of the growth in productivity in the United States economy and attributed the acceleration in labor productivity after 1995 to the greater production and use of information technology (IT). They felt that the future economic increases would depend on the extent to which products embodying IT diffuse through the economy.
Automating aspects of the IT infrastructure can make this technology more marketable as well as more usable. Automating key aspects of IT can improve
availability, security, complexity and the management of functions. Automation is not a new concept. However, the utilization of automation in IT, more specifically software applications, is an emerging technology that is experiencing growing pains. Automation involves a shift of control from the user to the IT, and therefore, requires some amount of trust. The development of trust is essential in one’s relationship with emerging
technologies. Once an exchange takes place between automation and its user, the development of trust may or may not begin. This is dependant upon the nature of the interaction and the production of desired outcomes. Like a new romance, the initial exchange between the automation and the user are what determine if the interaction will continue. Therefore, it is important that one has a positive experience with the
automation.
step-by-step problem solving procedure, or algorithm (advice), is one way of exposing that information making it more transparent to the user. The ways in which algorithm transparency help develop this relationship remains to be seen.
The complexity of automation continues to increase. Recent polls showed that approximately 75% of people in the United States feel that life is too complicated and that technology contributes to this complexity in a significant way (Reeves, 1999). As software automation becomes more prevalent, the development of an appropriate relationship between humans and automation is necessary for the technology to be successfully implemented. The present research will investigate the following aspects of the human-automation relationship:
1. Prior to the development of a relationship with automation, is a human’s interaction with automation simply a stimulus-response pattern?
2. Does the presentation of automation’s algorithm assist in the development of an appropriate mental model?
3. Does mental model development help facilitate the growth of an appropriate relationship as measured through trust and appropriate usage?
What is Automation?
Automation is defined as technology that actively selects data, modifies information, makes decisions, or manages processes (Lee & See, 2004). Automation involves a shift in the allocation of function from a human to an automated system or machine.
Technology of this kind has tremendous potential to extend human performance, because it transfers functions from a human operator to an automated system. Automation has been implemented in a variety of systems. It can be found in environments as diverse as motor vehicle operation, process control, and information retrieval systems.
Several categorizations of automation exist. The first form of automation executes or controls actions (e.g., levers that control physical processes). This type of automation includes thermostats, cruise control, and power steering (Dougherty, 2003). This form of automation also involves product flowing through a physical process (e.g., a
manufacturing process). Within this type of automation there are varying levels of human operator control that ranges from directing manual control, to directing automatic control, to directing multiple levels of automatic control (Llinas, Bisantz, et al., 1998).
An additional function of automation is to present data or advice to human operators. This executive or control automation aids an operator in decision-making and problem solving. Automated decision aids (DA) gather information from the environment,
is an example of this form of automation (Dougherty, 2003). For the purposes of this research, the focus will be on automated decision aids.
Kelly et al. (2001) maintain that for something to be considered automation it must not simply include an improvement to the technology, but it must also involve a change in the allocation of function from the human operator to the automation. Additionally, the perception of what is automation changes over time. Parasuraman and Riley (1997) assert that when a reallocation of function from human to machine is complete and permanent, then the function will be perceived as a machine operation, not as automation, making today’s automation, tomorrow’s machine. It is customary to assign a given level of automation to an automated system. This can be problematic in systems that are not necessarily unitary entities. An automobile contains varying levels of automation in its discrete subsystems. Because this system may have several different subsystems with varying levels of automation, assigning one level of automation to the entire system may be a problem. In this instance, it is not clear how to label the level of automation of the entire system.
The functions performed by automation vary greatly from system to system. Several taxonomies have been developed to help categorize the levels of automation and the allocation of function to the human operator and the automated system.
Table 1
Fitts’ Allocation of Function List adopted from Fitts (1951)
Property Machine Human
Speed • Much superior • Lag one second
Power • Consistency at any level • Large constant standard forces
and power available
• 2 HP for about 10 seconds • 0.5 HP for a few minutes • 0.2 HP for continuous work
over a day Consistency • Ideal for routine, repetitive, or
precision tasks
• Not reliable; should be monitored
• Subject to learning and fatigue
Complex Activity
• Multi-channel • Single channel
• Low information throughput Memory • Best for literal reproduction and
short term storage
• Large store multiple access • Better for principles and
strategies Reasoning • Good deductive power
• Tedious to re-program
• Good indicative power • Easy to re-program Computation • Fast accurate
• Poor error correction
• Slow, subject to error • Good error correction Input (sensing) • Some outside human sense
range: i.e., non-visible electromagnetic radiation • Insensitive to extraneous
variables
• Poor pattern recognition
• Wide range (1012) and variety of stimuli dealt with by one unit
• Affected by heat, cold, noise, and vibration • Good pattern detection • Low signal detection • Good signal discrimination
with high noise levels Overload
reliability
• Sudden breakdown • Graceful degradation Intelligence • None
• Incapable of goal switching or strategy switching without specific directions
• Can deal with the unpredicted • Can anticipate • Can adapt Manipulative
abilities
Fitts’ work would later experience criticism. Moray, Hiskes, Lee, & Muir (1995) felt that Fitts’ list wrongly characterized function allocation as a one-time activity that is complete once a system has been designed and implemented. Fitts’ list has limited utility in engineering design because it is too qualitative, too general, and lacks fit with
engineering concepts. Fitts’ list may be useful early on in the automation design process. Sheridan and Verplank (1978; cited in Levis, Moray, & Hu, 1994) introduced the first categorization of automation levels that described the interaction between humans and machines (see Table 2). The Sheridan-Verplank Scale of Human-Machine Task
Allocation (SVL) was designed to describe the task allocation between the human and the automated agent. It was supposed to assist engineers with determining the appropriate level of automation for a human-machine system.
Table 2
Sheridan-Verplank Scale of Human-Machine Interaction from Sheridan & Verplank (1978)
Sheridan-Verplank 10 Levels of Human-Machine Function Allocation
1. The human does all the planning, scheduling, optimizing, etc. and turns tasks over to computer for merely deterministic execution.
2. Computer provides options, but human chooses between them, plans the operations, and then turns the tasks over to the computer for execution.
3. Computer helps to determine options, and suggests one for use, which the human may or may not accept before turning task over to the computer for execution.
4. Computer elects options and plans actions, which human may or may not approve, computer can reuse options suggested by human.
5. Computer selects action and carries it out if human approves.
6. Computer selects options, plans and actions and displays them in time for the human to intervene, and then carries them out in default if there is no human input.
7. Computer does entire task and informs human of what it does. 8. Computer does entire task and informs human only if requested.
9. Computer does entire task and informs human if it believes the human needs to know. 10.Computer performs entire task autonomously, ignoring the human supervisor who
Moray, Inogaki, & Itoh (2000) group these ten levels into 3 clusters. In the first five levels, humans are the decision-makers and controllers of the automation. Dynamic collaboration between the human and the machine exists in levels 5 to 7. Systems with automation described in levels 7 to 10 are considered fully automated. Automation at the highest level is able to act autonomously without human intervention.
Parasuraman, Sheridan, & Wickens (2000) utilize a four-stage model of human information processing to devise four functions that must be accomplished to perform most tasks:
1. information acquisition; 2. information analysis;
3. decision and action selection; 4. action implementation.
Since these functions are performed by a human or by automation at various levels, Parasuraman et al. (2000) considers that most human-automation systems consider a mix of levels of automation across the four stages. For example, one system might have a high level of automation across all four sub-functions, and a second system might be highly autonomous in information analysis, but fairly low on the other three functions. According to this model, a parent task is broken down into abstract sub-tasks based on the information processing stages.
automation does not merely shift responsibility for tasks but it can also change their nature. Task decomposition means that sub-tasks may be added as well as eliminated.
Human-computer systems in which the “division of labor” between the human and machine is dynamic, rather than fixed, are referred to as adaptive automation (AA). AA or dynamic function allocation has been categorized as human-centered automation when compared to traditional technology-centered automation. Some of the benefits believed to be associated with AA include alleviation of a loss of situation awareness (SA), of mental workload, and of out-of-the-loop performance issues (Kaber, Riley, Tan & Endsley, 2001). Situation awareness is defined as “the perception of the elements in the
environment within a volume of time and space, the comprehension of their meaning and
the projection of their status in the near future” (Endsley, 1988, p.97). Situation awareness involves perceiving critical factors within the environment (Level 1 SA), comprehending those factors, particularly when they are integrated with one’s goals (Level 2 SA), and at the highest level, understanding what will take place in the system in the near future (Level 3 SA). A theory of human-centered automation closely related to AA asserts that automated systems should be designed to support operator achievement of SA through significant involvement of operators in control processes (Endsley, 1995b, 1996; Kaber & Endsley, 1997). Human involvement may occur at intermediate levels of automation (LOA) or through AA. At intermediate LOA, the human may be more
awareness because it has been found to be critical to human performance in automated system processes (Endsley, 1995a).
Automation Complexity
Automation can be characterized as complex for a number of reasons. Complexity may exist because of a number of interrelated components, operation under many different modes, varying levels of automation in discrete subsystems, and complex algorithms. One or more of these and other phenomena can add to a system’s complexity. Complex automation increases the likelihood of cognitive complexity (Reeves, 1999). Reeves (1999) defines cognitive complexity (CC) as a reference to external elements that contribute directly to our neural load, and in doing so reduce our capacity to think clearly and comprehend. External factors that make things hard to grasp, hard to comprehend, and hard to use and see create CC; it contributes to an increase in neural load and makes it difficult to learn, make decisions, and solve
problems. Similarly, high complexity issues also make it difficult for the automation to extend the performance of the human in the system. Complexity makes it more difficult to find the right computer-based operations that will eventually lead to the correct solution. When complex automation replaces the human in some or all of the tasks of completing goals in a particular problem set, the automation and its interface become a part of the problem and consequently add to the CC. Reeves (1999) states that problems that are complex in nature may possess any number of the following issues:
2. Multiple goals: With multiple goals, some may be contradictory, and trade-offs are required.
3. Complexity of the situation: This may conflict with the limited capacity of the problem solver to think it through.
4. Connectivity: Complex problems often contain a high degree of connectivity or interrelationship. In other words, it is very difficult to anticipate all the possible consequences of a given situation.
5. The dynamic nature of complex problems: In other words, complex problems can worsen, creating great time pressure and unpredictability.
6. Time delay: In complex problems, there can be a delay between the action taken and the response or the appearance of consequences. This places an extra burden on the problem solver.
Funke (1991) provides a list of elements to simplify complex problems which includes:
1. Greater availability of information about the problem; 2. Precision of the goal definition;
3. A condensed number of variables, degrees of connectivity, and the linear relationships between them; and
4. The stability of the properties of the problem or time dependencies in the course of the problem-solving process
Lieberman (1997) defines automation, more specifically automated software, as any program that can be considered by the user to be acting as an assistant or helper.
depending on their view of how the automation is acting. Having automation work directly in the user interface rather than as a background process increases the extent to which the user will perceive the software as acting like an assistant. The automated software will also be seen as an assistant in instances where the user perceives the automation’s actions as actions that he or she could have done on their own.
Software, unlike other engineering artifacts, is pure design. Its unreliability is always the result of design flaws, which arise from human intellectual failures (Littlewood & Strigini, 2000). In comparison, the unreliability of hardware systems is seen to be the result of random physical failures of components. Current reliability theories have successfully allowed hardware systems to be built to high reliability requirements, and the final system reliability to be evaluated with acceptable accuracy. Presently, many of these systems have come to rely on software for their correct functioning, making the reliability of software even more important. The problems with software automation reliability are a result of the difficulty and novelty of the problems that are tackled, the complexity of the resulting solutions, the need for short development cycles, and the difficulty in gaining assurance of reliability because of the inherently discrete behavior of software systems. It is particularly difficult to gain assurance of the reliability of
Patterns of Automation Usage
Automation use decisions are based on a complex interaction of many factors and are subject to strongly divergent individual considerations. Attitudes toward automation vary widely among individuals (Helmreich, 1984; McClumpha & James, 1994). Recognizing these attitudes – positive and negative, general and specific – is the first step toward understanding human use of automation. Use refers to the voluntary starting or stopping of automation by human operators. Factors affecting one’s ability to monitor automation influences use, includes automation reliability and consistency, workload, and the
saliency of automation state indicators. Automation use is also influenced by trust, mental workload, and risk, but individual differences and interactions between factors make prediction of automation use difficult.
Overview
As key aspects of systems become more highly automated, it is increasingly important that the human’s interaction with these systems be well understood. System and machine automation are not new. However, there are many aspects of software-based automation that are still flawed. With the persistence of software reliability issues, the addition of automation increases complexity and increases the potential for automation misuse, disuse, or abuse to arise. The human’s development of trust in the automation is essential to appropriate usage. Therefore, ways to improve the trust relationship must be found. One way to potentially increase user trust is to make the automation’s algorithm transparent to the user. Not making the automation’s algorithm transparent can lend to complexity because of the limited ability of variables that can be directly observed (Reeves, 1999). Presenting the automation’s algorithm may help increase one’s
The Relationship Between Humans and Automation
Similar to an interpersonal relationship, one must get acquainted with automation in order to develop an appropriate human-automation relationship. One must have a
positive perception of the relationship with automation in order to allow it to assist in task completion. Prior to the development of this relationship, automation use may be based on a simple exchange, similar to the stimulus-response model of behaviorism (Schwartz, B., Wasserman, E.A., & Robbins, S.J., 2002). If a user has no prior experience with or perception of a certain type of automation, in a sense, actions can be explained entirely as responses to stimuli. Observable behavior may be the only suitable measure of the human-automation relationship until the user has had sufficient interaction with the automation to form an opinion about its capabilities and its role.
Reeves & Nass (1996) maintain that humans respond socially to technology and responses to computers can be analogous to reactions to human collaborators. There is a phenomenon in social psychology known as the similarity-attraction hypothesis. The hypothesis states that people with similar personality traits will be attracted to one another (Nass & Lee, 2001). Some people develop this sort of attraction to technology, such as automation.
influence human-human relationships may also contribute to the relationship between humans and automation.
Anthropomorphization involves “attributing human characteristics to non-human phenomena” (Guthrie, 1993). Nass et al. (1995) found that subjects could be persuaded to behave as if computers were human, even though users knew they were not. There is a tendency to believe that the human brain is like a computer and therefore computers can also have human qualities (Muir 1988).
Caporael (1986), Nass, Steuer, Tauber, & Reeder (1993), Reeves & Nass (1999), and Watt (1997) maintain that the anthropomorphization of technical devices or animals is a common phenomenon. Even if a person is aware that they are addressing an inanimate object, the anthropomorphization persists. Several studies support the notion that the interaction with computers is primarily social in nature (e.g., Nass, Steuer, & Tauber, 1994; Takeuchi & Ketagiri, 1999), even if the amount and mode of computer use is moderated by other factors (e.g., attitudes toward computers or computer skill level; Levine & Donitsa-Schmidt, 1998).
Similar to human-human interaction, users that perceive automated software to be more reliable than manual operation are more likely to place greater trust in the automated system, and rely on it. If the automated system is truly more reliable than manual operation, appropriate automation use will take place. However, when users inaccurately estimate the reliability of the automation or their manual operation, then inappropriate automation reliance may occur (Pomranky, Dzindolet, & Peterson, 2001).
outcome of the decision making process has been named the “perceived utility” of the automated system and is expected to be directly related to the trust of the automated aid and subsequent use, misuse, disuse, or abuse (Dzindolet, Pierce, Beck, & Dawe, 2000).
The perceived utility of the automation will be most accurate when the actual ability of the automation and the actual ability of the manual operator are compared.
Unfortunately, the actual reliability of the automated aid and the manual operator are unlikely to be perceived accurately by the user. Realistically speaking, biases and errors are likely to occur. The greater the biases and errors, the more likely disuse and misuse are to appear (Pomranky et al., 2001).
Users often expect and predict near-perfect performance from automation. This sort of expectation can lead to disuse of the automation it if does not perform as expected. Prior to interaction, users often have a schema regarding automation that it should be perfectly reliable and accurate. It is this schema that leads users to expect perfect performance from the automation. Cognitive psychologists have found that information inconsistent with a schema is likely to be remembered and will greatly influence
information processing (Smith & Graesser, 1981; Ruble & Stangor, 1986).
When a user is presented with a simple task, promptly decides a course of action, and makes a decision with a high degree of confidence, the user assumes the automation will be in agreement. When the automation reaches an opposing decision, the user is likely to detect the obvious error just committed by the automation and will question the
When events occur that are in direct opposition to a user’s original expectation, the user will be more likely to remember the event. Pomranky et al. (2001) assert that errors committed by the automated aid are inconsistent with the user’s schema that the
automation is accurate and reliable. Therefore, every error made by the automation is likely to be highly salient. As the task progresses, it may be difficult for the user to maintain an accurate picture of the aid’s reliability. The contradictory information may be exaggerated and prominent in one’s mind resulting in a distorted negative view of the automation’s ability. This may lead the user to underestimate the automation’s
performance. Consequently, an equally salient form of advice or feedback is necessary to overcome the effects of the inconsistencies.
Lee & Moray (1992) defined the factors that influence the development of trust and an appropriate relationship between humans and automation. They determined
performance, process, and purpose as the bases of trust in automation.
Performance is the past and present operation of the automation that includes characteristics such as ability, reliability, and predictability. Performance information defines what the automation does and refers to the expertise and capability as
demonstrated by its ability to accomplish the user’s goals. Like Sheridan’s (1992) concept of robustness as a basis for trust in automation, performance demonstrates the task-dependant nature of trust. When automation performs in a manner that reliably accomplishes user’s goals, it is likely to be trusted.
behaviors and toward the characteristics and attributes of the automation. In other words, trust is shifted from the specific actions of the automation to the automation itself.
In the context of automation, algorithm presentation is the process basis of trust. This is similar to Sheridan’s (1992) notion of understandability of one’s relationship with automation. Users tend to trust automation if its algorithm can be understood and is a feasible means of achieving the user’s goals in a given situation.
Purpose is the extent to which the automation is being used within the domain in which it was designed as intended. Purpose explains why the automation was created. Like benevolence and faith, purpose shows the perception that the user has a positive orientation toward the automation. The development of this relationship will depend on whether the designer’s intent has been clearly communicated to the user. If so, there is a tendency for the user to trust that the automation will achieve the goals it was designed to achieve.
Trust in Automation
A number of definitions of trust exist. A universal definition has yet to emerge. One definition of trust asserts that it is the attitude that an agent will help achieve an
individual’s goal in a situation that is vulnerable or uncertain. In this definition, an agent can be another person or automation that dynamically interacts with the environment on behalf of the individual. Substantial human-human interaction research has shown the importance of the attitude of trust in mediating how people rely on each other (Deutsch, 1958; Rempel, Holmes, & Zanna, 1985; Ross & LaCroix, 1996; Rotter, 1967).
decision aids as the extent to which a user is confident in, and willing to act based on the recommendations, actions, and decisions of an artificially intelligent agent. Moray & Inagaki (1999) define trust in automation as an attitude which includes the idea that the collaborator will perform as expected, and can, within the boundaries of the designers’ intentions, be relied upon to achieve the design goals.
Lee & See (2004) assert that trust guides, but does not entirely determine reliance. A large body of current research exists on the topic of trust and reliance, however it has produced many contradictory and confusing findings.
Despite contradictory findings, it is clear that the development of trust in automation is important to its rate of adoption. Rate of adoption is the relative speed with which an innovation (e.g., an automation tool) is adopted. A number of attributes of an innovation affect its rate of adoption. The relative advantage is the degree to which an innovation is perceived better than its predecessor, in this case, manual control. The relative advantage of automation will be apparent only if it assists a user in performing a task rather than complicates it. Compatibility is the degree to which the innovation is perceived as consistent with past experiences, existing values, and the needs of potential adopters. If automation succeeds in incorporating the values, needs, and beliefs of users, it is more likely to be adopted. The degree to which an innovation is perceived as relatively difficult to use and understand is complexity. Finding ways to minimize the complexity of the interaction with automation is essential to its adoption (Rogers, 1985).
awareness (Endsley, 1996), or effectively adjusting the automation’s state (Lee & Moray, 1992). Because of the uncertainty that a relationship with automation presents, it is necessary to develop appropriate levels of trust.
Trust as a Social Psychological Construct
There are a number of theories on trust as a social psychological construct. Several theorists provide definitions on the basis of close relationships in the interpersonal trust domain. Thibault & Kelley (1959) developed a theory of how people decide what to do in their relationships. The Social Exchange Theory, is a theory based on an individual’s exchange of rewards and costs that quantifies the values of outcomes from different situations. The outcome of an interaction is the combination of rewards and costs. People attempt to minimize costs and maximize rewards, and then base the likeliness of developing a relationship with someone on the perceived possible outcomes. When the outcomes are perceived to be positive, an individual will disclose more and develop a closer relationship with that other person. Boon & Holmes (1991) define trust as a state involving confident predictions of another’s motives in situations that entail some level of risk.
A definition of trust from an organizational theory perspective, defines trust as an individual’s willingness to be vulnerable to the outcomes of another party based on the expectation that the other will perform a desired action, regardless of the ability to monitor or control the other party (Mayer, Davis, & Schoorman, 1995).
interpretation of new information. The individual context also includes an individual’s experiences that have led to a particular level of trust (Lee & See, 2004).
Individual differences are what make some people more inclined to trust than others (Gaines, Panter, Lyde, Steers, Rusbult, Cox, et al., 1997; Stack, 1978). Rotter (1967) identified trust as a persistent personality trait. This definition of trust follows a social learning theory approach, in which expectations for a given situation are determined by previous experiences with situations that are perceived to be similar (Rotter, 1971). People form beliefs about others that are generalized and taken from one interaction to the next. In this case, trust is a generalized expectancy that is independent of a specific situation. Instead, it is based on the generalization of a considerable number of diverse experiences. Individual differences regarding trust have strong implications for the study of human-automation trust because they may impact reliance in ways that are not related to the characteristics of the automation.
Considerable evidence shows that the tendency to trust, considered as a personality trait, can be measured reliably and can influence behavior in a systematic way. Rotter’s (1980) Interpersonal Trust Scale distinguishes people on their inclination to trust others. Rotter (1971) found that individuals with a high level of trust are seen as more
The previous findings may explain why individual differences and the general propensity to trust automation (as measured by a complacency scale; Parasuraman, Singh, Molloy, & Parasuraman, 1992) are not obviously related to misuse of automation. Singh, Molloy, & Parasuraman (1993) found that high-complacency individuals detected more automation failures in a constant reliability condition (53.4% compared with 18.7% for low complacency individuals). Wiener (1981) defines complacency as a
psychological state characterized by a low index of suspicion. The condition is a result of working in environments with highly reliable automation, in which the operator serves as a monitor of system states looking for occasional automation failure. Complacency is exhibited as a false sense of security, which the operator develops when working with highly reliable automation; however, no machine is perfect and has the potential to fail without warning. Studies have shown that automation-induced complacency can negatively affect an operator’s ability to monitor an automated system (Parasuraman, Molloy, & Singh, 1993). This unexpected outcome is similar to findings in studies of interpersonal trust, in which highly trusting individuals were found to trust more appropriately. A number of studies of trust in automation show that some peoples trust changes drastically as the automation’s capability changes and for other people trust changes minimally (Lee & Moray, 1994; Masalonis, 2000). One possible explanation is that high-trust individuals may better adjust their trust to situations where automation is highly capable as well as to situations in which it is not.
relationship progresses (Rempel, et al. 1985). Individual differences influence the predisposition to trust when a situation is new or ambiguous and generalizations dominate. Individual differences become less important as the relationship evolves (McKnight, Cummings, & Chervany, 1998). Trust as an attitude is a history-dependant variable that depends on the prior behavior of the trusted person and the information that is shared (Deutsch, 1958). The initial level of trust is determined by past experiences in related situations; some of these experiences may be indirect, as with gossip.
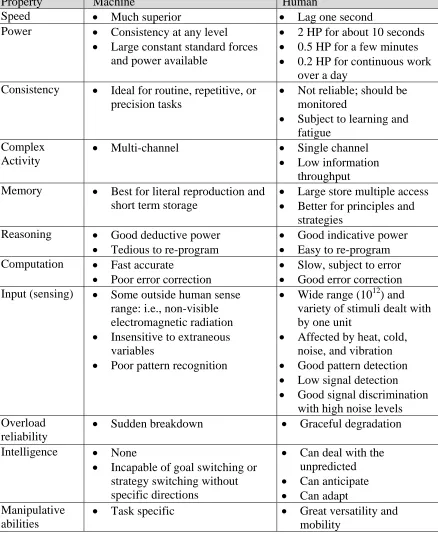
A framework developed by Azjen & Fishbein (1980; Fishbein & Azjen, 1975) helps to reconcile the conflicting definitions of trust. Their framework describes how
behaviors result from intentions and that intentions are a function of attitudes. Beliefs are the basis for attitudes. According to their framework, perceptions and beliefs
characterize the information base that determines attitudes. The availability of
information and the individual’s experiences influence beliefs. When considering trust and reliance, trust is an attitude and reliance is a behavior. The framework keeps beliefs, attitudes, intentions, and behaviors distinct and can help describe the influence of trust on reliance. Trust affects reliance as an attitude rather than as a belief, intention, or
behavior. Beliefs are the basis for trust, and various intentions and behaviors may result from different levels of trust. The framework and its relationship to trust and reliance are depicted in Figure 1.
be influenced by the extent to which it does what it is expected to do to complete the task for which it was designed.
Beliefs
Attitudes
Intentions
Behaviors
Perceptions
Trust
Objectives
Reliance
Figure 1. Azjen & Fishbein’s (1980) framework of the relationship between trust and reliance.
Boehm-Davis, 1998). No single level of reliability can be recognized as the cause for distrust and disuse. Trust depends on the consequence, timing, and expectations associated with failures of the automation (Lee & See, 2004).
Self-confidence is a particularly important variable that interacts with trust to
influence automation reliance. Self-confidence is an important factor in general decision-making (Bandura, 1982) and more specifically, in mediating the effect of trust on reliance (Lee & Moray, 1994). When a user’s self-confidence is high and trust in the system is low, they are more inclined to rely on manual control. Alternatively, users with low self-confidence are more inclined to rely on the automation (Lee & Moray, 1994). Riley (1996) compared students and aircraft pilots in a function allocation task. Students had a tendency to have a greater level of self-confidence and were less inclined to allocate tasks to automation, which they tended to distrust. The pilots, who were more accustomed to using the automation, trusted and relied on the automation more than the students. Thus, appropriate reliance on automation can be strongly affected by biases in self-confidence (Lee & See, 2004).
automation are predicted not just on our knowledge and beliefs about it, but on how it makes us feel.
Lewandowsky, Mundy, & Tan (2000) found that the delegation to automation was different than the delegation to human collaborators. They found that the delegation to the humans, but not to automation, is dependent upon people’s assessment of how others perceive them: People are more likely to delegate if they perceive their own
trustworthiness to be low. They also discovered the degree of trust is more strongly related to the decision to delegate to the automation, as compared with the decision to delegate to the human. One possible explanation for these results is that users may perceive the final responsibility in a human-automation partnership to lie with the user, whereas individuals in a human-human partnership may perceive the ultimate
responsibility as being shared. Similarly, people are less likely to disuse human aids than they are automated aids, even though self-reports imply a preference for automated aids (Dzindolet, Pierce, Beck, & Dawe, 2002).
However, trust in automation can follow an opposing pattern, in which faith is important early in the interaction, followed by dependability, and then by predictability (Muir & Moray, 1996).
The process by which trust in automation develops over time is similar to the way trust develops in the interpersonal domain. In the interpersonal domain, trust is seen to develop over time, and generally as the product of prolonged interaction with other people (e.g., Rempel et al., 1985). Muir (1994) agrees that in models of trust in automation, trust is also seen to develop over time and because of the same processes inherent in interpersonal trust (faith, dependability, and predictability). Subtle shifts in trust have been exhibited in response to the properties and performance of automation (Muir, 1989). When the automation performed reliably, operator trust increased over time. However, when the automation performed unreliably, trust quickly decreased. Trust in automation appears to be dynamic like that of interpersonal trust.
Studies of human-automation trust (e.g., Muir & Moray, 1996) show that it is possible to quantify the subjective degree of trust experienced by users and to track meaningful changes in trust over time. Khasawneh, Bowling, Jiang, Gramopadhye, & Melloy (2004) sought to discover methods and metrics for the measurement of trust. The approach they followed illustrated that trust can be mathematically predicted by knowing system errors, an objective approach which provides a more accurate measurement of human trust.
Masalonis (2003) adapted Cohen, Parasuraman, & Freeman’s (1998) model that predicts that training on the factors affecting reliability should lead to more appropriate trust assessments. Training was not found to affect overall performance, but it was found to impact bias. Trained individuals were more likely to report both real and perceived conflicts, possibly because knowing the automation had variable reliability led them to be more cautious overall. The trained individuals were more likely to unquestioningly accept the automation’s judgments, which was generally the appropriate decision. This indicated that the training enabled users to capitalize on the workload savings provided by reliable decision aids, without a performance decrement.
Algorithms and Mental Model Development
When time does not permit adequate training or training is not available, presenting pertinent information about the automation is necessary. Presenting information graphically converts it to a form that is more easily processed by the user, aiding the necessary mental analysis and synthesis of the information (Bertoline & Wiebe, 2003). Information regarding the automation’s capability can be defined in terms of detail and abstraction. Abstraction refers to information regarding the automation’s performance, purpose, and process. Detail is the functional specificity of the trust. Detail specifies whether trust is focused on the mode of the automation, the automation as a whole, or a group of automated components (Lee & See, 2004). The automation’s algorithm is capable of conveying this particular information and facilitating the development of an appropriate mental model. If this information is not available in the user interface or if it is not properly formatted, trust may not develop appropriately. Algorithms have the greatest utility in instances where problems are highly structured and well defined. Unfortunately, it is often the case that no algorithm exists or the algorithm is so cumbersome that it would be of no real help to use it.
An algorithm, or conceptual model, of a system is created to provide an appropriate representation of the target system. Conceptual models are created with the intention of being accurate, consistent, and complete (Norman, 1983). Conceptual models are created as tools for the understanding or teaching of physical systems. Mental models are what people have in their heads and what guide their use of a system. Ideally, there ought to be a direct relationship between the conceptual model and the mental model (Norman, 1983).
Norman (1983) characterizes mental models as naturally evolving models. Mental models enable users to predict the operations of a particular system. Reeves (1999) define mental models as a version of a knowledge structure, found in long-term memory that contains the understanding of a topic or procedure. In user-centered design, one of the key design and performance goals is to facilitate the development of a mental model of how the system or application performs. Through interaction with a system, users formulate mental models of that system. The models do not have to be technically accurate, but they must be functional. A person’s mental model will continue to be modified as they interact with the system in order to get a workable model. Mental models are limited by the user’s technical background, previous experience with similar systems, and the structure of the human information processing system. Norman (1983) reported a few general observations about mental models:
1. Mental models are incomplete.
2. User’s abilities to “run” their models are severely limited.
3. Mental models are not stable. People forget the details of the system they are using.
5. Mental models are not “scientific”: People maintain behavior patterns, or heuristics, even though they know they are used because they require little physical effort and save mental effort.
6. Mental models are parsimonious: Oftentimes, users do extra physical operations rather than the mental planning that would allow them to avoid those actions.
People’s understanding of the devices and systems they interact with is surprisingly inadequate, imprecise, and full of inconsistencies, gaps, and personal quirks. Users often feel uncertain of their own knowledge – even when it is correct and complete – and their mental models include information about the degree of certainty they feel for their knowledge. A person’s mental model can include heuristics even if they make no sense (Norman, 1983). Heuristics are problem-solving procedures that often work in solving everyday problems. A heuristic is a rule-of-thumb or guideline for coming up with a solution (Best, 1989).
Learning and Mental Model Development
An interface can be a gateway to learning or a severe barrier (Reeves, 1999). The layout of information determines the ease with which the human visual system can navigate around the display. Edward Tufte (1990, 1997) is known for using information design to convey ideas about things that are not materially in our presence. This is achieved by inducing (in graphical form) an appropriate mental representation of the ideas and concepts. Effective design represents concepts or objects by supplying only essential elements that are most characteristic of the concepts or objects.
others (Adelson, 1981). The extent of convergence of knowledge structures may depend on the individual’s perspective on learning. Previous research has shown that if
individuals experience the same problem-solving task via different visual interfaces, the knowledge structures may develop systematically different as a result of the different perspective one gets from the interface (McDougall, et al., 2001).
Design that is focused on the user, is concerned with the active and explicit
construction of stable, long-term mental models of topics or procedures that may or may not involve representations of images (Reeves, 1999). Learning and the development of mental models has been studied extensively in the context of work on expert knowledge. As one becomes more competent in a particular domain, one develops a richer model of the subject. A key difference between the way an expert and a novice reason is found in the structure of their mental models. Novices’ mental models represent objects and concepts as they are seen in the real world, whereas experts construct more abstract models (Reeves, 1999).
There are three kinds of learning one might engage in while gaining an understanding of a new system. The first type of learning involves establishing a connection between the structure of the device, in this case automation, and its function. The second type entails making the structure-function connection more robust by making implicit
assumptions explicit. Finally, the last is the “caching” or the storing, of the results of the projection problem solving on the inherent mechanism (de Kleer & Brown, 1983).
place, connecting the structure and function of the automation. Producing this connection is also known as “constructing a mechanistic mental model of the device.” A user’s preliminary mental model includes many implicit assumptions that may or may not be correct. As the learning process progresses, the user identifies and makes explicit many of the assumptions. Progress is made by discovering violations of the consistency, correspondence, and robustness. Violations to the robustness may be encountered in situations where the mental model fails to explain the system’s behavior (when the system is experiencing a fault or causality), or by observing the results of a hypothetical modification to the model that results in contradictory results. Every time violations of this type take place, the user has a chance to identify an underlying or implicit
assumption in one of his mental models. The thrust for the second type of learning is to increase the robustness of the mental model by making the implicit assumptions explicit.
As the component models of a machine get stripped of their implicit assumptions about the overall functioning of the automation, the problem-solving work performed by projection increases. A component model is a description of the input-output behavior of a particular component. The third form of learning concerns a technique for preserving this “work” so that it can be evoked only when needed and otherwise remain transparent. In other words, the user can cache the results of projection (specifically problem-solving) by noting the aspects of the component models that were actually used in the
be linked to their embedded assumptions, which act as caveats, whereas the non-robust models do not articulate assumptions. If the caveats are violated, then the user calls upon the original models (de Kleer & Brown, 1983).
Visual Representation of Information
Legrenzi & Girotto (1996) concluded that it is critical for information designers to focus on design principles that help build the desired representation of an interface, module or information architecture in such a way that users understand it from first interaction. Text has the power to focus or defocus the user’s attention toward the more accurate representation. It would be advantageous of designers to create representations or textual content that do not generate more than one competing model of an interaction or understanding of the situation. The result of competing models is increased
uncertainty and complexity for the user. Similarly, text-based displays that only show raw data values in numerical format force the user to remember the set points and relationships of interest, make a comparison of the values that may or may not be
displayed, and perform mental calculations to determine the necessary information. This is an example of cognitive load obstructing representational development.
Schnotz, Bennert, & Seufert (2002) assert that text and pictures can be seen as
propositional representation to an analog representation. However, there may be differences with regard to the ease of interpretation of diagrams depending upon its complexity.
The presentation of information in more than one medium can help individuals who have trouble encoding information from either text or diagrams alone. Many types of information can be characterized in more than one way. If two representations contain identical information, they may be considered informationally equivalent. However, extracting the information from the two media requires different types of processes and so they are not equivalent (Larkin & Simon, 1987). When text is accompanied by a diagram, the comprehension process is more involved because the information that readers have to incorporate is presented in two different media. When text is
supplemented by a diagram, the important information could be reactivated by inspecting the diagram rather than reading the text. A diagram might be particularly beneficial if the different pieces of information were presented in adjacent, or easily identified locations (Hegarty, et al., 1991). However, diagrams can be used to compensate for limitations to working memory only if the reader can process the diagram. In summary, diagrams may facilitate the development of a mental model because they lead to the formation of a more detailed, robust representation of the material presented to the individual (e.g., Glenberg & Langston, 1992).
When asked the question are pictures and words encoded in a single underlying mental representation or separate memory systems, Paivio (1986) proposes a dual coding model. The model demonstrates the existence of a verbal system specialized for
information and mental imagery. The two systems can operate independently, but they are also connected so that, for example, a person looking at a picture might verbalize its description. When the results of research on the memory for pictures is compared with memory for verbal stimuli, the recurrent finding is that memory for pictures is better than memory for words, an outcome known as the “pictorial superiority effect” (Levie, 1987). Paivio argues that dual coding is more likely to take place with pictures than words, and since two memory traces are better than one, dual coding justifies the pictorial superiority effect. Haber & Myers (1982) demonstrated that the memory for a picture-word
combination was superior to memory for text alone or pictures alone.
Charts, graphs and diagrams reside at the center of the continuum that extends from pictures to words. Charts, graphs, and diagrams comprise a family of graphic forms that share the common attributes of abstraction and the exploitation of space. The current research focuses on diagrams, more specifically flow diagrams, which are different than graphs and charts in function and complexity (Winn, 1987). Diagrams describe whole structures and processes often at levels of high complexity. Diagrams explain sequences by illustrating sequences of actions, rules, and chains of reasoning. Schematic diagrams depict very abstract concepts and rely on conventions that depict both the components and their organization (Hegarty, et al., 1991). In this instance, the automation’s algorithm, or flow diagram, is depicted as a schematic diagram.
between visual representations and a user’s mental model is essential in the
comprehension and effective use of algorithms. A learnable image that portrays the underlying system or database is necessary for a user to have a starting point in the organization of a visual mental map (Sutcliffe, Ennis, & Hu, 2000). Bennett & Flach (1992) assert that performance can be improved by providing displays that allow the user to make use of the more efficient processes of perception and pattern recognition instead of requiring the user to utilize the cognitively taxing processes of memory, integration, and interference (Rasmussen & Vincente, 1989; Vincente & Rasmussen, 1990; Woods, 1991). One method of accomplishing this is by collecting and combining information in centralized displays.
Guerlain et al., (2002) maintain that a major strength of graphical representations of data as opposed to text-based displays is that many relationships can be conveyed directly using visual properties of the display. This allows access to embedded knowledge through perception of the display, rather than doing mental calculations to deduce the desired information. Visual representations are also useful in the preservation of spatial, topological, and geometric properties that are important for certain kinds of tasks. When trying to understand the representational benefits of a diagram, Larkin and Simon (1987) asserted that object properties could be indexed by their location, rather than by an explicit label. Additionally, a number of properties can be represented simultaneously in the same location, when these properties may all be relevant to the problem (Guerlain, et al., 2002).
Visual information can stimulate learning by presenting more than just data. Information is cognitively usable when presented as process, form, relationships, and functionality. Instead of appearing disjointed, information appears as a unified whole, spanning time and space, depicting cause-and-effect, and even visualizing abstract concepts. Information presented visually allows users to better comprehend complex ideas.
Impact of Automation Purpose, Process, and Performance on User Trust
the relationship trust can depend on the automation’s purpose and not its performance. The particular evolution of the relationship depends on the type of information provided by the human-computer interface and the training and documentation (Lee & See, 2004). Observing a system’s performance can support presumptions regarding internal
mechanisms associated with the dimension of process and analysis of internal mechanisms via an algorithm, can support inferences regarding the designer’s intent associated with the dimensions of purpose. Similarly, knowledge of the designer’s intent can reveal the underlying process, and performance can be estimated from
comprehension of the underlying process. If these inferences support trust, then the system design more likely facilitates an appropriate level of trust. If inferences are not in agreement with observations, then trust will probably suffer because of a weak
correspondence with the observed agent. Trust that is established on understanding the agent’s motives will be less fragile than trust based only on the reliability of the agent’s performance (Rempel et al., 1985).
As the automation of aspects of IT becomes more prevalent and the shift of control moves from the user to the IT, there is an increasing need to improve the relationship between the two. Trust in automation is critical, because of the interpersonal nature of the relationship between humans and automation. Research has shown that humans respond to automation as they would to other human collaborators (Reeves & Nass, 1996). However, their expectations of near-perfect performance from automation are unrealistically high (Smith & Graesser,1981; Ruble & Stangor, 1986). Because of the unusual nature of this human-automation relationship, it is necessary to find ways to ensure its success. Developing appropriate levels of trust in the automation are
necessary. One way to improve a user’s trust in automation is through the development of a suitable mental model of the automation and its algorithm. There are a number of ways in which the automation’s algorithm can be presented, including text or graphic. The modality that lends to a more appropriate mental model and appropriate usage pattern remains to be seen.
A more robust mental model of the automation or the decision aid’s (DA) algorithm will lead to higher levels of trust in the DA. Higher affective ratings of trust in the DA and more appropriate use of the DA will be seen as a result. The present research is designed to investigate the following hypotheses:
Method Participants
North Carolina State University undergraduate Psychology students were used as participants. The experiment was posted in the psychology experiment database. Students enrolled in the Introduction to Psychology course participated. All participants received course credit that will fulfill a course requirement. In addition to course credit, participants were told that individuals with the highest scores were entered in a raffle to win a prize valued at one hundred dollars. A power analysis was conducted to determine the appropriate number of participants. The value for sigma, the common standard deviation for both populations, used to calculate power was determined from a
preliminary study using similar procedures. A power value of .80 was used. It took a sample size of 90 (15 per cell) to reasonably detect a treatment effect.
Materials
A standard laptop computer with the Windows operating system on it was used in this study. A signal detection task was performed on the computer with the assistance of an automated decision aid. The theory of signal detection is that nearly all reasoning and decision-making takes place in the presence of some uncertainty (Heeger, 2003). The general approach of signal detection theory has direct application in sensory experiments.
Policity
Policity is a city simulation game where a policy set is used to manage the city. The version of Policity used in this research is the same as in previous experiments
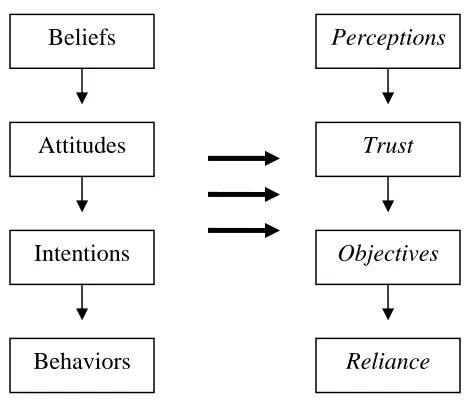
chose to do so (see Figure 2). This condition shows the DA providing a suggestion using a textual algorithm.
Figure 2. Policity user interface showing the city and buildings (top-left) in San Francisco, the Decision Aid (center), City and a selected Hospital properties (bottom-left), and city properties (right).
and train stations. Each facility type had adjustable properties and other properties that showed the facilities’ status. For example, hospitals had properties like number of beds, nurses, and doctors. The number of beds property was adjustable, but the nurses
property was purely informational. The city had a total of 60 unique properties across all facility types that interacted in various ways to create a unique set of dynamics. The city itself also had its own set of properties. Two of these properties (i.e., individual tax rate and business tax rate) were adjustable. The remaining seven showed the state of other aspects of the city (i.e., budget, crime, health, personal income, population, recreation, and transportation). On the left side of the game’s interface, a map displayed the physical layout of San Francisco city. As buildings and facilities were added, icons representing them were randomly placed on the map. The exact location of facilities had no direct effect on the city or on other buildings. On the right side of the game’s interface were three dynamic graphical displays of the city’s budget, health, and population.
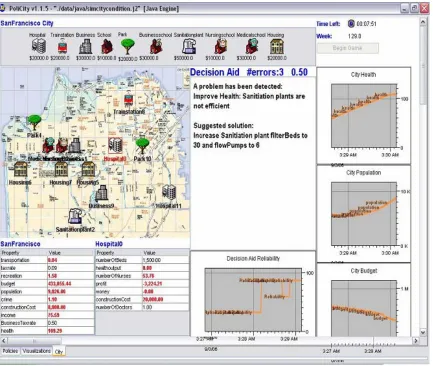
The DA is shown in the center of the user interface in Figure 2. Figure 3 shows the three versions of the DA’s algorithm that were displayed based on experimental condition (i.e., no algorithm (right), graphical (center), and textual (left)). The results of the
experiment are presented below. Preliminary pilot testing revealed that a graphic-only depiction of the decision aid’s algorithm was incomprehensible without the
accompanying suggestion (as described below). Participants reported that there was not enough information available in the graphic alone to provide direction on what to do next. The textual algorithm included an additional suggestion that was an explicit statement on what to add or edit in the city. This same suggestion was added to the graphical algorithm interface and was found to make the algorithm more comprehensible. This information was presented in the same location as it was in the textual algorithm conditions. Therefore, any references of the graphical conditions from this point forward include a textual component.
The DA sampled the city’s condition once every 1000 milliseconds to search for a problem. The DA suggestions had a problem (conditional) component and a solution (action) component. In the textual and graphical algorithm conditions, the problem represented the algorithm the DA used to determine what was wrong with the city. The graphical algorithm also provided a diagrammatic representation of the problem. Figure 3 shows the relationships among the properties of the city and its facilities represented as ovals and arrows. The health of the city, which is the target for improvement, is colored gold to identify that it is the target property. The properties that need adjusting to
and graphical algorithm were used interchangeably. The algorithm had to be complex enough to warrant the use of a diagram. The complexity of the algorithm was verified during pilot testing. The DA in the no algorithm conditions did not provide a
representation of the algorithm it used.
The DA’s suggestions were the original set of policies used in previous experiments (Campbell et al., 2005). There were a total of 18 different policies that were created to address specific problems in the city (see the list below) to some extent. Every policy was thoroughly tested independent of the others to verify that each provided a benefit to the city in at least one situation or another. For example, the policy to improve the city’s budget only does so if certain buildings (i.e., businesses) have been added to the city. Each policy was also tested to ensure that none were “super” powerful. The total list of policies includes rules that require adding every building type available, as well as, making adjustments to facilities and city properties.
There were 18 policies across five different tasks: 1. Improve Health (9 Policies)
2. Improve Population (2 Policies) 3. Improve Budget (5 Policies) 4. Improve Income (1 Policy)
5. Improve Transportation (1 Policy)