ISSN(Online): 2320-9801 ISSN (Print): 2320-9798
I
nternational
J
ournal of
I
nnovative
R
esearch in
C
omputer
and
C
ommunication
E
ngineering
(An ISO 3297: 2007 Certified Organization) Website:
www.ijircce.com
Vol. 5, Issue 1, January 2017
A Survey on Smart Cities: Using Big Data
Applications
Ashwini Athawale1, Deepali B. Gothawal2
M. E Student, Dept. of Computer Engineering, D. Y. Patil College of Engineering, Akurdi, Pune, India1
Assistant Professor, D. Y. Patil College of Engineering Akurdi, Pune, India2
ABSTRACT: A “Smart City” generally means a technologically advanced city, that is able to understand its
environment through analyzing its data so that it immediately makes changes to solve issues and to improve the residents’ quality of life. The huge volume, high velocity and wide variety of city’s data require the utilization of “Big Data” technologies to gain valuable insights from it.
This paper reviews the applications and, hence, the potentials where Big Data technology can drive a city to be smart. Starting from investigating the visibility of the city, which means collecting data from all networks, devices and sensors that embedded in its infrastructure. Continuing to explain how can this data become valuable by passing different processing stages, and by applying advanced analyzing Big Data platforms on data. The smartness of the data-driven city is achieved by visualizing the data in useful shape in order to improve any city’s system application. The review has also included few real world examples that shows the practical applications of Big Data in a Smart City in the domains of smart energy, smart public safety and smart traffic systems.
KEYWORDS: Big Data, Smart City, Hadoop
I. INTRODUCTION
The technology is rapidly advancing and evolving in every aspect of the human life, either solving issues or making things easier. Recently, two terms have been widely getting more attention. The first term is Smart City, which refers to an information-based city that combines Information Technology (IT) with its operational infrastructure to help; managing the resources more efficiently, enhancing decision-making, and being more proactive toward the significant incidents [1]. According to [2], there are three characteristics of Smart City:
Instrumented city: refers to the data sources that sense and measure data of city’s sectors and utilities.
Interconnected city: there are two phases of this level. First, the physical phase which is the network that integrates the systems and connects the devices. Second, the logical phase which comes from integrating the data from various sources and providing meaningful relations of that data.
Intelligent city: uses advanced analytic techniques to provide insight for city events and visualization tools to visualize city’s behavior.
The second term is Big Data which came out of the data flood that the digital world has impressed/created. Big Data refers to the management and the analysis of the large volume, high velocity, and wide variety data. Moreover, the thought of the Big Data as an emerging technology for the Smart City is being recently widely debated [3].
ISSN(Online): 2320-9801 ISSN (Print): 2320-9798
I
nternational
J
ournal of
I
nnovative
R
esearch in
C
omputer
and
C
ommunication
E
ngineering
(An ISO 3297: 2007 Certified Organization) Website:
www.ijircce.com
Vol. 5, Issue 1, January 2017
challenges and benefits of Smart City, and Big Data has been discussed. Among others, [4] focuses on the real-time Smart City sys-tems, giving illustrations of how cities are instrumented and how Big Data is produced. In addition, it discussed enabling real-time analysis of data and this analysis’s benefits. The benefits of using data mining techniques to learn from data has been investigated by [5]. This work used Apirior technique, which is a rule-based technique, on small volume of data to extract value but it could not scale up to the large volume. Another study was provided by [6], where the study analyzes the relationships between Big Data, Smart Cities and the characteristics of Supply Chain (the structure and the mecha-nisms of governance). The study has proposed an integrative framework that represents those relationships. Other studies have discussed the management of Smart Cities and the smart systems using Big Data. For instance, [7] studied the concepts behind city management platforms, investigated cases inside Japan and abroad. The study also provided some predictions of future scenarios. The work of [8] has demonstrated a prototype using Hadoop and Spark to analyze and compare Bristol open data, which is the related data to city’s quality of life, primarily on economy and safety, crime and employment. Another prototype demonstration project was proposed by [9] to predict the usage of energy for specific groups of meters IDs. The prototype used time series predictive analysis to create predictive models.
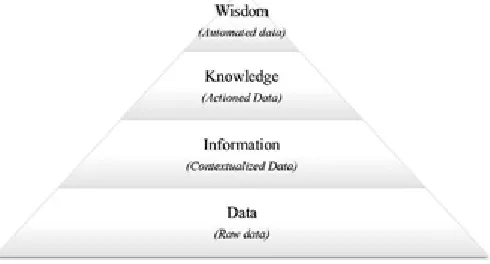
Fig. 1.Shows the Data, information, knowledge and wisdom pyramid
II. VALUE CREATION JOURNEY
A. DATA STAGES
In order for a certain city to be smart, it should experience the data, information, knowledge and wisdom pyramid to reach its smartness [10]. Figure 1 shows the pyramid.
In city’s instrumented and interconnected layers, the raw data are gathered from data sources that are integrated with the city’s operational infrastructure to sense and measure the changes in climate, people’s movements, water and energy consumption, and all the city’s sectors. This, consequently, makes them more visible and observable. Then, the raw data is encapsulated via network protocols with control information and transmitted over the city’s network (either via wired or wireless connection) to the nearest gateway, which is then sending it to a cloud that holds the Big Data computing platform.Like in the intelligent web [11], Smart City’s intelligent layer performs look, listen, learn, connect, predict and correct on its Big Data to unlock the pyramid stages. Hence, intelligence is obtained.
B. BIG DATA COMPUTING
For a real-time Smart City ecosystem, the data need to be analyzed to help providing a real-time view of the city. This requires fast and proactive detection and action. In other hand, the data need to be matched and analyzed together with the historical one and other data from the social media for example to provide deeper insight from that whole related city’s data and more understanding of city’s daily behavior and rhythm.
ISSN(Online): 2320-9801 ISSN (Print): 2320-9798
I
nternational
J
ournal of
I
nnovative
R
esearch in
C
omputer
and
C
ommunication
E
ngineering
(An ISO 3297: 2007 Certified Organization) Website:
www.ijircce.com
Vol. 5, Issue 1, January 2017
blocking. Moreover, models are embedded to help identifying the real-time data feeds and extracting the relevant from it in real-time. For Batch Computing system, Hadoop is the most widely implemented in Big Data environments. Hadoop is an open-source apache project, works by parallelizing the processing of the data across computing nodes for the sake of dealing with the large data volumes in the minimum time possible. Technically, Hadoop has two main components [12].
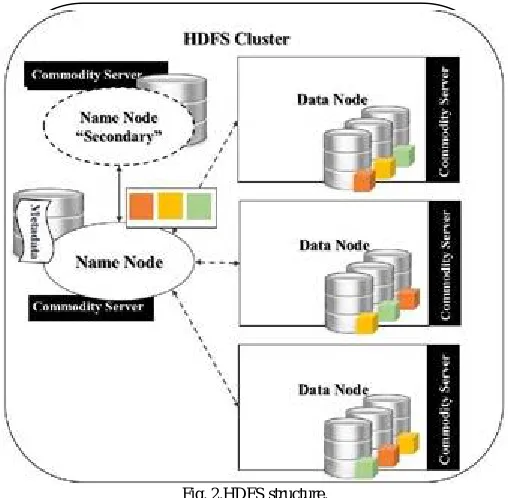
Fig. 2.HDFS structure.
C. HADOOP DISTRIBUTED FILE SYSTEM (HDFS):
which is a data service for managing files in Big Data environments. In HDFS, the data files that needs to be processed are broken into blocks that sizes are between 64-128 MB and distributes across nodes. For reliability, each block is replicated across multiple nodes (typically, three nodes). The block is then sent to the first node, then the node pipelines it to the other and the other does so. In HDFS cluster, the nodes serve one of two functions: First, the Name Node function, that is responsible of managing the distribution of the blocks, tracking their locations and the operations on them, and storing a detailed metadata about them. Name Node is usually provisioned with highly available server and backup in a secondary Name Node to avoid single point of failure. Each cluster contains a single Name Node. Second, the Data Node function, which is responsible of processing the data blocks. Each cluster contains a number of nodes. Figure 2 illustrates the HDFS structure.
D. HADOOP MAPREDUCE:
ISSN(Online): 2320-9801 ISSN (Print): 2320-9798
I
nternational
J
ournal of
I
nnovative
R
esearch in
C
omputer
and
C
ommunication
E
ngineering
(An ISO 3297: 2007 Certified Organization) Website:
www.ijircce.com
Vol. 5, Issue 1, January 2017
III. APPLICATION OF SMART CITY SYSTEM
A. SMART ENERGY SYSTEM:
The vision of the smart grid and smart metering system is introduced by the combination of the traditional power grid, renewable energy, and the IT technologies. Typically, the smart grid uses smart meters, digital controls, sensors and analytics to manage and automate two-way flow of information and energy between the utility and the consumers.
The row data will be gathered from all of the smart grid devices including smart meters, which generates data about energy consumption every 15 minutes or half an hour, sensors generate data about energy flow (such as voltage, current, the amount of the energy generated by the solar system/wind tur-bines,...etc). Then, this data will be sent to the cloud that holds the Big Data Computing Platform for data analytics as at-rest and in-motion. The smart grid infrastructure’s data is handled, managed and transformed into valuable form of insights in the cloud. Those insights allow real-time management of the grid. For instance, by providing predictions on how much energy will be consumed “the grid demand”, the grid can generate energy that fill in this demand and detect when the energy is leaked when the consumption exceeds the maximum demand of the grid. As a result, enhancements in the visibility of the smart grid has been done via combining the use of the full range of the generated data and the advanced analytics.
In the Smart Energy system, the Big Data analytics runs on three primary domains;1- utility analytics such as real-time visualization and simulation of the grid, 2- grid operations analytics such as storage of renewable energy, power quality, outage restoration, protection of energy from thieves and grid optimization, and 3- consumer analytics such as the behaviour of the consumer and time-of-use pricing [13].
Example of predictions of energy usagethe prototype project in [9] used the data gathered from the installed Smart meters in approximately 6000 homes of participants in Ireland’s Smart Metering project, which was initiated by the Commission for Energy Regulation (CER) in 2007. The smart meters were generating data in every half an hour, and as expected the old is added to the new. Therefore, in the prototype, an open source platform called KNIME has integration with Big Data platforms such as Hadoop for data analysis. The platform is supported by graphical user interface for visualization of the analysis processes, tools and outcome.
The data of smart meters that was used in the prototype was contained in six CSV files, where ID of the smart meter, the time of data transmission and the amount of the energy that has been consumed is contained. The prototype implementation steps had taken the same flow of Big Data’s pipeline to predict the usage of the energy:
1) Look: the row data files that are generated by the smart meters are imported and indexed in table under five columns named: rowID, meterID, datetime, KW/30 and iteration. Then, they transformed the datetime column into two columns date and time, by extracting the values of date and time from datetime value. Finally, they sorted the rows by meterID. At this stage, 176 million rows were generated.
2) Listen: aggregating the smart meter data in daily/hourly bases to understand the energy usage of each smart meter data under those bases. Through defining and calculating behavioral measures for each smart meter ID, for instance, calculating the average of energy usage per day/week/month/year for each smart meter ID.
3) Learn and connect: grouping and clustering the IDs under previously calculated measures (i.e., grouping smart meters’ IDs under their energy usage). Through this step, the analysis domain is reduced from 6000 IDs to a maximum range of 30 clusters. They could farther connect and categorize the 30 clusters under four main groups.
ISSN(Online): 2320-9801 ISSN (Print): 2320-9798
I
nternational
J
ournal of
I
nnovative
R
esearch in
C
omputer
and
C
ommunication
E
ngineering
(An ISO 3297: 2007 Certified Organization) Website:
www.ijircce.com
Vol. 5, Issue 1, January 2017
5) Correct: the project used tables and graphs to visualize and provide extra information about the clustered IDs and the time series predictions.
B. SMART PUBLIC SAFETY SYSTEMS:
They are those systems that combine the traditional pub-lic safety systems with IT emerging technologies (i.e., Big Data, Internet of things) to make public safety systems more proactive toward events rather than just responding to them after occurring. This means that smart public safety systems provide automatic sensing, detecting and alerting of incidents using advanced analytics and visualization tools [2].
Automatic Number Plate Recognition (ANPR) System:
In public safety sector, Dubai police collaborated with Hewlett Packard Enterprise (HEP) to implement the Automatic Number Plate Recognition (ANPR) system, which consists of scanners installed on rooftop of the patrol cars to read license plates of vehicles and provide real-time detection of the cars’ owners who are hunted by authorities. In fact, from since the system has been implemented in 2012, it could identify 2,739 people with criminal and traffic offences.
In the ANPR system, pan-tilt camera that is rested on top of the light bar collects row data by scanning cars that are parked or are moving in front or behind the patrol cars and reading their license plates. Then, this data is fed to HPE IDOL, which is a software engine for searching and analyzing data and it operates on top of HPE haven platform that is used to derive intelligence from structured and unstructured data. The central HEP IDOL repository always updating the patrol cars with the hunted licenses every three minutes so when, for instance, a car’s owner pays the fee, he will not be caught needlessly. The HPE IDOL engine takes the captured row data and analyzed in real-time and the hunted vehicles are identified and visualized via a dashboard contains an image of the vehicle, important information about the plate and why the vehicle is being hunted, and alert in form of voice message [14].
C. SMART TRAFFIC SYSTEM:
Because of the demands on the city’s physical infrastructure are going to continue to increase, it is going to be unavoidable choice for using Intelligent transportation systems. By using smart technologies such as Internet of Everything (IoE) that visualize all the transportation network items and use Big Data platforms to understand the behavior of the movements, smart cities will extract values that help decision making, to achieve more vehicles but less traffic.
According to the smart city’s three layers: At instrumented layer, data is collected from multiple sources that identify and measure traffic speed and volume on city’s roads, such sources are GPS, cameras, radar, and sensors embedded in roads and vehicles. This makes every single highway, lane, intersection and vehicle representing a data point. More data points are collected from data of people’s flow from the telecommunication networks through mobile phone devices. At Interconnected layer, all the data from sources with the map of the city’s transportation network are combined through the city’s network with the Big Data platform. At Intelligent layer, traffic analysis is applied to represent flow conditionsand prediction capabilities for traffic management to identify the problem, enabling officials to respond to dangerous road conditions, accidents or growing traffic density in near real-time, by implementing system-wide changes to keep traffic moving and alerting drivers what to expect, through smart phones and built-in navigation devices, allowing them to find alternative routes, also providing the drivers with real-time information about available parking for use or book. Additionally, the insights that executed from analyzing that data in Big Data platform is used for helping cities with long-term planning such as where to plan a public transportation and parking places [15]. Example of automated smart traffic system:
ISSN(Online): 2320-9801 ISSN (Print): 2320-9798
I
nternational
J
ournal of
I
nnovative
R
esearch in
C
omputer
and
C
ommunication
E
ngineering
(An ISO 3297: 2007 Certified Organization) Website:
www.ijircce.com
Vol. 5, Issue 1, January 2017
the system can help them to pass through the lights faster and get back on schedule. The LA system synchronizes all 4,500 traffic lights in the metropolis. The project is totally unique with regards to its size and its scope, and is reputed to have cost more than $400 million to implement. According to officials, the average time to drive 5 miles in the city before was 20 minutes. With the new system, this has been reduced to just 17.2 minutes.
IV. CONCLUSION
This paper explored the use of Big Data aspects in cities to make them smart. Starting with defining and explaining Big Data and how it works in more detail, ending with investigation of some applications of Big Data in smart cities. The powerful point of Big Data is about extracting valuable information from ever increasing digital data. The raw data passes many stages as the pyramid shows; data, information, knowledge and wisdom. Through the Big Data pipeline that; collects, analyzes and visualizes that data to get insights and to help proper decision-making. The explanation examined how to compute Big Data, whether the data was in motion -stream computing- in real time, or at rest -batch computing-as Hadoop. Furthermore, details on how the components of the ApatcheHadoop are working are discussed. Also, some advanced analytics techniques that are applied on the data to provide actions and predictions, are mentioned.
REFERENCES
[1] C. Harrison and I. A. Donnelly, “A theory of smart cities,” in Proceed-ings of the 55th Annual Meeting of the ISSS-2011, Hull, UK, vol. 55, no. 1, 2011.
[2] M. Kehoe, M. Cosgrove, S. De Gennaro et al., “A foundation for understanding ibm smarter cities.”
[3] E. Al Nuaimi, H. Al Neyadi, N. Mohamed, and J. Al-Jaroodi, “Appli-cations of big data to smart cities,” Journal of Internet Services and Applications, vol. 6, no. 1, pp. 1–15, 2015.
[4] R. Kitchin, “The real-time city? big data and smart urbanism,” GeoJour-nal, vol. 79, no. 1, pp. 1–14, 2014.
[5] A. Moraru and D. Mladenic,´ “Complex event processing and data mining for smart cities,” in Conference on Data Mining and Data Warehouses (SkiDD 2013), Held at the 15th International Multiconference on Information Society (IS-2012), 8th October, 2012.
[6] D. Gary Graham, E. M. Tachizawa, M. J. Alvarez-Gil, and M. J. Montes-Sancho, “How "smart cities" will change supply chain management,” Supply Chain Management: An International Journal, vol. 20, no. 3, pp. 237–248, 2015.
[7] M. Moriok, K. Kuramochi, Y. Mishina, T. Akiyama, and N. Taniguchi, “City management platform using big data from people and traffic,” Hitachi Review, vol. 64, no. 1, pp. 52–57, 2015.
[8] Z. Khan, A. Anjum, K. Soomro, and M. A. Tahir, “Towards cloud based big data analytics for smart future cities,” Journal of Cloud Computing, vol. 4, no. 1, pp. 1–11, 2015.
[9] R. Silipo and P. Winters, “Big data, smart energy, and predictive analytics,” Knime, 2013.
[10] M. Dohler, M. Hatton, and J. Alonso-Zarate, “Machine-to-machine technologies & markets - shift of industries,” in IEEE WCNC, Istanbul, Turkey, 2014.
[11] G. Shroff, The Intelligent Web: Search, Smart Algorithms, and Big Data. Oxford University Press, 2015.[Online]. Available: https://books.google.com.ly/books?id=mgk-rgEACAAJ
[12] P. Zikopoulos, C. Eaton et al., Understanding big data: Analytics for enterprise class hadoop and streaming data. McGraw-Hill Osborne Media, 2011.
[13] D. J. Leeds, “The soft grid 2013-2020: Big data & utility analytics for smart grid,” GTM Research, April 2013. [14] “Dubai police accelerates and sharpens enforcement,” Hewlett Packard Enterprise, Tech. Rep., 2014.
[15] S. Schaefer, C. Harrison, N. Lamba, and V. Srikanth, “Smarter cities series: Understanding the ibm approach to traffic management,” IBM Corp., Tech. Rep., 2011.