Equipment Operation Without Failures for Fourth Generation U.S. Reactors
Donald Jarrell and Dr. Leonard Bond
Pacific Northwest National Laboratory, Operated by Battelle for the U.S. Department of Energy, Richland, WA
ABSTRACT
Condition-based maintenance (CBM) offers a potential solution toward providing the exceptional machinery reliability levels that will be required to restore public confidence in nuclear power. To support this goal there is a growing interest in the development and deployment of distributed suites of smart sensors bundled with microcomputer diagnostic reasoning agents that are interconnected using wireless communication technologies [1].
This paper describes a novel CBM approach to predicting failures and reports on the demonstration of this technology in a project underway at the Pacific Northwest National Laboratory. This advanced technology is paving the way for an on-line intelligent Self-Diagnostic Monitoring System (SDMS) for possible use in fourth generation US nuclear power plants. The SDMS project will demonstrate, on a pilot-plant scale service water system, the integration of a combination of traditional and novel sensors used in both CBM and NDT/NDE system assessments. The SDMS will detect, monitor, and diagnose various degradation precursors and their resultant degradation mechanisms, including fouling, cavitation, and other commonly encountered degradation phenomena, and predict their effects on reliability and service life. The goal of this project is to provide a proof of concept demonstration for SDMS technology, including its novel software architecture, distributed data processing, and the use of wireless smart multi-sensor modules.
INTRODUCTION
Nuclear power plant environments are often exceptionally inhospitable to humans. In the event of a safety system challenge, the operating environment for emergency core cooling systems (ECCS) can degrade rapidly. During such an occurrence, it is usually impossible to enter the enclosed containment space to diagnose the condition of suspected equipment. The necessity for fault tolerant information access is, therefore, imperative under such conditions. An accurate understanding of the changes in component stressors and their associated degradation rates can dramatically affect the expected machinery residual life and is crucial to the successful management of such an event.
EVOLUTION OF THE STRESSOR-BASED APPROACH
Savvy maintenance managers have long since learned to subscribe to a rigid preventive maintenance (PM) philosophy. This is because it has been made obvious to them that not following these precepts opens them to being blindsided by some very unpleasant surprises. Like how not replacing the oil pump bearing seals every 5 years, as recommended, showed up later as 30 gallons of lubricating oil on the plant floor that almost made it to the storm sewer. So experience makes us firm believers in following even the unpopular tear-it-down-and-measure-the-tolerances routines of the PM regimen.
There are alternatives to this PM approach that have evolved with the development of newer, more advanced sensing and analysis technologies. Industry has taken four distinct evolutionary steps to reach our current state of condition-based Operations and Maintenance (O&M). Each successive step has had a positive affect on the efficiency, reliability, and safety of plant processes.
Corrective Maintenance (CM) is the old “if it ain’t broke, don’t fix it” story of the perennial run-to-failure mode. It is simplicity itself, requires little forethought, and (at least up to the point of machinery failure) requires the least resources from the O&M crew and their support staff. Many war stories are told about equipment that is destroyed by rapidly acting degradation mechanisms, erosion or cavitation in a pump for example, that shorten the life expectancy of a component by an order of magnitude or more. In very simple and non-critical components (a light bulb for instance), run to failure may be a cost effective mode for maintaining the equipment. As long as the consequence of equipment failure is not high, this approach makes some sense. In critical applications, however, (like the safety systems of a nuclear power plant) this low reliability approach is not tolerable.
The CM method of plant maintenance is still, surprisingly, the predominant method in many U.S. commercial facilities, despite the resulting high product loss, capital equipment loss, total manpower expenditure, and accident severity that result.
Preventive Maintenance(PM) is the art of periodically checking the performance and material condition of a piece of equipment to determine if operating conditions and resulting degradation rate are within expected limits. If they are not, a search for the reason for the more rapid degradation must be made, so problems can be corrected, or at least mitigated, before the machine fails.
PM testing, inspections, servicing, or parts replacements are done on a service life (for example, hours of operation) or purely on a time basis. Although accurate failure statistics can allow the testing interval to be optimized, the PM method is expensive and catastrophic failures can still occur. This method is also very labor intensive and problem prone. Much unneeded maintenance is performed, and incidental damage to equipment is widely reported because of poor maintenance practices. However, a PM system can be a cost-effective strategy when the life span of the equipment is well understood and consistent. For instance, an air filter in constant use tends to need replacing with a constant frequency. Studies in the utility industry report that the transition from reactive-to-preventive life cycle cost savings are in the 12 to 14 percent range.
Predictive Maintenance (PDM) advocates measurements aimed at the early detection of degradation mechanisms, thereby allowing the degradation to be understood and eliminated or controlled, prior to significant physical deterioration of the equipment.
Many non-intrusive measurement methods allow observers to detect and correct the potential for degradation earlier in the life cycle. Technologies, such as vibration analysis, oil analysis, thermography, and ultrasonic analysis, push our problem recognition capability to the leading edge of the degradation envelope.
The application of this technology typically results in:
•
increases in equipment life•
earlier mitigation or corrective action•
decreased process downtime•
decreased maintenance parts and labor hours•
better product quality•
decreased environmental impact•
energy savings.The sum of these advantages can add another 8 to 10 percent to the O&M savings over that of a PM program alone. In addition, the root cause for the degradation can more easily be identified, and consequently, mitigation can be better targeted and repetitive failures are much less likely to occur.
On the negative side, the costly up-front investment in detection/diagnostic equipment, and the high level of staff training, makes this approach a more difficult pitch to an ever wary, cost conscious management. The savings provided by this technology are largely in terms of avoided cost (a hard concept for management to endorse) and, therefore, it becomes more difficult to demonstrate and to ensure program funding.
Now, final dramatic evolutionary development is taking place in the laboratory that can eliminate the occurrence of unexpected equipment failure.
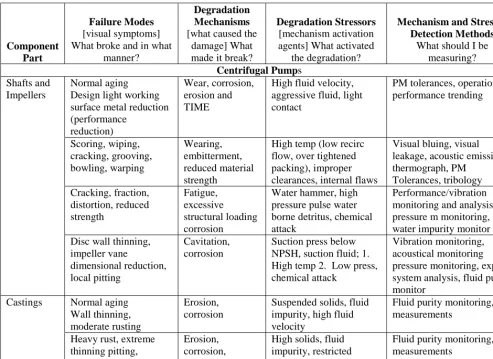
Condition-Based Operations and Maintenance(CB(O&)M) is the detection and diagnosis of off-normal equipment operation and the identification of the root cause stressor(s) responsible for this abnormal condition. In the context of CBM, a stressor is any exterior or interior attribute experienced by a component that, if outside the normal design envelope, would create a mechanism for accelerated degradation and result in early component failure. Such stressors include pressure, temperature, thermal transients, and over speed. Care must be used to avoid confusing these parametric stressors with the resulting degradation mechanisms and their associated operational symptoms. For example, if pump pressure is allowed to go below the requirement for adequate net positive suction head (NPSH), then suction pressure is the stressor, cavitation is the degradation mechanism, erosion is the degradation mode (observable damage), and the loss of pump differential pressure (and hence flow) constitutes the operational symptom. Following this example, these relationships have been defined in Table 1.
Table 1, taken from the Component Life-Cycle Cookbook [2], illustrates the progressive steps from stressor, to degradation mechanism, to failure mode; and attempts to provide the user with a method for targeting the stressor that is responsible for activating the offending degradation mechanism.
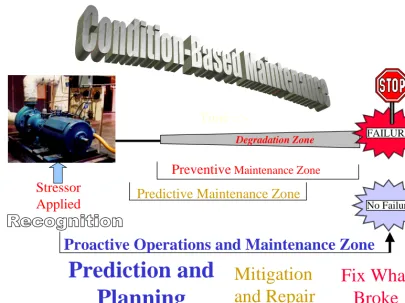
The series of evolutionary steps from reactive maintenance to CBM are illustrated in Figure 1. It clearly shows that maintenance evolution continuously moves to the left -- toward the immediate recognition of an abnormal stressor.
Two characteristics of this final CBM state should be noted from the outset:
1) Operations has now been engaged and integrated into the maintenance equation by becoming responsible for recognizing and, if possible, correcting the existence of an abnormal condition (stressor level).
2) By targeting instruments to identify the fundamental stressors (parameters outside the normal operating envelope) off-design condition identification is now the prime directive. With this information in hand, finding the root cause of the problem now becomes second nature.
Table 1. The Stressor, Mechanism and Mode
Component Part
Failure Modes
[visual symptoms] What broke and in what
manner?
Degradation Mechanisms
[what caused the damage] What made it break?
Degradation Stressors
[mechanism activation agents] What activated
the degradation?
Mechanism and Stressor Detection Methods
What should I be measuring?
Centrifugal Pumps Normal aging
Design light working surface metal reduction (performance
reduction)
Wear, corrosion, erosion and TIME
High fluid velocity, aggressive fluid, light contact
PM tolerances, operational performance trending Scoring, wiping, cracking, grooving, bowling, warping Wearing, embitterment, reduced material strength
High temp (low recirc flow, over tightened packing), improper clearances, internal flaws
Visual bluing, visual leakage, acoustic emission, thermograph, PM Tolerances, tribology Cracking, fraction, distortion, reduced strength Fatigue, excessive structural loading corrosion
Water hammer, high pressure pulse water borne detritus, chemical attack
Performance/vibration monitoring and analysis, pressure m monitoring, water impurity monitor Shafts and
Impellers
Disc wall thinning, impeller vane
dimensional reduction, local pitting
Cavitation, corrosion
Suction press below NPSH, suction fluid; 1. High temp 2. Low press, chemical attack
Vibration monitoring, acoustical monitoring pressure monitoring, expert system analysis, fluid purity monitor Normal aging Wall thinning, moderate rusting Erosion, corrosion
Suspended solids, fluid impurity, high fluid velocity
Fluid purity monitoring, PM measurements
Castings
Heavy rust, extreme thinning pitting, perforation
Erosion, corrosion, cavitation
High solids, fluid impurity, restricted discharge, chemical attack, fluid stagnation
Fluid purity monitoring, PM measurements
Additionally, the use of computers and low cost sensors allows
1) continuous automation of the stressor recognition process (what went out of spec), 2) use of degradation mechanistic diagnostics (what’s going wrong), and,
3) identification of a root cause solution (what needs to be done to correct the situation).
The result is a real-time picture of the problem and a clear understanding of the root cause solution. This information can be computer generated and presented simultaneously to the operations, maintenance, engineering, and administrations staff. The results are well-founded asset management decisions that proceed based on known equipment conditions, defined degradation rates, and, in most cases, accurate estimates of equipment remaining life (prognostics). Predicting and planning become the bywords of the maintenance group rather than the 2 A.M. brush fire and panic routine. Over the life of the equipment, the savings provided by this proactive paradigm are estimated to be 5 to 10 percent above the predictive approach. Ingoing from reactive maintenance alone to a balanced maintenance program that optimally uses reactive, preventive, predictive, and CBM, it is possible to generate a total production life cycle cost savings in the 25 to 40 percent range.
FUNDAMENTAL STRESSOR RELATIONSHIPS
Mitigation
and Repair
Fix What
Broke
Preventive
Maintenance Zone
Predictive Maintenance Zone
Prediction and
Planning
Degradation Zone
Time =>
Stressor
Applied
FAILURE
No Failure
Proactive Operations and Maintenance Zone
Figure 1. Condition-Based Maintenance Approach
Discussion
Degradation mechanisms, the resulting physical damage, and the associated decrease in asset performance all start with the application of a stressor to the component. In truth, stressors are an accepted part of a process components life. A specific stressor intensity level is set by the design engineer to degrade the physical state of the component slowly enough for the equipment to last for a specified design life. Only when the design limit of a stressor is exceeded, does the life expectancy start to shorten to less than the projected design duration. On the flip side, careful control of operational parameters can result in the opposite effect – extending the component life beyond the normally expected or design failure point.
The relationship of stressors, degradation mechanisms, and physical damage that results in failure are, in general, quite straightforward (refer to Table 1). A methodology for correlating these relationships is more difficult, but may be illustrated by the following example.
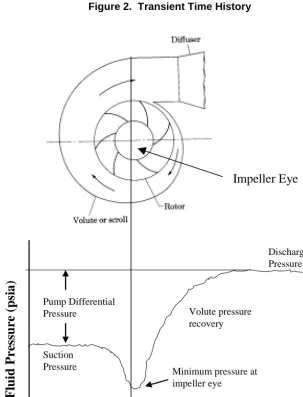
In the following scenario, a transient fluctuation of suction pressure in a pumped fluid, will be examined. The pump suction pressure profile is described in Figure 2.
Normally, the manufacturer levies a requirement for a pump specific net positive suction head (NPSH). The NPSH is a pump design basis for operation and is usually specified in feet of head required above standard atmospheric pressure (psia). The NPSH defines the minimum pump suction pressure that allows for a pressure decrease as the fluid passes through the eye of the pump impeller without causing excessive cavitation. Shown in Figure 2 is a depiction of the cavitation intensity (lower curve) that might result in the pump as it goes through the transient. Several useful conclusions can be derived from observing this parameter.
1) By monitoring the stressor level and its slope, a precursor to the point of actual cavitation can be provided (cavitation threshold in the figure).
2) Only during the time spent above the cavitation threshold is the equipment liable to damage from the cavitation mechanism.
3) The energy deposition intensity can be shown to be a function of the height of the stressor above the cavitation threshold.
Cavitation Threshold
Suc
ti
o
n
Pre
ssure
(
P
SI
A)
Time
t0 t
1 t2 t3 t4 t5
Design Intensity
C
avit
atio
n
Int
ensit
y
(jo
ul
s/
cm
2/se
c
)
Figure 2. Transient Time History
F
luid P
re
ssur
e
(p
si
a)
Pump Differential Pressure
Suction
Pressure Minimum pressure at
impeller eye Volute pressure recovery
Discharge Pressure
Pump Axial Position
As the fluid flows through the pump suction, it encounters a region of reduced pressure as it enters the impeller eye. If the fluid vapor pressure is below the minimum pressure encountered for this region cavitation is not likely. Conversely, for vapor pressures above this minimum pressure point, cavitation will be shown by the formation of local vapor bubbles. As these bubbles go through the low-pressure region, they grow until they encounter the sharp positive pressure gradient in the pump volute. At this stage, a rapid implosion occurs, caused by the immersion of the vapor in a suddenly subcooled zone with pressures much above the corresponding fluid vapor pressure. This implosion generates a shock wave capable of accelerating fluid particles to extremely high local velocities. When the implosion is located in the immediate proximity of metal surfaces, the fluid velocities can be sufficient to physically gouge small particles of parent metal from the impeller or pump casing. The metal removal rate resulting from this degradation mechanism is capable of destroying the associated pump structures in short order.
A FIRST PRINCIPLES PROGNOSTIC PLAN
With the forgoing discussion of pump physics as background, the discussion proceeds with a description of the approach to a first principals method to be used for determining residual life.
Incipient cavitation in a centrifugal pump can be recognized, using various techniques, as a fluid state in close proximity to the saturation line [3]. That is, how close the fluid is to the point in temperature – pressure space to the boiling point of the liquid (see Figure 4).
SATU RATI
ON
Stressor Recognition
PRESSURE
T
EMPERATURE
SATU RATI
ON
Stressor Recognition
PRESSURE
T
EMPERATURE
IM
P
AC
T
INTE
NS
ITY
ACOUSTIC EMISSION
Physics Relationships
IM
P
AC
T
INTE
NS
ITY
ACOUSTIC EMISSION
Physics Relationships
ACOUSTIC EMISSION
Physics Relationships
Model-Based Prognostic
TIME
C
ASING THICKNESS
Model-Based Prognostic
TIME
C
ASING THICKNESS
Degradation
Modeling
SEVERITY
M
ETAL RMVL
RATE
Degradation
Modeling
SEVERITY
M
ETAL RMVL
RATE
Figure 4. First Principles Cavitation Prognostics
Using suitable measurement techniques, the intensity of the cavitation phenomena can be accurately quantified and the stressor intensity related through materials property equations [4] to a physical surface metal removal rate. At this point, the information is wed with traditional stress and trend analysis techniques to yield an accurate prediction of residual life, based on known wall thickness from PM data. This is done through an integration of cavitation intensity since the PM was performed, as well as the metal removal rate versus cavitation intensity correlations.
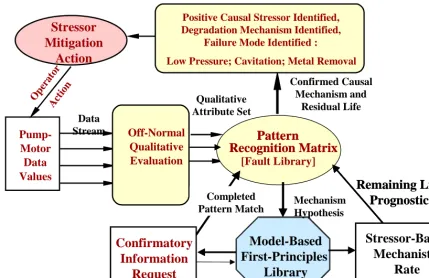
OPERATOR AS THE FIRST LINE OF MAINTENANCE
In the NERI laboratory test loop at PNNL, a monitoring system is implemented that provides not only normal pump operational data, but also has advanced instrumentation to allow measurement of a set of commonly occurring pump-motor faults. Termed the Pump-Motor Diagnostician TM (P-MD), this diagnostic module analyzes off-nominal patterns of operational parameters to hypothesize and confirm common faults in a pump and motor combination (see Figure 5).
Pattern
Recognition Matrix
Pattern
Recognition Matrix
[Fault Library]
Stressor
Mitigation
Action
Pump-Motor
Data
Values
Off-Normal
Qualitative
Evaluation
Confirmatory
Information
Request
Confirmatory
Information
Request
Positive Causal Stressor Identified, Degradation Mechanism Identified,
Failure Mode Identified :
Low Pressure; Cavitation; Metal Removal
Op era
tor
Act ion
Data Stream
Qualitative Attribute Set
Confirmed Causal Mechanism and
Residual Life
Mechanism Hypothesis
Model-Based
First-Principles
Library
Completed Pattern Match
Stressor-Based
Mechanistic
Rate
Determination
Remaining Life
Prognostic
Remaining Life
Prognostic
Figure 5. Diagnostic Stressor Resolution
Starting at the left, the pump and motor parameters are fed through a data acquisition system to a qualitative comparator. This action transforms the data into a set of qualitative attribute differentials – basically, did the attribute increase or decrease during the scan interval. These differential attributes form a pattern that is recognizable to the experienced eye. For the automated case, these patterns have been arranged into a library of failure sets that are recognizable by the computer. There are, particularly in very limited sets of data, usually several failure mechanisms and failure modes the pattern would suggest. These hypotheses are sent to the physics models that describe the selected degradation mechanisms. An information request is then generated by the physics library by considering what data would be required to fully characterize the mechanisms of interest. In the case of cavitation, it might be a request for the pump suction pressure, temperature, or the pump-specific NPSH. Assuming the operator could obtain the needed data, a complete discrimination pattern match may be obtained. The stressor identification and intensity information is then passed to the degradation rate algorithm where a remaining life for the component can be determined. Finally, with the causal stressor and its impact in hand, the computer can provide the operator with a complete description of the problem, its cause, a root solution for restoration, and a timeframe for required action.
With this level of diagnostic understanding, it is simple for the operator to correct the underlying stressor (e.g. the suction pressure) and to restore the pump to its design operating condition. Once the stressor was corrected, the cavitation would no longer be a threat to the pump and the maintenance crew would have one less job to do at some future date. In the event that no such easy solution existed, the operator would still be able to clearly present various asset management choices to management.
CONCLUSION
provide markedly increased assurance that a nuclear option is a safe and competitive energy solution for meeting the current and future power needs of the United States.
ACRONYMS
ANS American Nuclear Society
CB(O&)M Condition-Based Operations and Maintenance CBM Condition-Based Maintenance
CM Corrective Maintenance DOE Department of Energy
ECCS Emergency Core Cooling Systems NERI Nuclear Energy Research Initiative NPSH net positive suction head
O&M Operations and Maintenance PDM Predictive Maintenance PM Preventive Maintenance P-MD Pump-Motor DiagnosticianTM
PNNL Pacific Northwest National Laboratory PSIA pounds per square inch absolute RPM revolutions per minute
REFERENCES
1. Bond, L.J., Greitzer, F.L., Gilbert, R.W., Doctor, S.R. and Jarrell, D.B., “On-Line Intelligent Self-Diagnostic Monitoring For Next Generation Nuclear Power Plants,” Proc. of the International Topical Meeting on Nuclear Plant Instrumentation, Controls, and Human-Machine Interface Technologies (NPIC&HMIT 2000), Washington, D.C., November 2000.
2. Jarrell, D.B., “The Component Life-Cycle Cookbook.” A report to the USCAR consortium, July 1997. Available from NTIS, U.S Department of Commerce.
3. Shepherd, D.G., Elements of Fluid Mechanics, Harcourt, Brace & World, Inc. 1965, pp 449-451.