I
DEVELOPMENT OF AN ENVIRONMENTAL DECISION SUPPORT SYSTEM (EDSS) FOR COMPARING DRINKING WATER TREATMENT PRACTICES AND ASSOCIATEDHEALTH
RISKS
I
BY
Douglas J. Crawford-Brown and Shannon Marquez-Nyako Institute for Environmental Studies
University of North Carolina at Chapel Hill
The research on which this report is based was financed by the Water Resources Research Institute of the University of North Carolina.
Contents of this publication do not necessarily reflect the views and policies of the United
States Depaament of the Interior nor does mention of trade names or commerical products constitute their endorsement by the United States Government.
The authors gratefully acknowledgment the genmus support of the Water Resources Research Institute in providing primary support for this project. In addition, the Department of Environmental Sciences and Engineering of the
University
of North Carolina atChapel
Hill provided faculty release time, and the American WaterW&
Association providedSI&Q~~
for an additional student (Ms. Monique VanDerMarck) toL 44-
O S S ) for
the
analysis of risks from s) was developed and tested. The EDSS ve risks associated with difkmt tmtmentthe calculation of a weighted oomposite
ability of exposure factom
and
due to competing dose- models can be ~eflected within the analysis. The resulting EDSS was tested an example treatmentW
i
t
y
(the BrownWater
TreatmentPlant)
and
found to be le assuming the user can purchase the underlying A ~ I f l c a software.TABLE
OF CONTENTS
Acknowledgment Abstract
List of Figures List of Tables
Summary and
ConclusionsIntroduction
Approach 5
Modeling
DBP
Formation 7S
u
the Inactivation OfMicroorganisms 10Dose-Response Modelin& Estimating Health Risks from DBPs and Microbes 11
Confronting Uncertainty 13
Case Study: The Brown Water Treatment Plant 15
LIST
OF
FIGURESThe Conceptual Model of the
EDSS
An Example Window of the
EDSS
(water quality) An Example Window of theEDSS
@BP formation) An Example Window of theEDSS
@BP risk) An Example Window of theEDSS
(microbial risk)An Example Window of the
EDSS
(cancer risk uncertainty) An Example Window of theEDSS
(Giardia risk uncertainty)Page
6
17
18
19
20
22
LIST
OF
TABLESAn Example of Inactivation Parameters for Giardia
The Dose-Response Parameters for Disinfection By-Products The Dose-Response Parameters for Giardia and cryptosporidium Raw Water Quality at the Brown Water Treatment Plant
Estimated Probability of Cancer from Ingestion of DBPs Estimated Risk of Infection from Giardia and cryptosporidium Predicted Concentrations of Selected DBPs Against MLEs
Page 11 12
13
15
16
21
Summaj. and Conclusions
The Environmental Decision Support System (EDSS) developed and tested in this project
: incorporates many of the stages of reasoning needed to compare the risks of alternative
'
.ll$eatment systems with respect to microbial and DBP exposures. In particular, the EDSS allows the analyst to consider differences in input water qualitJr, treatment characteristics; DBP formation; kinetics of microbid inactivation; exposure factors for the population; risk from individual DBPs; risk from the mixture of DBPs; risk from individual microbes; risk %$+om the mixture of microbes; a composite measure of risk from microbes and DBPs;
variab'ity in all factors; and uncertainty in all factors.
- . ,The + resulting EDSS represents an advance over previous systems designed for comparing
%isks from microbes and DBPs in drinkiag water supplies. These advances relate to the
'1 W i t y within the new EDSS to determine the effects of variabiity and uncertainty on the @$bl comparison of risk across treatment options, including the consideration of
":&certainties introduced by competing models of risk. The system as configured can
?*$mulate effects due to 9 DBPs and to Giardia and cryptosporidium, but also is configured 1 + d o allow entry of new DBPs and microbes as these become of regulatory interest. The
?..T&- dtis a flexible system that can accommodate hture changes in the bases for regulatory
+nd other decisions.
* I'
A test of the EDSS using a case study (the Brown Water Treatment Plant of North e system can be operated using commonly available computer
Recommendations
'.z
m e following recommendations are made with respect to fbhue'applications and bprovements to theEDSS
developed in this study:q.
Users should read all documentation for theEDSS
before using the system. There are a'*" m b e r of decisions that must be made during the
reasoning
process which may be ar to some decision-makers, and the necessary expertise must be assembled. values are provided at these decision nodes, but better sitespecific values might be available.hould be linked to a national data base for input and output water quality.
comparisons of national treatment polick
ould at some point be reformatted into software that remote users to apply the
EDSS.
robes and DBPs should be added to the
EDSS
as the necessary models available for these constituents.' 7 '
INTRODUCTION
The Environmental Protection Agency is promulgating final standards for the allowable concentrations of disinfection bv-~roducts (DBPs) in ~otable drink in^ water s u ~ ~ l i e s . The presence of these by-products
&
&inking &erkpri;narihl
attribut2 to the of chlorination however. disinfection bv-~roducts are formed during other disinfection processes4
well. Epidemiological &dies have suggested that there are cancer risks from these by-products (Cram 1993). Trihalomethanes (THMs) and haloacetic acids (HAAS)have b k identifii as the two~major classes of disimfectidn by-products in drinking water. Many other disinfection by-products, however, remain to be identified and the public health significance of these is still unknown. The relatively low concentrations of the
various natural and man-made contaminants of drinking water, inabiility to obtain valid and complete exposure histories for individuals, and the chdlenge of controlling confoundiig factors, have made it d8cult for epidemiological studies to detect and estimate risks of cancer~(IL~11993; Craun 1991). The USEPA has developed health criteria for
disinfectantldisinfection by-products outlining concentrations in drinking water that would
result in either no expectation of non-cancer health effects or probability of cancer (Crawford-Brown 1994).
In developing these standards, an analysis of the risks to human health has been performed using standard quantitative risk prediction method (Murphy 1993). Many unanswered questions regarding the sources and magnitude of the uncertainties used in these predictions remain. The most problematic of these concern uncertainties in the models and bodies of data on which predictions of the concentrations of the risk agents are based, the lack of consideration for alternative assumptions that might be used in estimating
risk
and a thorough comparison of these alternatives; the degree of evidential support for the assumptions used in estimating risk; and the treatment of uncertainty and variabidty in risk-based decisions.
While risks from DBPs exist. so do risks from microbes if disinfection does not take place. Disinfection of drinking water for the control of enteric and disease-producing orgad;sms
has been commonly practiced in the United States for many years. Chlorination is the most widely used disinfection method for both drinking water andwastewater. Greater than 200 million people in the U.S. receive disinfected drinking water. Seventy percent of drinking water systems serving 10,000 or more use chlorination, 25% use chloramination, 5% use chlorine dioxide, and 1% use ozone (Farland 1993). One of the major reasons for the large scale adoption in the United States of chlorination was the fact that it had been regarded as highly effective as well as relatively inexpensive. Studies have shown that chlorination alone, as a method of disinfection, is not always effective for the inactivation of some waterborne pathogens (Gerba and Rose 1993).
to make choices under uncertain
conditions
(hbfWHnd Graham 1993). A decision- theoretic framework is needed to analyze the relative merits of dierent disinfection treatment options for drinking water based on a comparison of the resulting competinghks in terms of ~ublic health effects, economic cost to society, and consequences for
herall quality of life. Moreover, deksion-makers involved inihese replat& negotiations
r&ould benefit fiom a framework that includes the representation and use of expert &owledge, the effective manipulation of large databases, a medium for displaying rntcomes, and facilities for explanation of reasoning and conclusions. These aspects of decision-making can be ficili6ted by a decision support system.
The function of an environmental decision support system (EDSS) for DBPIpathogen risk ;analysis is not to automate decisions. It is instead to provide a systematic framework which can faciltate these decisions by:
making explicit how specific models, data and human judgments interact within lines of reasoning to form conclusions concerning the risks,
e assembling and integrating the judgments of experts in the many disciplines needed to understand the risk;
identifvina defensible alternative lines of reasoning;
.
-
r, identifying the reasons for uncertainties within each line of reasoning, and for
uncertainties in selecting from amongst competing lines of reasoning;
l quantifying these uncertainties;
t quantifying the implications of these uncertainties for decisions on the risks;
.$@ faciltating discussion between individuals and/or organizations, allowing the
identification of points of agreement and disagreement in reaching conclusions;
I.
se fianctions of a s u c c e d decision support system must be placed into a framework has several key features ifthe system is to be adopted and applied successfully: r /I
It must make lines of reasoning transparent.
"I B It must firmulate the decision problem and the analysis in terms that are understandable to the users (i.e. not require learning specialized jargon).
"
*$
It must allow reformulation of the decision problem as prioilties and goals of the userusers to address parts of the analysis separately if desired (which enables e tasks between individuals in a team).
' .
' &
. . It must be d c i e n t l y flexible to allow users to explore the problem fiom a wide range ., .,,.-, . ~ of perspectives while providing a default mode of analysis to which users can turn for
"K,
5
guidance.It must be interactive in the sense that users can change aspects of the analysis (e.g.
: introducing new lines of reasoning or new kinds of data or new models) where
*.
-:,
desired.i$ It must be based in sofhvare that is readily available, amenable to use on simple PCs or
. Macs, and simple to use; in an ideal form, it should be accessible through the intern*: , , : - . , : .
It must be "groundtested" in the sense that it has been shown to
fa
to reasonable conclusions in cases where justified decisions already have been made.r It must allow for the possibiity of qualitative analyses (e.g. subjective judgments based on a systematic review of the evidence), semi-quantitative analyses (e.g.
high~mediudow judgments at each of many sequential steps of an analysis, followed bysome process of &aty judgment), and q&titative d y s i s (e.g. formal
statistical andlor Bayesian techniques for judging evidence and conclusions). It must allow consideration not ody of &e u&&nties in risk estimates for pathogens possessing &icient dak to perform a risk assessment, but of the uncertainties introduced by a lack of sufEcient data on pathogens.
By contrast, existing EDSSs for DBPImicrobi risk assessment typically employ a single set of models and parameter values to which the user is constrained in performing the
analysis, and either include no uncertainty analysis or include uncertainty analysis but do not consider the effects of alternative models and data sets (a major source of the
uncertainty). Experience in applying EDSSs to decision-making has shown that there can
be wide disagreement on the uncertainties associated with each step of a risk analysis, as
well as confus'lon about how the quality of evidence is to be judged. It is necessary, therefore, to provide a more systematic framework for judging the strmgth of evidence, ncharacterizing this in a judgment of uncertainty for each premise used in reasoning, and
propagating this uncertainty through to a fkal estimate of risk. This project was designed
.
t evelop such a decision support system for DBPImicrobial risk assessment and to test
J simulations of treatment decisions for one or more water treatment sites
APPROACH
The objective of this on-going research is to produce an environmental decision support system (EDSS) for &-based decision-making,
that
provides a guid'mg framework for analyzing the impacts of alternative disinfection treatment options on human health risks, with a focus on quantifying the associated uncertainty and iden- these areas for fUture research. Working directly with decision-makers and stakeholders, this framework is a vehicle to perform analysis of "what if" scenarios while addressing the goals ofoptimization under uncertainty when dealing with competing risks, and provides a tool for designing, ranking and selecting treatment options, allowing selection of options that are optimized (with respect to risk) to the sitespecific characteristics of water supplies. Through the use of the decision-framework, stakeholders on different sides of the issue- regulators, owners of water supplies, and representatives of the affected public-are able to see the process of reasoning adopted by other sides and demonstrate the rationality of their prop&ed decisions. B~ &ow& the various sides in the debate to see clearly how the positions held by other parties are related to the selection of goals, values, data sets and models, all of the affected parties will benefit.
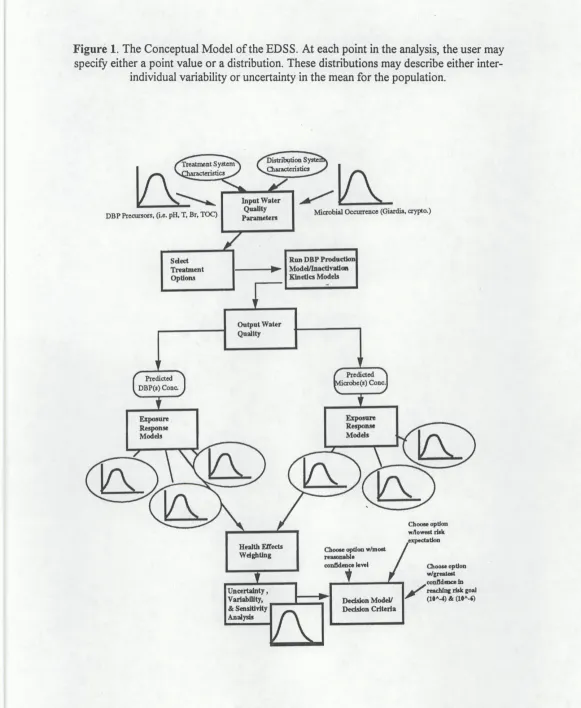
The conceptual model underlying the EDSS is displayed in Figure 1. This shows the flow of input information, model selection, characterization of uncertaintylvariabiity, and output as either point estimates or uncertainty distributions. The system was developed as a tool for the selection of treatment strategies based on:
a the initial concentrations of DBP precursors and microbes in source waters;
the residual concentrations of DBPs and microbes in treated drinking water based on specific treatment train;
the resulting probabiity of cancer endpoints %om the various DBPs in human populations using the treated water;
the resulting probabiity of non-fatal endpoints from the various waterborne pathogens in human ovulations
. .
using the treated water;-
a the composite health impact in identifiable subpopulations using the treated water,
taking into account all health endpoints weighted by the values of the assessor.
Based on a preliminary review of available software, the Am&tica visual modeling tool by Decisioneering Inc. (Systems 1996) was selected as the software environment for
constructing the decision-structure for the EDSS. This platform makes the overall
-
performance of the system more efficient, since it has been created specifically for the depiction of relationships between model components, describiig the essential qualitativenature of the problems being modeled, and defining the quantitative details of the module. Hie-rarchies of the EDSS model were crented to help manage the complex relationships
Figure 1. The Conceptual Model of the EDSS. At
each
point in the analysis, the user mayof cumulative confidence graphs of risk predictions. Each variable has an object window 'that displays inputs and outputs, and allows entry of definitions, units of measure, and other documentary information. This method of documenting variables, inputs, and
makes it easier for the decision makers to understand how individual models
Modeling
DBP
FormationThis EDSS utilizes algorithms taken from the
WTP
(Water Treatment Plant) model of the@A. Rather than use the WTP program directly, however, it was necessary to extract the relevant algorithms for incorporation into thehdytica module. This also allowed the Hnprovement of these algorithms based on updated information concerning DBP 'formation in water supplies.
For trihalomethane formation, the distribution of the compound among the four &ientifiable species-chloroform, bromodichloromethane, dibromochloromethane, and bromofom--is dependent upon the bromide concentration in the water, as well as the eoncentration of other precursors including total organic carbon (TOC) and ammonium
m - N ) , and other factors such as temperature and pH. Waters with elevated bromide +xmntrations tend to shift this distriiution toward the bromidecontaining species
are a variety of factors that influence the formation TWMs and
drinking water treatment including: pH, temperature, type and concentration chlorine concentration, bromide ion concentration, and organic nitrogen
n 1992). Most of the investigations used to derive these findings, been conducted on THMs simply because they have been identified as a by-
ct for the longest period of time. Humic substances, consisting of humic and llvic
,
prevail as the major source of dissolved organic carbon in most natural waters. In ies it has been proven that chlorination of these humic materials produce Ps that are present in finished drinking waters subjected to chlorination as ad (Singer 1995). Moreover, studies have shown that the aromatic es present within these humic substances may be highly reactive with chlorine to
identifiable DBPs (Singer 1993). Generally, the rate and extent with increases in the following parameters: pH, Br
,
$&oncentration, total organic carbon (TOC), and Clz concentration (Singer 1988)..
.
Rater utilities have begun to explore alternative d i e c t a n t s to fiee chlorine to limit the chlorinated by-products. Consequently, ozonation by-products have become as a serious issue. Research has increased over the past decade in an effort toexistence of by-products formed during ozonation of drinking water and the
on of their health impacts. Aldehydes are the most prevalent oxidation by- oduct from ozonation (Glaze 1993). Accordingly, the principal aldehydes
that
have been: formaldehyde, acetaldehyde, glyoxal, and methyl glyoxal. However, drinking water has been shown to produce formaldehyde and acetaldehyde @so, but to a much lesser extent than
that
of ozonation P S I 1993). Other by-productsof which may be removed by biological treatment subsequent to ozonation (White 1992). Bromide-containing source water produces another class of omnation by-products, analogous to the reactions occurring during chlorination, the brominated DBPs, which are formed during omnation and include bromofonn the brominated acetic and acetonitriles. bromoicrin, &d cyanogen bromide.Thu.9, the same parameters that govern the extent and formation of the aforementioned chlorination by-products applv. The most important
precursors are related to the ozone to bromide i d TOC to b-de ratios, anh pH (Glaze
Chlorite (Cia) and chlorate (CIQ.) are the DBP species of concern in drinking water treated with chlorine dioxide. However, the same type of oxidation by-products that are produced through omnation are present in finished water treated with chlorine dioxide.
The initial phase of this work has focused on integrating a set of numerical models
developed fiom chlorination experiments with California State Project and Colorado River Aqueduct waters (Harrington 1992), to simulate the formation of DBPs in drinking water treated with conventional coagulation, flocculation, sedimentation, and filtration, as well
as alternative treatments.
In this preliminarv EDSS. the mathematical models to simulate the formation of DBPs are conditi&d on treatment characteristics and input water quality. These predictive models are interned into the decision-framework as a module and linked to a procedure for risk estima&n for each individual by-product species. The predictive modeis for the THM
species are as follows (all are concentrations):
ac13
= 0.997 x (TOC x w ~ x C L ~ I O S C ~ ~ ~ " ) ~ x taf)' ~x ( ~ r t 1 ) ~ ~ x x @ ~ _ 2 . 6 ) ~ ' ~m 1 3 = 1.28 x (TOC x w ~ ) ~ . . ' ~ x (Cl+7.6 x
NHwZP
x tom x B T ' . ~ x x @ ~ - 2 . 6 ) ' ~The EDSS also predicts two representative HAA's, dichloroacetic acid and trichloroacetic &id, given the following equations:
DCAA = 0.605 x
wB1
x Wmam x (Cl&se)'m x tam x (Bre0.01)- x la.=TCAA = 87.18 x ~0~~ x WmooR).' x ( ~ l & s e ) ~ ~ ' x taZM x ( B r e 0 . 0 1 ) ~ ~ ~ x fl.'.732
The DBP Formation Module of the EDSS is based on the following input parameters :
Treatment System Characteridcs- the type of treatment, including conventional primary treatment with disinfection as a secondary treatment, andlor treatment upgrades consisting of GAC adsorption, membrane filtration, and enhanced
coagulation (with disinfection); the method and concentration of the disinfectant 6.e.. chlorine dose); the point of disinfection; and the contact or reaction time for the disinfectant (t).
The current framework allows for the prediction of the concentrations of THM species, BCAA and TCAA for various specified water qualities attributed to chlorination and dhloramination as a secondary treatment (disinfectant). The formation of chloramination by-products can be estimated as approximately 20% of the concentration of DBP's formed during chlorination, given the same water quality (EPA 1993).
Since the reduction of precursors to disinfection by-product formation may result in a wduction in overall cancer risk, operational and regulatory decisions should incorporate these alternatives as well (Glaze 1993; Black et al. 1996). The EDSS uses algorithms describing the removal O ~ T O C and W absorbance to predict water quality
2
the point of shlorination. The simulation algorithm for enhanced coagulation predicts the removal of TOC and W absorbance in the alum coagulation, flocc&ion, &entation, andhtration processes. The final TOC concentration is calculated as a function of alum dose as-AI2(~0&), raw water TOC concentration, raw water
UV
absorbance, and ation pH(pa).
The enhanced coagulation simulation algorithms are as follows:ln(wd = -464
+
0.879 x In(w-)-
0.185 x In(alumdose)+
0.564 x p&L
ations run in EDSS, the pHc is assumed to 6.3 and the point of chlorinatio be immediately after filtration.
-
fhm3mfffor decision-makina which wmmres the benefits of alternate
r ' ent-trains, the EDSS uses algorithms simulate &e req~oval of TOC resulting &om
i
+ . adsorption and membrane filtration as well. The model considers GAC adsorption
i membrane filtration applied after conventional coagulation and filtration, but before ction Using algorithms presented in the USEPA'S WTP simulation program (EPA
, and simpl5ed by Black, et al. (1996), TOC removal by GAC adsorption and rane filtration is simulated as follows:
where MWCO is the molecular weight cutoff of the membrane in units of Daltons.
In the case of GAC adsorption, an empty bed contact time (EBCT) of 10 minutes and a regeneration frequency of 180 days is assumed. For membrane filtration, the molecular weight cutoff (MWCO) is a variable input parameter, dowing the simulation of
membrane processes over a wide range, including: microfiltration
0,
where MWCO's are typically less than 100,000 daltons; ultrafiltration0,
which covers a wide range ofMWCO's, from 1000-100,000 daltons; and nanofiltration
(NF),
which can be characterized by MWCO's from 300-1000 daltons.Entering sitespecific water quality characteristics, declaring treatment system characteristics, and nmning the predictive algorithms produces an estimate of the concentrations of individual species of TTI-IM, CHCI,, CHClSr, CHCIBrk CHBrs, DCAA, and TCAA in the finished drinking water. These data are then used in a mathematical model of ciucinogenesis for individual by-product species.
Simulating the Inactivation of Microorganisms
. .
A separate module of the EDSS framework simulates the inactivation of waterborne microbes and produces an estimate of the resulting concentrations of two protozoan species: Giardia Iambia and Cryptosporidium parvum. The user may select fiom amongst, or weight into the analysis, several inactivation kinetics models:
0 Chick-Watson first order kinetics (Hiatt 1964).
0 Fust-order kinetics in which disinfectant concentration declines in time (Venczel et al.
1991).
A two-population first-order kinetics model.
In developing the default parameter values for the inactivation kinetics module of the EDSS, a non-linear least squares regression method was used to analyze disinfection (inactivation) kinetics and predict the effluent concentrations of Giardii and
Cryptosporidium. For each of the models above, the microbial concentration was
calculated for the disinfectant (residual) concentration and exposure time, and the ratio of this concentration to the input concentration was computed. Using the non-linear least
.. .
squares regression method, the following quantity (the sum of squares) was rmnunrzed:where Si and Si* are the predicted and measured survival fractions for the microbes, respectively.
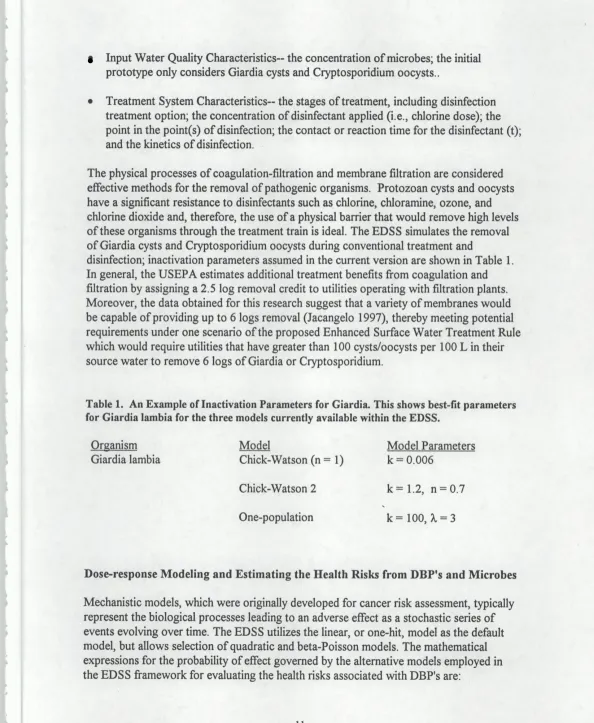
Input Water Quality Characteristics- the concentration of microbes; the initial prototype only considers Giardia cysts and Cryptosporidium oocysts..
w Treatment System Characteristics- the stages of treatment, including disinfection
"
treatment option; the concentration of disinfectant applied (i.e., chlorine dose); the
*.
point in the point(@ of disinfection; the contact or reaction time for the disinfectant (t);
6 ')E6 and the kinetics of disinfection.
of coagulation-filtration and membrane filtration are considered methods for the removal of pathogenic organisms. Protozoan cysts and oocysts
to disinfectants such as chlorine, chloramine, ozone, and '
,
, * 1.
,
the use of a physical barrier that would remove high levels sms through the treatment train is ideal. The EDSS simulates the removal
ridium oocysts during conventional treatment and
1, ers assumed in the current version are shown in Table 1.
the USEPA estimates additional treatment benefits &om coagulation and credit to utilities operating with filtration plants.
suggest that a variety of membranes would (Jacangelo 1997), thereby meeting potential ents under one scenario of the proposed Enhanced Surface Water Treatment Rule
than 100 cydoocysts per 100 L in their water to remove 6 logs of Giardia or Cryptosporidium.
Table 1. An Example of Inactivation Parameters for Giidia. This shows best-fit parameters for Giardia b b i a for the three models currently available within the EDSS.
tbsalhl
MQdd
Model ParametergGiardia lambia Chick-Watson (n = 1) k = 0.006
Chick-Watson 2 k=1.2, n=0.7
. , . I . . ,,'I., ,,.
&,"komai
and'&,hwh/tb$8:4fh
Eksfrom
rns
which were originally developed for cancer risk assessment, typically the biological processes leading to an adverse effect as a stochastic series of
Linear
(one hit): P@) = 1-
emQuadratic (two hits): P@) = 1
-
eWflFor the health
effects
following exposure to microbes, three dose-response models alsowere selected based on the most biologically supportaMe models available in the literature
(m
these equations,N
is the number of ingested microorganisms):Limear
(one hit): P(N) = 1-
e sNL'mear
two-population: P(N)-
& x (1-e4">+
fi
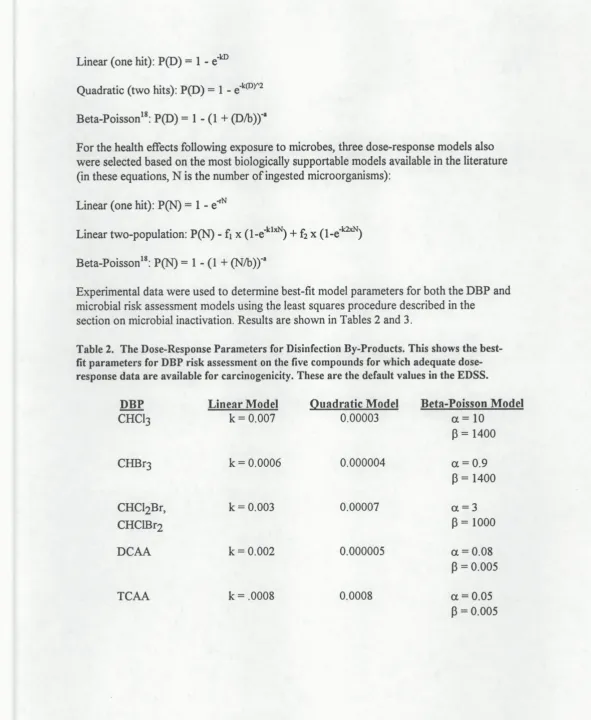
x ( b e yExperimental data were used to determine best-fit model parameters for both the DBP and microbial risk assessment models using the least squares procedure described in the
section on microbial inactivation. Results are shown
in
Tables 2 and 3.Table 2. The Dose-Response Parameters for Disinfection By-Products. Thia shows the best- fit parameters for DBP risk assessment on the five compounds for which adequate dose response data are available for carcinogenicity. These are the default values in the EDSS.
m!E
Linear Mod4CHC13 k = 0.007
DCAA
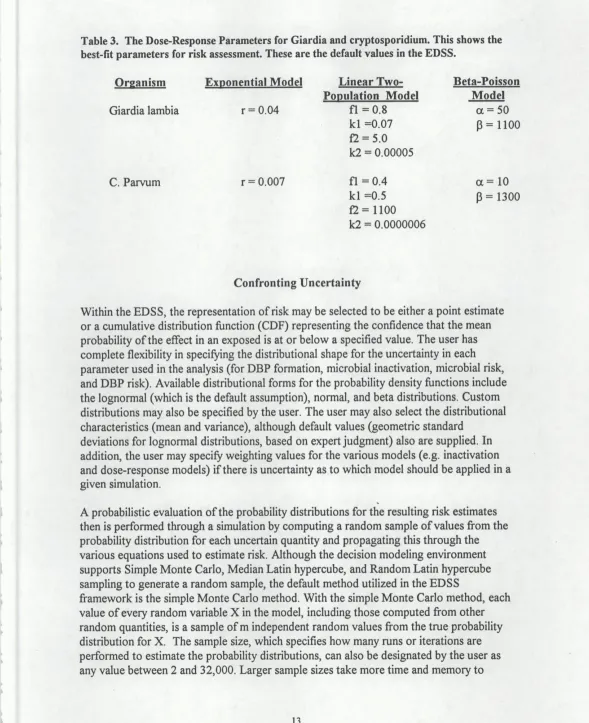
table 3. Rrr Dose-Response Parameters for G i d h and cryptosporidium. This shows the best-fit parameters for risk assessment. These are the default values in the EDSS.
L
. A
Oreanism
Giardia lambii
Linear Two- Beta-Poisson
Poaulation Model Model
fl = 0.8 a = 5 0
k l 4 . 0 7
p
= 1100i2 = 5.0
k2 = 0.00005
Confronting Uncertainty
.Lvthin the
EDSS,
the representation of risk may be selected to be either a point estimate mulative distribution function (CDF) representing the confidence that the meanility of the effect in an exposed is at or below a specified value. The user has flexibiity in specifying the distributional shape for the uncertainty in each parameter used in the analysis (for DBP formation, microbial inactivation, microbial risk,
and
DBP
risk). Available distniutional forms for the probabiity density functions include the lognormal (which is the default assumption), normal, and beta distributions. Custom distributions may also be specified by the user. The user may also select the distributional characteristics (mean and variance), although default values (geometric standarddeviations for lognormal distributions, based on expert judgment) also are supplied. In addition, the us& may specify weighting values for the various models (e.g. inactivation and doseresponse models) if there is uncertainty as to which model should be applied in a
, . . . 1 : . ' " ,
. . i?:-..p ', ,',,,
. . , . I * 7
,. .. > 1.
' 6 . ' ~m.&,51.;...? . ., .i : . h ' s
A probabilistic evaluation of the probabiity distributions for the resulting risk estimates then is performed through a simulation by computing a random sample of values from the probabihty distribution for each unce& quaniity &d propagating this through the various equations used to estimate
risk.
Although the decision modeling environment supports simple Monte Carlo, M e d i i Latin hypercube, and Random Latin hypercube sampling to generate a random sample, the default method utiliid in theEDSS
compute, however, but produce a smoother distribution and more precise statistics. The default sample size in the EDSS is 1,000.
O should be noted that the EDSS as currently configured does not allow calculation of the .mcertainty
CDF
for any percentile of the variability distriiution other than the mean' value. In other words, the uncertainty is calculated based on the uncertainty in the mean
(or other central tendency) value for each parameter entered into the analysis. A more flexible svstem would be one which allows generation of the 111 variabiitv distribution for risks a&ss the exposed population, and then characterizes the u n c e h associated with each uercentile of the variabiitv distriition. The software used to create the EDSS does not, iowever, allow such an approach; the new CrystalBaU Pro has this capabiity, but does not support decision analysis. In addition, such detailed information currently is not
regulatory decisions, so the inabiity to specify uncertainty for other than the tendency estimate of risk is not a significant limitation at present.
'@th respect to uncertainty, there are several key points in the EDSS at which uncertainty
'an
be reflected. It is not necessary to make any of these parameter values and model -"&lections uncertain, but the option at least remains to do so. Proceeding fiom the% e g h h g of the EDSS flow to the end, the key decision points at which uncertainty might be reflected are:
Water quality parameters (temperature, pH, Br concentration, TOC concentration,
NH3-N concentration, UV-254 extinction coefficient, raw water Giardia concentration, and raw water Crypto concentratior
Parameters for kinetics of inactivation of microbes Exposure factors (body weight, ingestion rate for water)
Exposure-Response model parameters for both the microbes and DBPs (slope factor for the linear model, slope factor for the quadratic model, alpha and beta values for the Beta-Poisson model, slope factors and population fractions for the two-population model)
CASE STUDY: THE BROWN WATER TREATMENT PLANT
To test the utility and applicabiity of the EDSS, water treatment facilities in North Carolina were contacted and surveyed for input water characteristics. The Brown Water , Treatment Plant was selected as representative and used as a test case for the EDSS. The
:
-
facility survey was summarized as the input parameters required in the EDSS, and the"
' EDSS used to determine the acceptabiity of a range of treatment options, which then
,$were compared against regulatory goals.
'. hresentatives from the Brown Water Treatment Plant completed a water quality survey,
, ' M c h provided averages andlor ranges of values (concentrations) for disinfection by-
4prcduct precursors, Giardia and Cryptosporidium. Table 4 lists the raw water quality
I .. Qarameters which are precursors to disinfectant by-product formation, as reported by the
''brown Water Treatment Plant.
$$
Table 4. Raw Water Quality at the Brown Water Treatment Plant
Parameter Mean Value or
Range of Values
Temperature-degrees C 5 -29
Bromide @r)-mg/L 0.02
Total Organic Carbon (T0C)-mgL 6.8
PH 6.8
-
7.0Ammonia W - N ) - - m g N L 0.10
W absorbance ( W ~ 4 ) - c m - ' 0.180
P e Brown WTP survey also included information on treatment system characteristics (i.e. the method of primaryImndary treatment, disinfectant type, dose, and residual
concentration). The Brown Water Treatment Plant is a 30 million gallodday (MGD)
conventionsl--coagu1ation, flocculation, sedimentation, filtration-surface treatment plant. The plant uses chlorination as the primary method of disinfection at a dose of 4.0
-
7.0mg&, with a contact time (@0
MGD)
of 221 minutes, and a,mean chlorine residual of0.5 m a . The reported mean raw water concentrations of Giardia and Cryptosporidium were less than 6.1 cystsloocysts per 100L, respectively. Since the facility reported a range of values for pH and temperature, the mean values for pH and T were used.
diierentiate between these.
The
EDSS
was used to predict the eflluent concentrations of THM's and HAA's based on the entered water aualitv characteristicsand
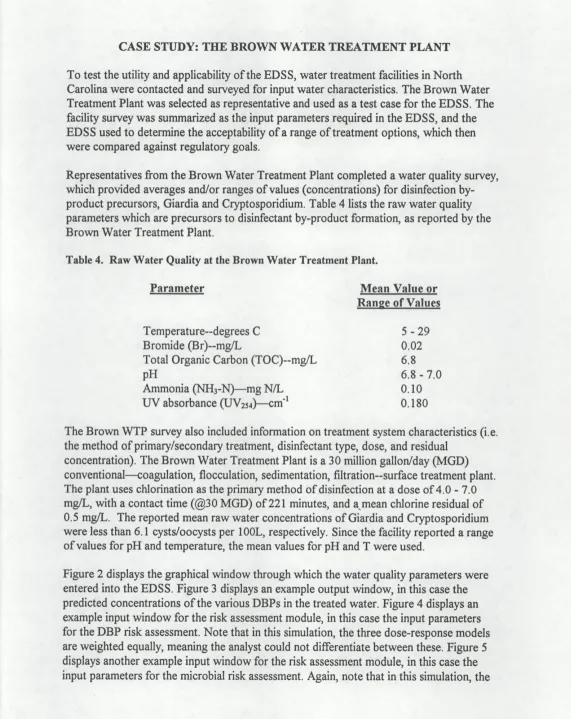
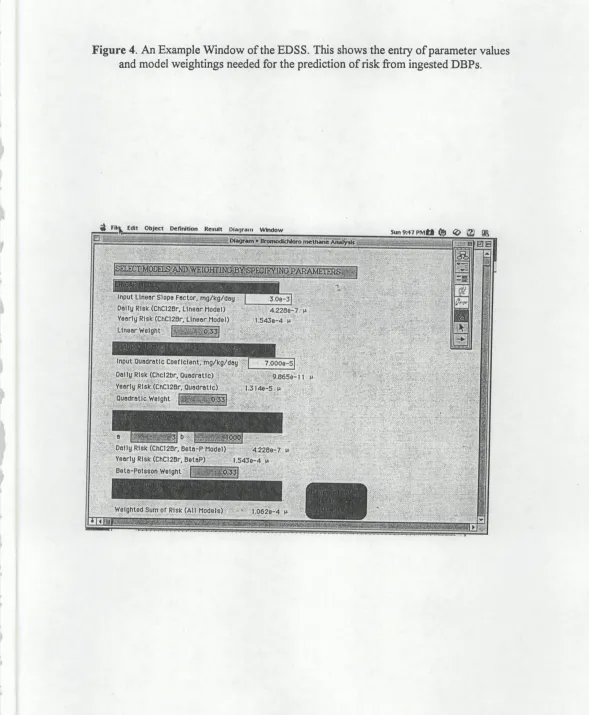
assuming the raw water was treated with conventional coagiatioi, flocculation, sedimentation, and filtration in conjuction with disinfection with a chlorine dose of 7 mg/L. The predicted DBP concentrations h m the Brown WTP ranged from 0 ugL(mi3)
to 93:46 ug/L (TCAA). The concentrations for CHC13, CHCIBR, CHCIZBr, and DCAA were 23.03, 14.09.2.27and
45.22 ugiL,respectively. Chloroform is
a
major by-product of chlorination and has been found in concentrations ranging from 0.7 to 540 ugL, with a mean concentration in chlorinated waters of approximately 26.4 ugL. Bromoform is produced when source waterscontaining bromide are disinfected with chlorine. The range of concentrations reported in finished drinking waters is 0.1 to 2.7 u&, with a mean concentration of 0.5 ugL.
S i i , the predicted concentrations for bromodichloromethane,
dibromochloromethane, DCAA, and TCAA were within the range of concentrations reported in chlorinated supplies.
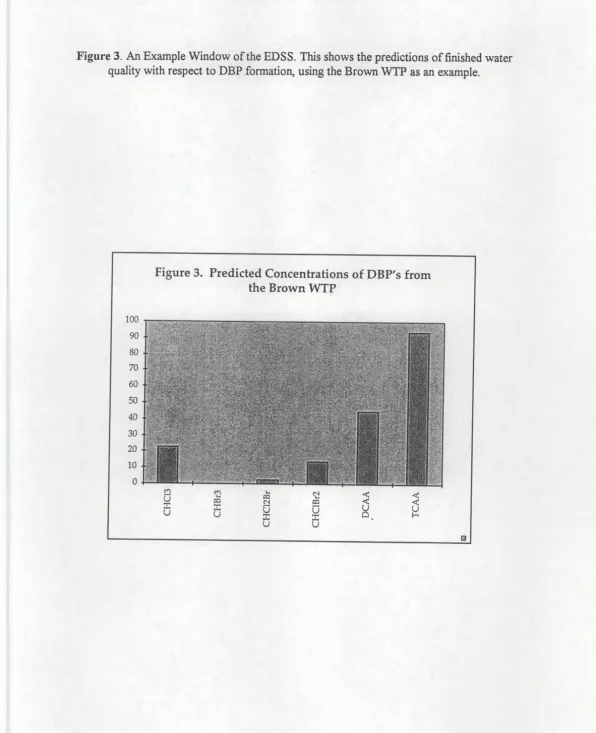
Table 5 lists the resulting probability of cancer %om the ingestion of DBP's fiom the Brown WTP using the linear, quadratic, and beta-poisson model. The weighted sum across all of the models was calculated within the
EDSS,
and has also been included in the table. This weighted sum takes into account thefact
that the analyst was unable todifEmntiate between the various doseresponse models and chose to weight each equally into the analysis.
Based on raw water characteristics. the oredicted concentrations for Giardia and
Cryptospridium were determined to be'8 x
W 5
cystdoocysts per liter using the Chick- Watson model with n=l. The maximum dailv and maximum annual risks were calculated using the exponential, linear t w ~ - ~ o ~ u l a t i o ~ a n d beta-pisson models. Table 6 shows the estimated risk of infection from Giardia and Cryptosporidium in finished drinking water from the Brown WTP.Table 5. Estimated Probability of Cancer from Ingestion of DBP's. This shows the risk from finished drinking water from the Brown WTP.
DBP Predicted Mean Cone I u g m
Mean Mean Mean Annual Annual Annual
Risk Risk Risk Linear Quad Beta-P
Model Model Hodel 2.94E-5 2.19E-7 6.00E-4 3.00E-9 1.45E-6 3.22E-9 1.54E-4 1.31E-5 1.54E-4 6.62E-5 1.50E-5 5.91E-5 3.36E-4 3.01E-6 2.45E-1 2.73E-4 1.245E-6 1.89E-1
Firmre
-
2. An Example Window of the EDSS.This
shows the entry of parameter values for water using the Brown WTP data Where the user doesnot know theFigure 3. An Example Window of the EDSS. This shows the predictions of finished water quality with respect to
DBP
formation, using the Brown WTP as an example.Figure 4. An Example Window of the EDSS. This show the mtry of parameter values and model weightings needed for the prediction of risk from ingested DBPs.
Yearly Risk (ChCI
D a l l y RISk (Chc12br. Ouadmtl
F i 5. AnExample Window of the EDSS. This shows the entry of parameter values
Table 6. Eshated Risk of Infection from G i i nod uyptosporidium.
Predicted Mean Mean Mean Mean Annual Mean Annual Annual Annual Risk Conc. Risk Risk Risk Weighted (per Ll Exp. Two-Pop Beta-P Sum
Modal Wcdal W e 1
>
. C
.,
,In addition to the point estimates provided above, the EDSS allows the assessment of uncertainty in the risk estimates.
As
examples, the output ullceftainty distriiution is shown in Figure 6 for CHCl3 and in Figure 7 for Giardia. The analyst can specify the confidence with which it must be stated that this risk falls below an allowed upper limit, anddetermine whether the simulated treatment system is protective at this level of confidence. This analysis can be performed for each separate compound (each DBP
and
microbe), or from the weighted risk from all compounds.Table 7 presents the probable range of regulatory action that has been indicated by the
USEPA a c e of Drinking
Water.
The maximum likelihood estimates (MLEs) which corresponds to the proposed regulatory levels of lo4 and 10'' for each by-product species have been compared to the predicted species concentrations at the Brown WTP. TheMLJ3 concentrations were developed based on the induction of total kidney tumors in rats (for cHc13 and CHBrs) and mice (for CHCI2Br, CHCIBr2, DCAA, and TCAA) and have been calculated using estimated mean concentrations of the by-products in chlorinated supplies using the multistage model. In comparing the predicted species concentrations from the Brown WTP to the concentrations corresponding to the probable range of regulatory action, it is evident that the utility would not have diiculty meeting the 10"
level of
risk
for CHC13,CHBr3, CHCIzBr, CHClBr2, and DCAk However, the formation of TCAA would pose a potential problem in that the predicted species concentration exceeds the MLFi for a ''01 level of risk.s -r * ;, )I
Table 7. Predicted Concentrations of Selected DBPs Against MLEs. The MLEs are for
proposed regulations.
Disinfection By-Product -3 -3 =zm -*2 OBR
r C M
predicted Mean Concentration
( U d L I 23.03 0 14.09 2.27 45.22 93.46 ULE (ug/Ll for 10s-6 level of risk 104 81 10 20 257 0.69
NLE (ug/Ll for 100-4 level of
Pigwe 6. An Example W d o w of the EDSS, This shows the predictions of model
uncertainty for the rislc of cancer following ingestion of CHCb using the Brown WTP as
an example. The Y axis is the cumulative confidence (confidence that the true mean risk in the exposed population is less than or equal to the value on the X axis).
I
-
0.5
-
0 7
o.oooa+o i
5.ooob5 1 .w 1.5oob4 2 w 25oob4
-
.>.
Figure 7. ~n ~ x a m ~ i e ~indok%f"&e'~]~)~$. This shows the pre&ctions of modd
uncertainty for the risk of cancer following ingestion of Giardia using the Brown WTP as an example. The Y axis is the cumulative confidence (confidence that the true mean risk in
-the exposed population is less than or equal to the value on the X axis).
0 1
O.M)(lc+O 2oooa-3 4aooO-3 6.oooa-3 (I.aooO-3 1.000a2
Based on the predicted species concentrations for CHC13, CHBrs, CHCIBr2, and DCAA,
the utility not would have much diculty meeting the lo4 risk level. However, the TCAA and CHClaBr concentrations are well above the MLE corresponding to a lo4 risk level. The formation of these by-products could potentially limit the use of chlorine at the Brown
WTP.
This Gnding suggeststhat
fUrther
analysis should be conducted to determinethe potential impacts of reducing the chlorine dose at the
WTP.
The need for additional analysis is fiuther substantiated by examining the competing public health risks fiom Giardia and Cryptosporidium.The Surface Water Treatment Rule (SWTR) mandates that all surface waters be treated to achieve at least a 3 log reduction (99.9 percent removal) of Giardia cysts. The rule
requires disiiection for all systems
and
filtration is also required, unless the utility meetscertain indicator bacteria limits and mcuntatns
.
.
a strong watershed protection plan. In general, the USEPA estimates additional treatment benefits from coagulation and filtration by assigninga
2.5 log removal credit to utilities operating with conventional (filtration) plants. Treatment for the removal of Cryptosporidium is not required under the current SWTR, however, the proposed Enhanced Surface Water Treatment Rule (ESWTR) may include requirements for Cryptosporidium. In the proposed ESWTR, inactivatiodremoval requirements based on raw water concentrations of Giardia and Cryptosporidium include 3 logs of inactivation/removal if the raw water cyst/ooeyst concentration for each microbe is less than 1 organism per 100 L; 4 logs ifthe concentrations are between 1 and 10 per100
L;
5 logs ifthe concentrations are between 10 and 100; and 6 logs if the'
concentrations exceed 100 cystsloocysts per 100 L.
The calculated effluent Giardia and Cryptospidium concentrations at the Brown WTP were equivalent to 0.00805 cysts/oocysts per 100 L (approximately 3 log removal). However, the calculated log removal within the Brown
WTP
EDSS, did not include a 2.5log removal credit for filtration (for Giardia). Ideally, the utility could achieve 5.5 log removal of Giardia. In pilot studies conducted jointly by Montgomery Watson Americas,
Inc.
0
and the City of Portland, Oregon Bureau of Water Works, it was determined that it is realistic to expect 5.0 logs of both Cryptosporidium and Giardia removal by filtration, iftreatment conditions are optimized for turbidity and particle removal. Hence,it can be assumed
that
the BrownWTP
would have no diiliculty meeting futureregulations for both Giardia and Cryptosporidium under the current treatment scenario.
The USEPA has recommended that a treatment be provided to ensure that the risk of infection b m Giardia be no greater than 1: 10,000
(lo4)
for an annual (yearly) exposure thereby indicating that this is an acceptable level of safety for drinking water supplies. The predicted yearly risk of Giardia infection in the drinking water supply treated by the Brown WTP ranged fiom 2.35 x 10' to 3.29 x lo-'. The predicted yearly risk ofIt is important to distinguish between infection and illness, which ace not synonymous
terms. In the case of microbid
risks,
an individual cannot become ill without first beina infected. However, d microbial inf&ons do not necessarily progress - - - to illness. For ti;. purposes of this analysis, each day was assumed to constitute a statistidy independent exposure to water with an identical distribution of pathogens. Theoretically, an infection c a d recur repeatedly on a single day. However, there a large amount i f unceaaintyBSSOCiated with the likelihood of an individual being exposed to this degree over the course of a year, and for a lifetime of 70 years. Hence, it
may
be more prudent to examine these risk estimates as a daily and/or yearly probability of an effect (cancer or infection), as they are presented in theEDSS
.
Based on the predicted by-product species concentrations, efnuent Giardia and
Cryptosporidium concentrations, and the associated risks to human health, it evident that further analysis should be conducted to determine the overall health impacts of an
alternate treatment practice at the Brown WTP. For example, a more in-depth analysis examining the public health impacts of decreasing or increaJing the chlorine dose or residual andlor implementing a treatment train which would reduce the level of TOC (thereby reducing the formation of cancer-causing DBP's) would aid decision-makers in
There are several key areas in which a decision-maker will lind limitations in the structure of the cumat
EDSS
and should, therefore, use theEDSS
only ass
partial guide to decisions. These areas are:the
EDSS
does not, as mentioned previously, allow the calculation of the uncertainty associated with percentiles of the variability distribution for risk other than the central tendency value;the
EDSS
does not allow the incorporation of cost into the analysis (focushg only on*I;
the
EDSS
does not formally co&ont the user with risks fiom DBPs and microbes otherthan
those d e s c n i previously; theEDSS
does, however, allow the user tospeoQ
new
DBPs and miwobes to be considered in the analysis (placeholders arepresent ia the
software
to allow entry of these new risk agents) and will automaticallytactm
these agents into the analysis once the relevant parameter values have beenentered,
the
EDSS
- - does not consider health risks associated with the ~rovision of water in adequate supply to a population; it is possible that theED~gcwld
locate an optimaltrratment svstern with rmect to microbial and DBP risk that miaht not be optimal if the ad& of the wa&supPlY is considered; the user should iemain aware of this, the
EDSS
does not incorporate synergbic or antagonistic risks from DBPs; it usesonly the additive model of risk Rlrrently employed in regulatory analyses;
the
EDSS
currently rdects one pet of treatment system performance parameters at atime, the default is always avenge pecformanw, it is recommended that users also
sjmulate conditions under system failure, as these conditions often dominate risk
considerations;
the
EDSS
does not yet simulate the effect of the distribution system;the utiMy of the
EDSS
is depaulent on parameter values that must currently be devdoped from data that acevery
limited, it is recommended that users update all parameter v a l w used in the systemas
new
and better data become available; in f k t , itis recommended that
the
EDSS
beused
also to identifil parameters where there is large'.,The use of this environmental decision support system for comparative risk analysis of
the associated uncertainty. Through the use of this supplies, and representatives of the affected public are
oning adopted by opposing sides and demonstrat based on the same set of basic assumptions. fiamework, a systematic model has resulted, decision-makers to analyze the relative merits of different disinfection and
methods based on some set of criteria.
.
,present, the current framework does not adequately deal with the variability in DBP at the tap, which is attributed to seasonal changes and spatial variability due to ution system residence times. The next phase of this research will be to quant@ this
more research is conducted on developing formation as a result of disinfection with
framework can be extended to employ the
uced in this research, as well as a user's al may be obtained by contacting the Institute for Environmental Studies.
REFERENCES
Black, B., G. Harrington and P. ginger. 1996. Reducing Cancer Risks By Improving Organic Carbon Removal. Journal of American Water Works Association 83: 40-52.
Bull, R 1992. Health Effects of Disinfectants and Disinfection By-products. Rqort to
the AWWA Research Foundatiog Denver, CO.
Craun, G. 1991. Epidemiologic Studies of Organic Micropollutants in Drinking Water. In: Hutzinger 0, ed. Berlin: Springer-Verlog.
Craun, G. 1993. Epidemiological Studies of Water Dishfectants and Disinfection By
Products. Balancing Chemical and Microbial Risks. Washington D. C.: ILSI.
Crawford-Brown, D. 1994. Review of the Scientific Basis of the Final Draft
Disiiectants/Disinfection By-products Health Criteria Documents by the USEPA,
American Water Works Association Report, Washington, DC.
EPA 1993. Manual for the WTP Model, USEPA, Washington, DC.
Farland, W. 1993. U.S. Perspectives on Balancing Chemical and Microbial Risks of Disinfection. In: ILSI, ed. Balancing Chemical and Microbial Risks. ILSI, Washington, D.C. 211-229.
, Gerba, C. and J. Rose. 1993. Estimating Viral Disease Risk from Drinking Water.
"' In: ILSI, ed. Balancing Chemical and Microbial Risks. ILSI, Washington, DC. 117-128. Glaze, W. 1993. Evaluating the Formation of Brominated DBPs During Ozonation.
Jo~rnal of AWWA 79: 96-103.
Harrington,
G.
1992. Developing a Computer Model to Simulation DBP Formation* During Water Treatment. Journal of AWWA 78:78-87.
Hiatt, C. Kinetics of the Inactivation of V i s e s . ~acterioloaic~l ~ e v i e w 28: 150-163.
Holden, J. 1982. Health Effects Due to the Cessation of Chlorination of Wastewater Treatment Plant Effluent. Re~ort to the Illinois Institute ofNatural Resource% Chicago,Ill.
ILSI. 1993. AReview of Evidence on Reproductive and Developmental Effects of Disiiection By-products in Drinking Water. Washington, D.C.
Murphy, P. 1993. Quantifying Chemical
.
.
Risk
from Epidemiological Studies. In: &&@pf Water D~smfection: Balm-cal and Microbial Risk. ILSI, Washington,
DC. 373-387.
, I ,@&am, S. and J. Graham. 1993. Chemicals Versus Microbids in Drinking Water: A
' :, Pecision Science Perspective. Journal of AWWA 795761.
'iaeg& S. and J. Christen. 1996. Estimating the Risk of Acquiring Infectious Disease -,Ih:
+ from Ingestion of Water. Cambridge University Press, Cambridge, Mass.
Jlose, J., C. Haas C. and S. Regli. 1991. Risk Assessment and Control of Waterborne Giardiasis. American Journal of Public Heal& 81:709-713.
&inger, P. 1988. Formation of Halogenated Organics. Raort to the Water Resources '
Research Institut~, University of North Carolina.
$inger, P. 1993. Formation and Characterization of Disinfection By-Products. In: ILSI,
ed.
Balancing Chemical and Microbial Risks. ILSI, Washington, DC. 201-209.!, , qinger, P. 1995. DBPs in Chlorinated North Carolina Drinking Waters. Journal of AWWA
a.
-
- .-nr*-: -a9"LC;?' ., -1.. 8 .. -
8 . . . r : , , ,? . ,, ., .. i.
.
.'#, . W k k ' ~ ;Systems. 1996. User's Guide to Analytica Visual Modelling Tool. Lumina. Denver, CO. venczel, L., M. Sobsey and D. Crawford-Brown. 1991. The Inactivation Kinetics of
a
Monochloramine on Monodispersed Hepatitis A Virus and MS2. Advances in Water Analvsis and Treatment Technology 26531.' White, C. 1992. Handbook of Chlorination and Alternative Disinfectants. 3rd ed. Van . .. -
Chick-Watson kinetics: hdviation kinetics characterized by a single compartment, linear first-order reaction.
Disinfeotion by-products: chemicals produced as the result of
the
addition of disinfectants to water supplies. In the pmemt case, this is due to the addition of chlorine, and the reactions are primarily with organic materials.Environmental Decision Support System
(EDSS):
a computer-assisted guide through the stages of reasoning needed to compare the rislrs from alternative water treatment systems.Input Water: the water entering a treatment fac'ility.
Inter-subject variability: the variation of a parameter across a defined population due to differences such as ingestion rates, body mass, etc.
MLE" an abbreviation for
Maximum
Limit on Exposure, which is the maximal allowed concentration in drinking water consistent with risk-based goals.Output Water: the water exiting a treatment fac'ility and to be used as drinking water.
Pathogen. o microbe capable of inducing health effects.
Residuals: the microbes and DBPs remaining after treatment of a water supply.
Risk: a summary measure of the probability and severity of effects in a population.
Total Organic Carbon (TOC): the concentration of carbon in a water supply in the fonn of organic carbon.
Treatment Train: the collective stages of treatment of water agplied at a treatment facility.


![Figure 7. uncertainty ~n ~ x a m ~ i e ~indok%f"&e'~]~)~$. for the risk of cancer](https://thumb-us.123doks.com/thumbv2/123dok_us/1344740.1167330/31.611.27.598.25.738/figure-uncertainty-n-x-m-indok-risk-cancer.webp)
