A
BSTRACTADAMS, JAVON MARCELL. Development of a Performance-Based Mix Design and Performance-Related Specification for Chip Seal Surface Treatments. (Under the direction of Dr. Y. Richard Kim).
This dissertation presents the research efforts made in developing a performance-based mix design and performance-related binder specification for chip seal surface treatments. Extensive literature review, in addition to meetings and discussions with bituminous pavement professionals nationwide, reveals that in existing chip seal surface treatment design practice there is a clear lack of performance-based design principles, as well as an absence of performance-related specifications for selecting asphalt emulsion material for use in constructing chip seal surface treatments. Existing methods of design and emulsion specification for chip seals are based on empirical or outdated methods, and lack chip seal performance data to substantiate the methods. This dissertation research involved the
development a performance-based mix design procedure and a performance-related emulsion specification for chip seal surface treatments that was validated using both laboratory and field performance.
This dissertation presents a new performance-related mix design method for chip seal surface treatments. Chip seal surface treatments are composed of two main components: asphalt emulsion and aggregate. The design of these components represents the balance that will dictate the performance of the chip seal surface treatment under traffic loading.
concept is validated by the aggregate loss and bleeding test results obtained from the third scale Model Mobile Loading Simulator (MMLS3). This validation study used granite 78M and lightweight aggregate with CRS-2L emulsion, which are the typical materials
predominately used for chip sealing in North Carolina, to fabricate the chip seal specimens in the laboratory. Three different gradations with vastly different performance uniformity coefficients (PUCs) were used for each of the two aggregate types. An optimal AAR for each gradation was determined using the modified board test. Field validation sections were constructed in order to validate the performance of the chip seal mix design under field laboratory and environmental conditions.
Additionally, this research presents the development of performance-related specification parameters and relationships to be utilized in the selection of the asphalt
Development of a Performance-Based Mix Design and Performance-Related Specification for Chip Seal Surface Treatments
by
Javon Marcell Adams
A dissertation submitted to the Graduate Faculty of North Carolina State University
in partial fulfillment of the requirements for the Degree of
Doctor of Philosophy
Civil Engineering
Raleigh, North Carolina
2014
APPROVED BY:
_______________________________ _______________________________ Dr. Y. Richard Kim Dr. Roy Borden
B
IOGRAPHYJavon Marcell Adams was born in Queens, NY on November 22, 1984. He is the son of Dennis and Louise Adams, and the brother of Jerry Adams. While he was born in New York, he was raised in Dudley, NC in Wayne County for a majority of his upbringing. Javon attended Southern Wayne High School and graduated with honors in June 2002. The
following fall of 2002, he enrolled at North Carolina State University to pursue a degree in Civil Engineering. In December of 2007, he graduated Cum Laude with a Bachelor of Science degree in Civil Engineering with a concentration in Transportation Engineering. While completing his undergraduate coursework, Javon conducted research under the direction of Dr. Y. Richard Kim in transportation materials. This undergraduate research opportunity led to Javon enrolling in graduate school at North Carolina State University in the spring of 2008 to conduct research in the field of pavement preservation as a graduate research assistant. He held this position throughout his graduate studies, and would also serve as a graduate teaching assistant for two semesters. In December 2009, Javon received his Master’s of Civil Engineering with a 3.8 grade point average. Following his successful completion of the Master’s degree program, Javon continued his graduated studies at NC State University in pursuit of his doctor of philosophy degree. At the onset of his doctorate studies in 2010, Javon was awarded the highly competitive National Academies Ford Foundation Pre-Doctoral Fellowship Award which provided three years of fellowship support during his studies. Over the years while conducting research in pursuit of his doctorate degree, Javon would work on both state and nationally-funded research projects in the field of pavement preservation, and published peer-reviewed papers through the
A
CKNOWLEDGEMENTSFirst of all, I would like to collectively acknowledge every relative in both the Shields and Adams families; as well as every friend, teacher, mentor and inspirational figure that I have been fortunate enough to come into contact with during my time on this earth. I have learned something from so many of you that has contributed to my perspective, knowledge, and understanding which has helped me through the many trials and challenges that life has presented. While unfortunately I will not be able to name each and every person individually, I hope that you understand that you all have had a lasting impact on my life. Over the years, a great number of people have expressed lofty expectations for my future, which at the time may have been far beyond what I could even foresee for myself. I hope that I am on the path to living up to those expectations and that I have substantiated your confidence in me. No one accomplishes anything truly significant alone, and I hope that those who have supported me in any way throughout the years, take some measure of pride in my completion of this milestone.
stressful times in my pursuit of the doctorate degree. Thank you love. Also, for their contributions during my upbringing and high school years, I would like to thank every teacher, counselor, coach, friend or teammate who pushed me academically or athletically. The lessons I learned in our time together have not been lost on me, and you all have helped me gain an understanding of the work ethic I needed to succeed in any venture I chose to pursue.
For their support during my college years, I would like to thank all of the staff of the Minority Engineering Program and the Office of Academic Affairs. Their programs greatly contributed to my successes and helped me avoid a great number of failures along the way. I gained so many valuable life experiences thanks their programs and initiatives, and I intend to do everything in my power to pay it forward to the next generation of NC State students. I would like to directly acknowledge Dr. Tony Mitchell and Dr. Jerome Lavelle who showed me that there is more than one way an engineer can contribute to the world. I would also like to thank the Director of the Minority Engineering Programs Angelitha Daniel, who provided endless mentorship, friendship, opportunities, and support throughout the last decade I have studied at NC State. She was the first person to tell me that I would someday become Dr. Adams, even when I did not see it nor believe it. I want to thank her for believing in me and I am glad that I was able to prove her right.
Next, I would like to acknowledge those people who have had such a tremendous impact on my research journey to the doctorate degree. I would like to thank and
other’s support and encouragement. I would also like to acknowledge Diane Gilmore, who has been a friend and confidante who helped me to maintain sanity during many insane times. I cannot thank you enough for all of your help as you watched over me and did
everything in your power, many times far outside your job description, to make my life more manageable so I can focus on my research. I would also like to give special thanks to the entire NCDOT for their support, with very special thanks to Averette Moore and Tim Garrett of the NCDOT. These gentleman moved heaven and earth to construct well over 50 field test sections during my research, and ultimately allowed me to validate my laboratory findings in true field conditions. Thank you for your trust in our research and for making each field experience such an educational and enjoyable experience.
I would like to thank all of my dissertation advisory committee members who provided your valuable expertise and insights into my research. While the time and
contributions of all committee members have been extremely helpful in my research, I would like to specially thank two committee members in particular. I would like to thank Dr. Roy Borden who has served as a mentor and counsel to me since I was in his undergraduate soil mechanics class many years ago. His words of encouragement have helped me navigate through both my undergraduate and graduate career, and his engineering knowledge and expertise has greatly improved my research. I appreciate our many conversations in Mann Hall as they always seemed to occur at the perfect time. I would like to acknowledge Dr. Cassie Castorena whom I cannot thank enough for her contributions during the many
T
ABLE OFC
ONTENTSL
IST OFT
ABLES………….……….………... ixL
IST OFF
IGURES………... x1. B
ACKGROUND ... 131.1 Research Needs and Significance ... 13
1.2 Research Objectives ... 15
2. L
ITERATURER
EVIEW–
P
ERFORMANCE-B
ASEDM
IXD
ESIGN FORC
HIPS
EALS ... 162.1 Distresses in Chip Seal Surface Treatments ... 17
2.2 Factors Affecting Chip Seal Performance ... 25
2.3 Chip Seal Mix Design Methods ... 30
3. L
ITERATURER
EVIEW–
P
ERFORMANCE-R
ELATEDS
PECIFICATION FORC
HIPS
EALS ... 363.1 Asphalt Binder Material Selection for PRS Development ... 37
3.2 Performance Parameters for Chip Seals ... 38
3.3 Chip Seal Performance Parameters Influenced By Binder Properties ... 39
4. P
ERFORMANCET
ESTS ANDA
NALYSISM
ETHODS ... 454.1 Mixture Performance Tests and Analysis Methods ... 45
4.2 Binder Material Performance Test Methods ... 63
5. P
ERFORMANCE-B
ASEDM
IXD
ESIGN FORC
HIPS
EALS
URFACET
REATMENTS ... 695.1 Performance-Based Mix Design Framework ... 69
5.2 Validation of Mix Design Method via Performance Testing ... 88
5.3 Texture Depth Correlation between MMLS3 and Field Traffic Loading ... 101
5.4 Field Validation of Performance Based Mix Design ... 107
5.5 Performance-Based Mix Design Conclusions ... 111
6. D
EVELOPMENT OF AP
ERFORMANCE-R
ELATEDS
PECIFICATION(PRS)
FORC
HIPS
EALS ... 112L
IST OFT
ABLESTable 2.1. Summary of Existing Mix Design Methods ... 31
Table 3.1. Survey Results of Most Common Distresses in Chip Seal Surface Treatments (Gransberg and James 2005) ... 41
Table 3.2. In-house Chip Seal Construction Issues Survey Results (Gransberg and James 2005) ... 41
Table 3.3. Contracted Chip Seal Construction Issues Survey Results (Gransberg and James 2005) ... 42
Table 5.1. McLeod Method’s Qualitative Existing Pavement Surface Correction Factor (McLeod 1969) ... 85
Table 5.2. Final Mix Design EAR vs. Gradation for Granite 78M Aggregate ... 86
Table 5.3. Final Mix Design EAR vs. Gradation for Lightweight Aggregate ... 87
Table 5.4. Full Factorial Combinations of Aggregate and Emulsion. ... 88
Table 5.5. Field Traffic Counts and FHWA Vehicle Axle Configurations ... 103
Table 5.6. Characteristics of the Chip Seal Sections Used in This Study ... 105
Table 6.1. Residual Asphalt Contents for Chip Seal Emulsions... 121
Table 6.2. MMLS3 Loading Time vs. Applied Wheel Loads ... 124
Table 6.3. Relationship between Vialit and MMLS3 Aggregate Loss for Chip Seal Emulsions (Im 2013)... 162
L
IST OFF
IGURESFigure 2.1. Example of streaking of a chip seal after construction... 20
Figure 2.2. Example of typical debonding in a chip seal. ... 20
Figure 2.3. Example of partial bleeding failure. ... 21
Figure 2.4. Bleeding due to heavy truck traffic and hot weather (Lawson et al. 2007)... 22
Figure 2.5. Example of a flushed pavement surface (Lawson et al. 2007). ... 23
Figure 2.6. Explanation of PUC parameter. ... 28
Figure 2.7. States of embedment of chip seals (Hanson 1934). ... 32
Figure 3.1. Asphalt binder grades used in chip seals (Gransberg and James 2005). ... 38
Figure 3.2. Most common distress modes identified by survey respondents to NCHRP Synthesis 342 (Gransberg and James 2005). ... 43
Figure 4.1. Chip seal emulsion spraying procedure. ... 46
Figure 4.2. ChipSS aggregate spreading procedure. ... 47
Figure 4.3. Image of chip seal sample compactor. ... 48
Figure 4.4. Greenhouse for temperature control during specimen fabrication. ... 50
Figure 4.5. MMLS3 test preparation: (a) installation of specimens on steel base, (b) side view of MMLS3, (c) positioning the MMLS3 in the temperature chamber, and (d) complete MMLS3 test setup. ... 52
Figure 4.6. Image processing procedure for chip seal specimens: (a) original scanned specimen image, (b) identification of bled area, (c) image processing, and (d) bleeding input into Matlab software for pixel-based processing. ... 54
Figure 4.7. Cross-section of a triple seal specimen after MMLS3 loading (Lee 2007). ... 56
Figure 4.8. Schematic diagram of the laser scanned cross-section of a triple seal. ... 57
Figure 4.9. Vialit test apparatus. ... 58
Figure 4.10. Hard rubber loading wheel for modified sweep test. ... 59
Figure 4.11. Schematic diagram for the mean profile depth determination (Transit New Zealand 2005). ... 61
Figure 4.12. Photo of the 3-D laser profiler scanning a chip seal field section. ... 62
Figure 4.13. Schematic diagram of the laser scanning procedure: (a) for a field section and (b) for a MMLS3 sample. ... 63
Figure 4.14. Schematic of the BBS test apparatus to measure the force required to remove a pull-out stub affixed to an aggregate substrate. ... 67
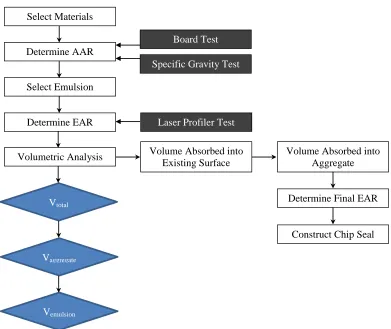
Figure 5.1. New mix design framework. ... 70
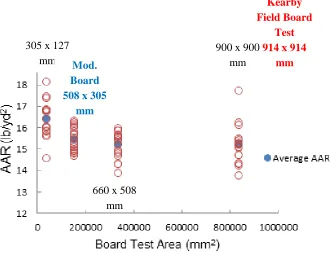
Figure 5.2. Board test area vs. AAR analysis. ... 72
Figure 5.3. Average AAR for 508 mm by 305 mm board test replicates. ... 73
Figure 5.4. Schematic of aggregate board test (profile view). ... 76
Figure 5.5. Graphic representation of lost laser data point conversion. ... 79
Figure 5.6. Visual description of 50% embedment assumption. ... 79
Figure 5.7. Simple geometric explanation of 50% embedment concept. ... 81
Figure 5.8. Profile of existing asphalt surface. ... 83
Figure 5.10. Aggregate loss performance of granite 78M aggregate. ... 90
Figure 5.11. Aggregate loss performance of lightweight aggregate. ... 91
Figure 5.12. Aggregate loss performance of granite 78M aggregate: (a) Gradation A, (b) Gradation B, and (c) Gradation C. ... 93
Figure 5.13. Aggregate loss performance of lightweight aggregate: (a) Gradation A, (b) Gradation B, and (c) Gradation C. ... 94
Figure 5.14. Granite 78M aggregate bleeding performance. ... 95
Figure 5.15. Lightweight aggregate bleeding performance. ... 95
Figure 5.16. Verification of optimal EAR for granite 78M aggregate: (a) Gradation A, (b) Gradation B, and (c) Gradation C. ... 97
Figure 5.17. Verification of optimal EAR for lightweight aggregate: (a) Gradation A, (b) Gradation B, and (c) Gradation C. ... 98
Figure 5.18. Bleeding vs. EAR for granite 78M gradation B shown along with the mix design optimum EAR. ... 100
Figure 5.19. Bleeding vs. EAR for granite 78M gradation B for two batches of CRS-2L emulsion obtained from the same company at different time periods. ... 101
Figure 5.20. FHWA vehicle class description. ... 104
Figure 5.21. MPD changes under MMLS3 vs. field traffic loading for: Section 1 (a) Section 2 (b), Section 3 (c), Section 4 (d), and Section 5 (e)... 106
Figure 5.22. Close-up image within the wheel path of a chip seal section showing no bare spots or evidence of excessive aggregate loss. ... 109
Figure 5.23. Longitudinal image of the chip seal field section after sweeping; showing no early signs of bleeding within the first week of traffic loading. ... 109
Figure 5.24. Longitudinal image of CRS-2L field validation section after one year in service showing no evidence of bleeding. ... 110
Figure 6.1. Asphalt binder grades typically used in chip seals. ... 116
Figure 6.2. Conversion of field AADT to MMLS3 equivalent wheel passes... 125
Figure 6.3. % Bleeding vs. MSCR Jnr at low traffic. ... 130
Figure 6.4. % Bleeding vs. MSCR Jnr at medium traffic. ... 131
Figure 6.5. % Bleeding vs. MSCR Jnr at high traffic. ... 131
Figure 6.10. a) Measured % bleeding vs. Jnr relationship and determination of the maximum
allowable Jnr for high traffic, (b) mixture bleeding performance predicted from measured
binder Jnr values at 58°C, and (c) mixture bleeding performance predicted from measured
binder Jnr values at 64° and 70°C. ... 145
Figure 6.11. Effect of binder modification on MMLS3 rutting performance shown after MMLS3 loading times of 0, 30, and 90 minutes for: (a) CRS-2, (b) CRS-2L, and (c) HP-CRS-2P. ... 148
Figure 6.12. High temperature rutting performance for modified and unmodified binders at 990 MMLS3 wheel passes. ... 149
Figure 6.13. Correlation between bleeding and rutting at multiple high temperature grades. ... 151
Figure 6.14. BBS vs. aggregate loss at intermediate temperatures of the chip seal PRS. .. 153
Figure 6.15. BBS pull-off tensile strength plotted as a function of temperature. ... 154
Figure 6.16. Aggregate loss vs. BBS at 15°C using recovered residue on rock substrate curing method for BBS specimen fabrication. ... 155
Figure 6.17. Aggregate loss vs. BBS at 25°C using recovered residue on rock substrate curing method for BBS specimen fabrication. ... 156
Figure 6.18. Aggregate loss vs. BBS using curing on rock (COR) substrate method for BBS specimen fabrication. ... 157
Figure 6.19. Bond strength development for a typical chip seal emulsion as a function of curing time (Im 2013). ... 159
Figure 6.20. Dry vs. wet BBS test results for chip seal emulsions. ... 161
Figure 6.21. Field performance rating for high volume PME sections constructed at Chin Page Road with a traffic volume of 5000 AADT. ... 164
Figure 6.22. Longitudinal and close-up images of raveling loss issues observed at the unmodified CRS-2 field section on Chin Page road. ... 164
Figure 6.23. Relationship between % aggregate loss and BBS within the intermediate temperature range... 166
Figure 6.24. Determination of minimum BBS limit for low traffic... 168
Figure 6.25. Determination of minimum BBS limit for high traffic. ... 170
Figure 6.26. Determination of minimum BBS limit for medium traffic. ... 172
Figure 6.27. Determination of PRS limits for the early curing BBS test conducted after 4 hours of curing. ... 173
Figure 6.28. Determination of PRS limits for wet BBS test after 4 hours of dry curing and 16 hours of moisture conditioning at 40°C. ... 175
Figure 6.29. Comparison of dry and wet bond strengths for modified and unmodified emulsions. ... 176
Figure 6.30. Stiffness (S) estimated for BBR temperature at -6°C, -12°C and -18°C. ... 179
Figure 6.31. m-value estimated for BBR temperatures of -6°C, -12°C and -18°C. ... 180
Figure 6.32. Example of the performance-related specification table for chip seal surface treatments. ... 183
Figure 6.33. CRS-2 field validation section showing no performance issues. ... 186
1.
B
ACKGROUND1.1 Research Needs and Significance
Over the last decade, great emphasis has been placed on pavement preservation nationwide. One of the most cost-effective preservation treatments is the chip seal. A chip seal is an asphalt surface treatment formed by applying emulsified asphalt and aggregate. Chip seal surface treatments provide a durable surface layer that protects the existing pavement surface from water infiltration and environmental aging/oxidation effects.
Additionally, a safety benefit of chip seal surface treatments is that it adds skid resistance to the road surface by increasing the roughness of the surface. Chip seal surface treatments are currently used worldwide, and in North Carolina where the research is being conducted, over 50% of the paved road miles are covered by a chip seal surface treatment. During the course of conducting this chip seal research, the existing chip seal test methods and design
procedures were reviewed and evaluated carefully. The review of existing design procedures revealed a clear need for a new chip seal design procedure that can encompass newer
materials and is based on performance. Specifically, the existing design methods do not take into consideration lightweight materials, or the use of polymer-modified emulsion, which are used nationwide in current chip sealing practice.
The earliest design procedure for chip seal treatments was developed by Hanson
seeks to provide effective quantitative methods and techniques for determining the appropriate AAR and EAR for the chip seal surface treatment to be constructed.
Chip seal treatments (or chip seal mixture) are an effective means of improving surface quality and extending the service life of pavements. Chip seal treatments are treatments that are applied to a large surface area of an existing roadway to slow future deterioration and maintain or improve the roadway’s functional condition (without increasing its structural capacity). The chip seal mixture of materials that make up the surface treatment is constituted of a layer of asphalt emulsion, along with a single layer of aggregate; which is then
compacted and is subjected to traffic loading conditions. The design of chip seal treatments has undergone significant developments over the past two decades, particularly in South Africa, France, Australia, New Zealand, and the United States. In the United States, these treatments have become increasingly important as tools for highway agencies to use in response to the aging and deterioration of the nation’s road network.
The quality of an asphalt emulsion, a primary constituent of a chip seal mixture, is directly related to the performance expected from the chip seal mixture (which is formed when the emulsion interacts with the aggregate during chip seal construction. The most commonly used forms of asphaltic binder in chip seals are cationic rapid setting asphalt emulsions. An asphalt emulsion is a combination of asphalt binder, water, emulsifying agent, and in some cases, a polymer. Although it is well known that the properties of the asphaltic binder are critical to the performance of the chip seal surface treatment, current specifications for asphaltic binders used in chip seals are empirical in nature and do not use binder
properties that are related directly to the performance of the chip seal treatment. For example, emulsion residue is graded based on the so-called penetration system, a system that was phased out for hot mix asphalt (HMA) binders in the United States in the 1960s and almost completely abandoned by the mid-1980s.
In order to develop a fundamental framework for binder selection, the following steps should be taken:
Differentiate between construction-related and material-related in-service failures; Understand the mechanism(s) associated with the most important failures; and Select a test system to measure the binder properties that are related to each type of
failure.
Performance-related specifications (PRS) that specify quality in terms of long-term performance will help in the selection of the proper binder for a specific application. Although such PRS have been developed for the constituents of HMA mixtures used in pavements, PRS are not readily available for binders used in chip seal treatments. The urgent need for such PRS for binders used in chip seal treatments is clearly shown in the responses to surveys conducted by Johnston and King (2008). The survey results strongly suggest the need to develop a climate-driven, performance-related grading system for asphalt emulsions used in surface treatment applications. The survey responses also provide information regarding the long-term vision held by many professionals who work with chip seals and other surface treatments. These expectations include:
A high temperature grade based on climate and traffic to prevent rutting and bleeding; Low and intermediate temperature grades based on climate to prevent aggregate loss;
1.2 Research Objectives
The overall objectives of the research herein are to:
Validate the developed chip seal mix design and performance-related specification parameters using both laboratory and field performance testing.
To accomplish these objectives, an extensive review of existing literature was conducted, followed by rigorous laboratory and field experimental work to develop the research outcomes detailed in this dissertation.
2.
L
ITERATURER
EVIEW–
P
ERFORMANCE-B
ASEDM
IXD
ESIGN FORC
HIPS
EALSOver the years, continuous efforts have been made by state highway agencies (SHAs) and government agencies worldwide with regard to pavement preservation. Preventive maintenance, implemented via chip seal surface treatments, has increased steadily as cost-effective measures to extend the life of pavements have become a high priority. Therefore, it is imperative for the agencies that utilize this surface treatments alternatives, and optimize their usage, to extend the service life, decrease life cycle costs and increase safety. In a previous study (Ksaibati et al. 1996) directed at evaluating the use of surface treatments in the United States, twenty-five highway agencies rated their surface treatments as good, seven (including the North Carolina Department of Transportation, or NCDOT) rated their chip seals as average, and three rated them as fair. Not a single highway agency considered its chip seal operations to be excellent. Several agencies, including those in Minnesota, Virginia, South Dakota, Wyoming, and Saskatchewan in Canada, recognized the need to improve overall pavement performance and therefore invested funds into evaluating their surface treatment operations (Ksaibati et al. 1996, Roque et al. 1991, Shuler 1986).
Originally, chip seals were used exclusively for the construction of low traffic volume roads, but with advances in emulsion quality, construction techniques, and overall knowledge, chip seals have evolved into a maintenance alternative that can be successful for both low and high traffic volume pavements (Gransberg 2005).
distress. Any structural deficiencies must be remedied prior to the application of a chip seal. However, various triggers, such as surface wear, decreased skid resistance, and water infiltration, serve to initiate the selection and construction of a chip seal. In North America, physical evidence of distress and water infiltration constitutes the most common triggers for the necessity of chip seals (Gransberg 2005).
In this section, major distress types in chip seals are first reviewed because the objective of a chip seal mix design method is to select materials and application rates properly to ensure satisfactory performance of a chip seal over its design life within the available resources and the performance is primarily governed by these distresses. Also reviewed in this section are existing chip seal mix design methods.
2.1 Distresses in Chip Seal Surface Treatments 2.1.1 Aggregate Loss
traffic whip-off factor is included in the aggregate design equation. Reasonable values to assume are 5% for low volume residential types of traffic and 10% for higher speed roadways, such as county roads (McHattie 2001).
In addition, aggregate loss reduces the frictional characteristics of the pavement surface, which can result in the loss of skid resistance and cause other associated problems, such as bleeding (Jackson et al. 1990). Although aggregate loss can occur within the wheel path, it is most common in the areas outside of the wheel path where aggregate embedment is not as deep due to less traffic loading (Senadheera and Khan 2001).
Early aggregate loss is a phenomenon that occurs under early traffic loading on a newly constructed chip seal surface. Different binders have varying resistance to early aggregate loss when loaded. Though construction and mixture design factors have a large effect on early aggregate loss, this performance characteristic is also shown to be affected significantly by the emulsion type that is used (Lee 2007).
Low temperature aggregate loss can occur when the pavement temperature drops and the asphalt binder becomes brittle. In this brittle state, the binder can become less able to withstand the force of traffic loading, which can lead to the loss of aggregate particles from the chip seal. This phenomenon occurs both at night when the temperature tends to drop, and during the cold winter season. Researchers have identified that low temperature raveling is a primary distress in chip seal surface treatments (Walubita et al. 2005). This phenomenon is related directly to the residue characteristics of the binder used in constructing the chip seal.
2.1.2 Stripping
types in the chip seal treatment. In short, stripping is raveling that is induced through the combined effects of moisture and traffic, and is therefore referred to as wet raveling. Some documents that discuss chip seal surface treatments utilize the term stripping to describe dry raveling. For this research, aggregate loss that can be attributed to moisture damage under loading is considered as stripping.
2.1.3 Debonding
Figure 2.1. Example of streaking of a chip seal after construction.
Figure 2.2. Example of typical debonding in a chip seal.
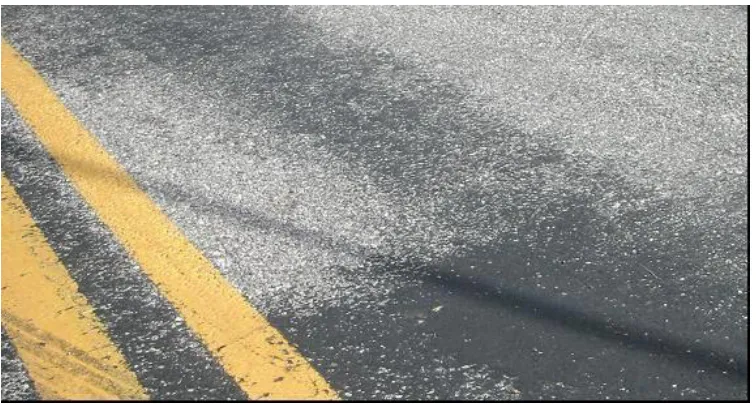
2.1.4 Bleeding
softening of the residual binder which can lead to binder stretching beyond its elastic limit under traffic loading. The main issue with bleeding is the loss of skid resistance associated with the distress, which in turn significantly decreases the overall safety of the road as well as the effectiveness of the chip seal (McLeod 1969, Gransberg 2005). The reduction in surface texture associated with bleeding is the foundation on which the New Zealand chip seal deterioration model is based. The New Zealand specifications indicate that the texture depth after a one-year inspection is the most accurate indication of the performance of the chip seal over its expected life. The chip seal is said to have reached the end of its design life when its texture depth drops below 0.9 mm on a road where vehicles reach speeds higher than 70 km/h on average (Transit New Zealand 2002).
where the treatment undergoes the most frequent and consistent loading (SHRP 1993). Figure 2.4 illustrates bleeding in a chip seal surface treatment.
Figure 2.4. Bleeding due to heavy truck traffic and hot weather (Lawson et al. 2007).
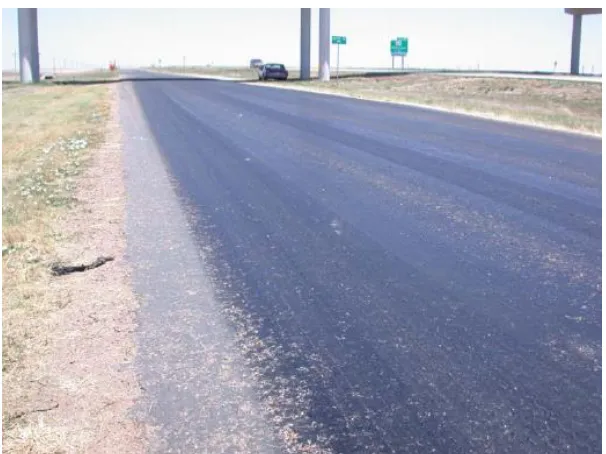
2.1.5 Flushing
Flushing is the migration of the asphalt binder to the pavement surface at high temperatures, causing a reduction in the surface texture depth of the treatment. Throughout the chip seal literature, the terms bleeding and flushing are used interchangeably to describe two separate phenomena. Therefore, it is important to define the ways these terms are
interpreted and used for the purposes of this research. Both bleeding and flushing involve the same basic performance mechanism, which is the reason the terms are often loosely
substituted for each other. Both distresses involve excess binder filling the voids and permeating through to the surface. The difference between the two distresses is the
of a flushed chip seal surface treatment. Like bleeding, the primary problem associated with flushing is the loss of skid resistance.
Figure 2.5. Example of a flushed pavement surface (Lawson et al. 2007).
2.1.6 Cracking
due to the thin layer of the chip seal itself (Epps et al. 2005). Thermal/shrinkage cracking, also called transverse cracking, is thought to be significant in chip seals because such cracking is related to environmental effects caused by contraction of the asphalt pavement under cold weather conditions. Thermal/shrinkage cracking is associated most closely with the properties of the asphalt binder residue in the chip seal. Researchers consider transverse cracking to be related more to the underlying pavement structure than to the surface
treatment itself that provides no structural strength (Walubita et al. 2005). However, some binders have material properties that are more resistant to thermal cracking than others. Another form of cracking that occurs in chip seal surface treatments is reflective cracking, whereby cracks from the underlying surface migrate up through the surface treatment. One of the main features of chip seals is their ability to help mitigate reflective cracking on the pavement surface. The ability to retard reflective cracking is related to the binder material properties of the surface treatment.
2.1.7 Rutting
In multilayer chip seal surface treatments, such as triple seals, permanent deformation can occur under repeated loading in the wheel path. This permanent deformation is referred to as rutting. The main problem associated with rutting is that during rainy conditions the rut fills with water, which can lead to dangerous hydroplaning issues for vehicles. Structural deficiencies in the underlying pavement layers can also lead to rutting on the asphalt pavement surface. Any structural deficiencies of the existing pavement surface should be corrected prior to fabricating a chip seal at a given location. However, rutting resistance can be related to material properties of the binder, as the recoverable strain, or high temperature viscosity of the binder, relates to the rate and overall depth of rutting.
2.1.8 Loss of Skid Resistance
2005). Existing surface conditions that indicate that the existence of a potential safety hazard include bleeding and rutting, among others.
Skid resistance changes as a function of time. Usually, skid resistance increases in the first two years following construction as the asphalt is worn away by traffic, then decreases over the remaining life of the pavement as the surface aggregate becomes more
polished. Skid resistance tends to increase in winter when wet and cold weather roughens the surface, and tends to decrease in the summer. This seasonal variation in skid resistance is significant and should be taken into account when considering the skid resistance of
respective locations. Additionally, it is believed that the winter recovery in skid resistance is not enough to balance out the summer polishing of the road surface (Jayawickrama and Thomas 1998, Hunter 2000).
2.2 Factors Affecting Chip Seal Performance 2.2.1 Aggregate and Emulsion Application Rates
One of the most important components of chip seal design and construction is the selection of appropriate application rates. In particular, the application of an excessive
amount of aggregate can be problematic in chip seal field construction. If too much aggregate is applied, excess aggregate is whipped off by rapidly moving traffic, which creates a safety hazard and wastes materials. An incorrect assumption often made regarding the
adhere and the large stones are likely to be brushed off (Benson and Gallaway 1953), which affects the grading of the aggregate layer as well. It has been reported that an excess of aggregate material is often more detrimental than a slight shortage of aggregate, in that with an excess of cover material the amount of fines applied is also increased (Kearby 1952).
2.2.2 Aggregate Gradation
Aggregate gradation also plays an important role in the design, construction, and ultimately the performance of chip seals. Ideally, the specified gradation should be such that the texture of the seal is consistent. Tight gradation bands, which ensure a uniformly graded aggregate with minimal fines and dust, are desirable for an effective treatment. The literature and field surveys indicate that single-sized aggregate with less than 2% fine passing the No. 200 sieve is considered ideal (Gransberg 2005). One advantage of using a single-sized aggregate in a chip seal is that it maximizes the contact area between the tire and the seal surface. This contact increases the frictional area, and in effect, improves the skid resistance as long as the emulsion application rate (EAR) is appropriate (Herrin et al. 1968).
Ideally, the aggregate should be as close to uniform size as possible and be
economically reasonable, so that the surface treatment has a single aggregate layer. If there is a significant difference between the largest and the smallest particles, the asphalt film may completely cover the smaller aggregate and thus prevent the proper embedment of the larger particles. As a general rule, the largest size aggregate in a surface treatment should be no more than twice the smallest sized aggregate, with a reasonable allowable tolerance for both oversize and undersize to allow for economical surface treatment production (The Asphalt Institute 1964). As the magnitude of the tolerance is increased (for budgetary reasons), it is believed that overall performance quality is decreased. Therefore, depending on the
Additionally, Benson and Gallaway (1959) found that an increase in the fine content from 0 to 30% of the total aggregate causes 10% more aggregate loss. This gradation issue is tied directly to economic considerations, because aggregate costs increase as the gradation requirements for chip seal construction become more restricted. However, in the case where two aggregates are otherwise the same in price and quality, the aggregate that has the uniform gradation is preferred.
Kandhal (1987) also reports a reduction in the aggregate retention capabilities of a surface treatment with the use of graded aggregate. These graded stones contain additional smaller particles that tend to fill the voids between large particles and, thus, may not become effectively embedded into the applied asphalt.
2.2.2.1 Performance Uniformity Coefficient (PUC)
The aggregate PUC is a performance indicator of aggregate gradation and gives an indication of the uniformity, or lack thereof, of the aggregate source being analyzed. In chip seal surface treatments, gradations that are more uniform perform better than those that are less uniform in terms of the aggregate loss and bleeding failure criteria. Therefore, the PUC of the aggregate source will have an effect on the bleeding and aggregate loss performance of the chip seal surface treatment being constructed (Lee and Kim 2009).
The concept of the PUC is founded on principles that are based on McLeod’s chip seal failure criterion. Essentially, McLeod’s premise that 70% embedment is the ideal embedment for chip seal surface treatments is implemented in the PUC definition. The PUC is the ratio of the percentage passing at a given embedment depth (PEM) to the percentage
is defined as the percentage passing that corresponds to 1.4 (or two times the embedment depth, E, of 0.7) times the median particle size, with the median particle size defined as the particle size of which 50% of the gradation passes through the sieve. In the case of a chip seal, the PEM value should be low, because a low percentage of the gradation passing at the
bleeding failure criterion indicates that the aggregate particles in that range of the gradation are larger and less susceptible to bleeding than smaller particles would be. Conversely, for the P2EM criterion, if the value is high, the percentage of aggregate particles that do not meet
the aggregate loss criterion is low, and therefore less aggregate loss is expected.
Figure 2.6. Explanation of PUC parameter.
Figure 2.6visually displays the concept behind the PUC. In theory, if the aggregate is embedded in emulsion up to 70% of its median (M) particle size, the particles that are
smaller than 0.7M will be submerged completely in the emulsion and, therefore, will experience bleeding. Ideally, then, the smaller particles should be larger than 0.7M to avoid bleeding. Conversely, the particles that are bigger than 1.4M are likely to be lost when trafficked because they will be less than 50% embedded after trafficking. In this case, the larger the coarse aggregate particles, the more likely aggregate loss will occur.
Thus, the closer the PUC value is to zero for a particular aggregate gradation, the more uniformly the aggregate is graded. In other words, the PEM value that is closer to 0%
and the P2EM value that is closer to 100% indicate a uniform gradation that corresponds to
2.2.3 Material Selection for Chip Seal
Material selection for chip seal design and construction generally is based on product availability, aggregate/emulsion quality, and the climate of the potential construction site. Aggregate selection is a function of geological availability and the distance that the aggregate must be transported. The existing pavement surface, the size of the job, the aggregate
gradation, and local climate must be taken into consideration for the asphalt selection process (Gransberg 2005). Typically, aggregate that is positively charge is used with negatively charged emulsion, and vice versa. As aggregate is often based on geological availability, the charge (anionic or cationic) of the emulsion is selected to fit the aggregate.
There are a few main emulsion types typically used in a chip sealing application. Generally, rapid setting (RS) binders are used for chip sealing, as the curing characteristics of this binder best match the construction and traffic opening timeline for this surface treatment type. Typical emulsions used for chip sealing include, CRS-2P, CRS-2L, and CRS-2. CRS stands for “cationic rapid setting”, and the number “2” represents the viscosity of the binder (1 or 2 are the typical viscosity grades with a 2 representing a higher viscosity). The “P” and “L” designation represent polymer and latex binder modification, respectively. CRS-2P and CRS-2L are differentiated from CRS-2 in that they are modified binders to improve the performance capabilities of the material. CRS-2P is a polymer modified binder. The polymer used is usually a Styrene-Butadiene-Styrene (SBS) polymer for CRS-2P emulsion. While CRS-2L is a latex modified product. The polymer and latex modification in these binders is intended to improve the aggregate retention capabilities of the binder as the polymer
The emulsion type selected for a chip seal construction is dependent upon a few main factors. One factor is the traffic demand (ADT) on the roadway where the chip seal will be applied. Most often, modified binders are used in more critical traffic applications with higher volumes, while unmodified binders are used in lower traffic volume settings. Another factor is cost, as certain polymer modified binders are more expensive to acquire than
unmodified binders. Lastly, availability based on location and the ability of the local emulsion suppliers to provide quality material factors into the decision on which emulsion type is used for chip sealing.
The specifications for chip seals in North Carolina call for granite (No. 78M for the aggregate size) and CRS-2 or CRS-2L/2P (latex/polymer-modified emulsion) for the emulsion type (NCDOT Standard Specifications for Roads and Structures 2002). The most commonly used size of aggregate for a single seal is a nominal maximum aggregate size (NMAS) of 3/8 in. (9.525 mm) (Gransberg 2005). Lightweight aggregate is also used often as the aggregate material in chip seal construction in North Carolina because it provides a highly skid-resistant surface, good color contrast to improve visibility in daylight and at night, a surface that reduces paint striping maintenance, and it completely eliminates windshield damage caused by flying loose aggregate, which is a major concern associated with chip seal surface treatments (Epps et al. 1974).
2.3 Chip Seal Mix Design Methods
Table 2.1. Summary of Existing Mix Design Methods
Modified Kearby McLeod 2004 New
Zealand
Factors for AAR
Board test Aggregate gradation Flakiness index Bulk-specific gravity
of aggregate
Loose unit weight of aggregate Wastage Aggregate gradation Flakiness index Bulk-specific gravity of aggregate Wastage Factors for EAR AAR Bulk-specific gravity of aggregate Loose unit
weight of aggregate Traffic correction Surface condition correction Seasonal adjustment Percentage of
residual asphalt in emulsion
Aggregate gradation Flakiness index Traffic correction Bulk-specific gravity
of aggregate
Loose unit weight of aggregate
Surface condition Aggregate absorption Percentage of residual
asphalt in emulsion Traffic volumes
Aggregate gradation Flakiness
index
Average daily traffic (ADT) Percentage of
heavy commercial vehicles per day
Texture depth Soft substrate Absorptive
surfaces Steep grades Aggregate
shape Traffic
Hanson Method
The Hanson method was designed originally for cutback liquid asphalt, and it is based on the average least dimension (ALD) parameter of the aggregate source used in the mix. The ALD is calculated by using calipers on a representative amount of the aggregate source (at least 200 pieces or more) to obtain a value that represents the aggregate layer in
essentially its rolled, compacted state. Hanson observed that when aggregate is dropped from an aggregate spreader onto newly applied fresh asphalt, the voids between the aggregate particles are approximately 50%, meaning 50% of the available aggregate voids are filled with emulsion. His theory was that when the layer is compacted, this value is reduced to 30%, and it is reduced further to 20% when the aggregate is compacted under traffic loading, as displayed in Figure 2.7. Hanson specified the percentage of voids to be filled by residual asphalt to be between 60% and 75%, depending on the type of aggregate and traffic level (Hanson 1934).
Figure 2.7. States of embedment of chip seals (Hanson 1934).
approx. 20% voids approx.
30% voids
Aggregates after trafficking (some breakdown and embedment) Aggregates after initial rolling
Aggregates dropped at random on aspahalt
Average height of aggregates
Average height of aggregates
Average AST thickness equals ALD of aggregate approx.
2.3.1 2004 New Zealand Method
The Hanson method, over time, has evolved into the 2004 New Zealand Design Method. This method was developed as a performance-based chip seal design method that considers the aggregate loss during the first winter after construction as well as the chip seal voids reduction model (Transit New Zealand 2005). One of the major difficulties involved in the design of material application rates, which is addressed in the 2004 New Zealand
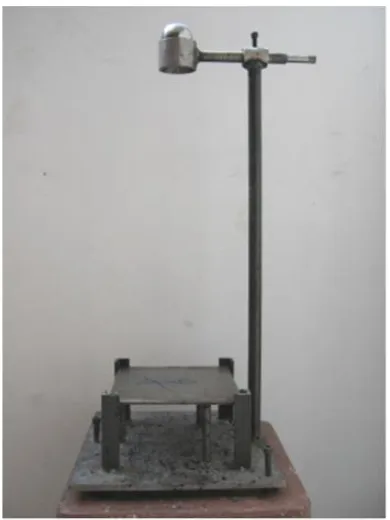
Method, is non-uniformity of the substrate. The 2004 New Zealand employs a substrate correction factor using the sand circle (sand patch) test for the texture depth of the substrate and the ball penetration test to measure the substrate hardness. The ball penetration test involves measuring the penetration that a 19 mm ball bearing makes in a sample of the substrate after the ball is struck one time with a Marshall hot mix-compaction hammer (The Asphalt Institute 1997). New Zealand reports that, for its location, typical ball penetration values for reseal surfacing are in the range of 2 to 3 mm. In cases where the ball penetration value is greater than 5 mm, the substrate is deemed to be too soft for a chip seal to be
constructed. Soft substrates are said to occur when the resealing is over a previous chip seal, or when an asphalt or pavement repair has not fully cured or hardened. The problem with substrate softness is that it can lead to a deeper embedment of the aggregate than if the surface treatment was constructed on a hard substrate. This problem increases the likelihood of premature flushing of the surface.
2.3.2 McLeod Method
embedded into the pavement, the aggregate is single-sized (with a slight modification to the equation for graded aggregate), and the aggregate will ultimately be arranged so that the thickness of the aggregate layer is equal to approximately the ALD of the aggregate source. With this method, additional consideration must be given to the type of aggregate, type of supporting layer, climatic variations, etc.
The equation used to determine the quantity of asphalt emulsion also is based on several assumptions. One assumption is that 20% of the total surface treatment will be comprised of asphalt (80% embedment of aggregate). Also, it is assumed that the aggregate is single-sized, as with the determination of the aggregate quantity (also containing a modification to the equation for graded aggregate). Lastly, the temperature during measurement is 60°F (otherwise the value must be adjusted).
The appropriate asphalt type and grade to be used depends on the aggregate size and surface temperature at the time of application, and are determined by a chart developed by McLeod. The Asphalt Emulsion Manufacturers Association and the Asphalt Institute have adapted and furthered McLeod’s work by providing recommendations for asphalt types and grades for various aggregate gradations, and for correction factors to the AAR based on existing surface conditions.
2.3.3 Kearby Method
on the optimal aggregate embedment depth. The percentage of embedment should be increased for hard aggregate and reduced for soft aggregate in the case of chip seals being constructed on an existing hard surface. For chip seals under heavy traffic, the percentage of embedment should be decreased, along with the use of large-sized aggregate particles; and under low volume traffic, the percentage of embedment should be increased, with the use of mainly medium-sized aggregate particles.
2.3.4 Modified Kearby Method
application rate is determined by an equation that includes the traffic level (vehicles per day per lane), the existing surface conditions, the residual quantity of asphalt in the emulsion or cutback, and field factors based on field experience.
According to the study conducted by Epps (1974) on chip seals with lightweight
aggregate, the modified Kearby method appears to be the most effective methodology for the prediction of the AAR.
3.
L
ITERATURER
EVIEW–
P
ERFORMANCE-R
ELATEDS
PECIFICATION FORC
HIPS
EALSThe current specification for the selection of binders for chip seal construction is based on testing that measures material properties that are not related to the performance of chip seal mixtures (Vijaykumar et al. 2012). The development of a performance-related
specification for chip seals seeks to address these shortcomings by directly relating binder tested material properties to chip seal mixture performance.
An extensive literature review was conducted consulting existing information that is relevant to asphalt binders used in chip seal treatments. The literature review examined published and unpublished reports, contacts with public and private agencies, industry organizations, and other domestic and foreign sources, and aimed to establish the following factors for the research:
Performance parameters critical for chip seals
Factors and mechanisms that affect the performance of chip seals
Critical emulsion and residual binder properties that relate to the performance measures for chip seal
Test methods and equipment that measure the determined critical emulsion and residual binder properties
The literature review began by evaluating the materials utilized in chip seals in order to identify the most common materials that are used in chip seal construction for different locations and environmental conditions.
3.1 Asphalt Binder Material Selection for PRS Development
In 2005, Gransberg and James authored NCHRP Synthesis 342, Chip Seal Best
Practices (2005). In this synthesis, the authors consider the asphalt binder materials used for chip seals in the United States and Canada. Thirty-one states responded with specific grades they used, as shown in Figure 3.1.
Figure 3.1. Asphalt binder grades used in chip seals (Gransberg and James 2005).
3.2 Performance Parameters for Chip Seals
In order to carry out the objectives of this research, it is first necessary to identify the types of distresses that occur in chip seal treatments and then, from this list of possible distresses, identify those that are most critical and most appropriate for developing the PRS. The critical distresses have been identified for each surface treatment type through a
literature review and via feedback from chip seal industry experts.
3.2.1 Chip Seal Distresses
The distresses that have been identified as occurring in chip seals are listed below. The following paragraphs describe each distress.
Raveling
Stripping (wet raveling) Bleeding
0 5 10 15 20
Nu
mbe
r of S
tates
Flushing Cracking
Rutting (multiple seals)
Full descriptions for each of these distresses are provided in the literature review presented previously in Section 2.1 of this dissertation.
3.3 Chip Seal Performance Parameters Influenced By Binder Properties
From the literature review, as well as information gleaned from preservation
professionals, a list of key emulsion performance characteristics has been compiled as they relate to chip seal surface mixture performance. These performance characteristics are defined, outlined, and prioritized in this section.
3.3.1 Determination of Critical Distresses
The following performance characteristics (or distresses) are prioritized and ranked based on the literature review conducted for chip seal surface treatments as well as survey
information collected from government highway agencies and asphalt surface treatment practitioners. The performance of chip seal surface treatments will be evaluated based on the following performance characteristics ranked from most important to least important:
1) Raveling
and moisture conditions. Also, bleeding and flushing are combined in the previous list because existing literature and practice do not make a clear distinction between the two, as the physical manifestation of the bleeding and flushing are the same. The justification for these rankings is given in the subsequent sections of this report.
3.3.1.1 Survey Results Considered in Performance Characteristic Rankings
In 2005, Gransberg surveyed various pavement maintenance agencies regarding chip seal performance. These agencies were asked to rank the most common distresses that were observed during construction of chip seal surface treatments. Table 3.1 provides the results of this survey.
From these survey results, it is seen that bleeding is the most common distress observed in all of the countries included in the survey. This distress is followed by streaking (which is a construction-related and not a material-related distress), and corrugation.
Corrugation is a distress that occurs due to shoving in the pavement surface in areas of traffic starts and stops (i.e., intersections). Corrugation is associated with the strength and design of the underlying pavement layers but not necessarily the characteristics of the chip seal
Table 3.1. Survey Results of Most Common Distresses in Chip Seal Surface Treatments (Gransberg and James 2005)
U.S. Canada Australia New Zealand
South Africa
United
Kingdom Total
Bleeding 54 9 4 2 1 1 71
Streaking 43 5 0 1 0 1 50
Corrugation 41 2 1 0 0 0 44
Cracking 30 5 3 2 0 0 40
Raveling 24 8 1 2 1 1 37
Transverse
Joints 29 4 0 0 0 0 33
Longitudinal
Joints 17 3 1 0 1 0 22
Potholes 4 6 2 0 0 0 12
Table 3.2. In-house Chip Seal Construction Issues Survey Results (Gransberg and James 2005)
Issue U.S. Canada Australia New Zealand
South Africa
United
Kingdom Total Early
Raveling 18 3 0 1 0 0 22
Early
Flushing 15 1 1 1 0 0 18
Flushed
Intersections 14 2 0 1 0 0 17
Flushed
Patches 9 2 1 1 0 1 14
Raveling
Patches 5 1 0 1 0 1 8
Raveling –
Table 3.3. Contracted Chip Seal Construction Issues Survey Results (Gransberg and James 2005)
Issue U.S. Canada Australia New Zealand
United
Kingdom Total
Early Raveling 25 6 0 1 0 32
Flushed
Intersections 15 4 0 1 0 20
Early Flushing 13 3 2 2 0 20
Flushed Patches 13 3 1 1 1 19
Raveling –
Evenings 6 3 0 0 0 9
Raveling
Patches 1 1 0 0 1 4
From the same surveyed group, pavement maintenance agencies were asked about the primary performance issues that occurred for those agencies that constructed chip seals in-house as well as those that subcontracted their chip seal construction operations. The above tables present the survey results. The information presented in these tables indicates that, among the issues related to the construction of chip seal surface treatments, flushing and raveling are deemed to be the most important.
Figure 3.2. Most common distress modes identified by survey respondents to NCHRP Synthesis 342 (Gransberg and James 2005).
In this survey, 81% of the survey respondents identified bleeding as the most common distress, 67% stated that raveling was the most prevalent problem, and 49% identified both bleeding and raveling as distresses occurring equally in chip seal surface treatments. This survey provides further support for ranking bleeding and raveling as the most critical performance characteristics in chip seal surface treatments.
3.3.1.2 Literature Review Findings for Performance Characteristic Rankings
In addition to these survey results, the literature review conducted further solidifies the rankings of the performance characteristics. For instance, other research efforts state that chip seal deterioration occurs as a result of bleeding, raveling, and oxidation of the binder, which leads to cracking (Sprayed Sealing Guide 2004, Epps et al. 2001). The New Zealand chip seal guidelines support this concept as they directly identify texture loss and cracking as the main sources of chip seal failure. More specifically, texture loss as a failure source is defined as premature binder rise, flushing, bleeding, or aggregate loss (Transit New Zealand 2005). Among these critical performance characteristics identified by the literature, bleeding and raveling are still widely considered to be the two most problematic distresses in chip seal surface treatments for ranking purposes (Benson and Gallaway 1953, Holmgren et al. 1985).
With the surveys and a variety of examples from the literature clearly identifying bleeding, aggregate loss, and cracking as the three most critical performance characteristics in chip seal surface treatments, the literature review for this study sought to identify other distress characteristics that are relevant to chip seal performance. Rutting also has been identified as a relevant performance characteristic in chip seal surface treatments, although the literature review and survey information do not support this distress being as critical as bleeding, aggregate loss, or cracking. This omission in the literature of rutting as a critical distress is likely due to the fact that rutting applies only to thick chip seal surface treatments, such as triple seals. Also, permanent deformation performance often is related to the
structural strength of the underlying pavement layers, which is not always a material-related performance issue. However, rutting in triple seal surface treatments can be related to binder properties, and therefore can occur independently of the underlying pavement layers’
structural strength.
damage in the seal and aggregate loss caused by other mechanisms are combined, i.e., there is no clear delineation between wet and dry aggregate loss. However, for asphalt concrete, the effects of moisture-induced processes are defined separately from non-moisture-induced processes, and it is believed that the industry would be better served by similarly delineating dry and wet aggregate loss performance. It is for this reason that stripping (wet raveling) and dry raveling are considered as two separate distresses, even though the net effect is the same (loss of cover aggregate). Efforts to reduce moisture susceptibility traditionally have involved adding anti-stripping agents to the asphalt binder prior to emulsification. Furthermore,
laboratory evidence suggests that certain polymer-modified asphalts are effective in reducing stripping characteristics (Shuler 1998).
3.3.1.3 Distress Summary
From the survey results and literature review conducted, it is clear that bleeding and aggregate loss are the most critical performance characteristics associated with chip seal surface treatments. Aggregate loss is ranked as the most critical performance characteristic for chip seal surface treatments because the loss of aggregate particles are directly hazardous to vehicles, and also leads to bleeding (ranked as the second most critical distress) in the chip seal as bare (bled) spots result from excessive aggregate loss. Additionally, other distresses such as stripping and early raveling are associated with the aggregate retention capabilities of the chip seal surface treatment.
University (NCSU) research facilities contain various tools to replicate the chip seal sample construction process. These resources are discussed in detail in the following sections.
The first step in constructing chip seal specimens in the lab is to obtain a felt disk in the desired size/shape of the chip seal specimen to be fabricated. In the case of this research, these felt disks were 305 mm x 356 mm on which 305 mm x 178 mm samples were
fabricated. In order to make the 305 mm x 178 mm samples on the felt disk, a template was created and placed on top of the sample during the emulsion spraying process to ensure consistent dimensions and rates for each sample replicate. The template ensures that the emulsion reaches only the desired area. In addition, in order to apply the emulsion to the felt disk in a manner that simulates the emulsion being sprayed from the truck in the field, a paint spray gun is used. It is recommended that this paint gun shoot at a rate of, or exceeding, 5.4 gallons per hour (ideally a rate of 7.2 gallons/hour would be used to spray polymer-modified emulsions, which are more viscous). Lastly, a weight scale is used to monitor the amount of emulsion that has been sprayed onto the felt disk (to ensure accurate emulsion application rates during sample fabrication). The emulsion spraying process is depicted in Figure 4.1.
Figure 4.1. Chip seal emulsion spraying procedure.
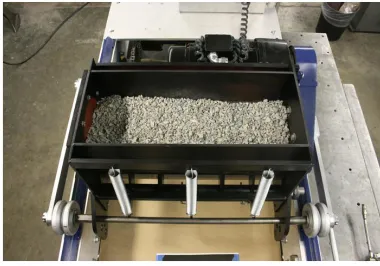
shape and size of the chip seal specimen. Following this step, the felt disk with newly applied emulsion is then positioned underneath the chip seal spreader (ChipSS). The automated aggregate spreader is displayed in Figure 4.2.
Figure 4.2. ChipSS aggregate spreading procedure.
(a) Filled aggregate into hoper (b) Ready to spread aggregate on the felt disk
Prior to the beginning of sample fabrication, the aggregate spreading machine is calibrated to drop the amount of aggregate required to achieve the desired AAR for the sample being fabricated to ensure the desired rate is applied. The AAR is controlled by two parameters: the box and drum speeds. The box speed is the speed at which the box moves across the sample, and the drum speed is the speed at which the rotating drum (located inside the aggregate hopper) rotates and drops the aggregate. At lower box speeds, more aggregate is dropped onto the sample, and vice versa at high speeds. At lower drum speeds, less aggregate is dropped out of the hopper, and vice versa for high drum speeds. Using these concepts, the AAR can be controlled effectively during specimen fabrication.
After the aggregate is applied, and the excess outside of the designated sample area is swept away, the aggregate weight is measured (to determine the exact amount of aggregate that was applied), and the sample is compacted. The compaction device is shown in Figure 4.3.
Figure 4.3. Image of chip seal sample compactor.
combination roller (a combination of steel wheel and pneumatic tires), which has been found to be the most effective type of roller in the field. This procedure is necessary because the steel supplies great compaction force, while the rubber material helps minimize the breaking of chips that occurs when the steel wheel is used alone for compaction.
The compaction procedure involves three compaction passes across the horizontal face of the sample, and the additional compaction passes perpendicular to the first three passes. This compaction procedure is repeated for each sample fabricated in the lab to ensure a consistent and effective compaction of the aggregate into the emulsion layer.
Following compaction, the newly fabricated sample is then cured in the oven undisturbed at 35C for 24 hours to allow the sample to cure. After the curing period is complete, the sample fabrication is complete, and the sample is ready to be tested.
4.1.1.1 Complete Temperature Control during Chip Seal Specimen Fabrication
In order to eliminate temperature as a variable in fabricating and testing chip seal specimens in the lab, it is important to be able to control the temperature throughout the entire specimen fabrication process. Such control is vital because it ensures that each sample is subjected to the same temperature during the fabrication. Pivotal to achieving this level of temperature control is a closed facility that can host the fabrication process. A facility has been constructed for sample fabrication that is a 16 ft. by 8 ft. greenhouse made of wood and polycarbonate glass. This greenhouse, pictured in Figure 4.4, ensures a consistent
Figure 4.4. Greenhouse for temperature control during specimen fabrication.
A few modifications were made to the greenhouse to increase its efficiency in maintaining a consistent fabrication temperature. One major adjustment is the addition of a heating solution in order to heat and maintain the temperature in the greenhouse. Also,
Additionally, an oven is used to ensure that the 24-hour curing temperature of 35°C for newly created samples is consistent. Further, a temperature chamber and thermocouple ensure that the MMLS3 machine retains a constant temperature during the testing of chip seal specimens. The emulsion is stored in a large oven at 140°F until it is needed for sample fabrication.
4.1.2 Mixture Performance Test Methods
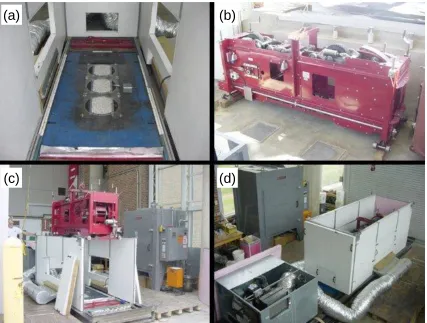
4.1.2.1 Third-Scale Model Mobile Loading Simulator (MMLS3)
Figure 4.5. MMLS3 test preparation: (a) installation of specimens on steel base, (b) side view of MMLS3, (c) positioning the MMLS3 in the temperature chamber, and (d) complete
MMLS3 test setup.
For MMLS3 testing, specimens are fabricated through a procedure that closely
simulates the surface treatment fabrication in the field. This procedure is described in Section 4.1.1. The test method allows for complete temperature control between approximately 10°C and 60°C using an environmental chamber and cooling/heating unit.
A straightforward methodology has been developed for running the MMLS3 test. Specimens are first secured underneath the MMLS3 machine using screws or clamps to fix the specimens to the base, and then the test temperature is set on the heating unit control box. After allowing adequate time for the temperature to reach its target, green and red buttons on the control box are pressed to start and stop the machine, respectively. Wandering is utilized for aggregate loss testing, but tests such as rutting do not use this feature.
(b)
(a)
Loading is checked regularly using a load cell that can measure the load magnitude applied by each wheel as it passes over the test samples. In addition, the tire pressure is fixed at 105 psi in order to ensure consistent loading from tire to tire. Adjustments to the springs on the wheeled buggies allow for fine tuning the applied load. The height of the machine is carefully adjusted so that the buggies apply a load that is expected during actual trafficking. Bolted mounting steel plates ensure that samples can be mounted for testing in a repeatable manner.
MMLS3 for Raveling Evaluation