
STUDY OF FILTRATION DILUTED CRUDE PALM OIL SLURRY USING L A B S C A LE PRESSURE FILTER
By
SA'ARI MUSTAPHA AND HAMDANI SAIDI ( Dr. ) Abstract
A labscale pressure filter has been developed to. study the nitration behaviour of diluted crude palm oil slurry. The apparatus mainly consists of two pads viz. a mixer and a filter which are placed in a oven for controlling operating temperature. The system is connected to a data aauisation system for recording data of applied pressure, medium pressure, filter temperature, weight of filtrate and mixer speed in a spread sheet. Filtration of DCPOS was carried out at a temperaure range 6 CPC - 5 CPC and applied pressure 1 bar ■ 4 bar using a polyester mu Hi filament woven cloth as filter medium. The results have shown that the filter system was fully capable and suitable to be used to study filtration behaviour of DCPOS. The optimum process condition to give the highest filtration rate was at 2 bar and 90°C. The effect of pressure and temperature to the filtrate flowrate and cake compressibility were also discussed.
In t r o d u c tio n
Diluted crude palm oil slurry ( DCPOS ) is a slurry which is produced from the dilution of crude palm oil slurry ( or undiluted crude palm slurry) in the conventional clarification process.
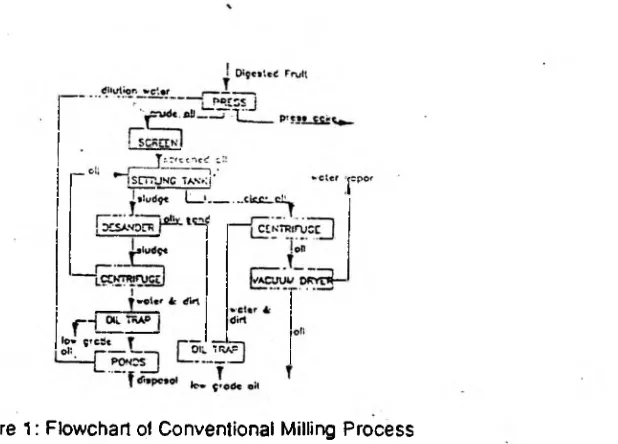
Figure 1 shows the the flowchart of production of crude palm oil by conventional milling process.
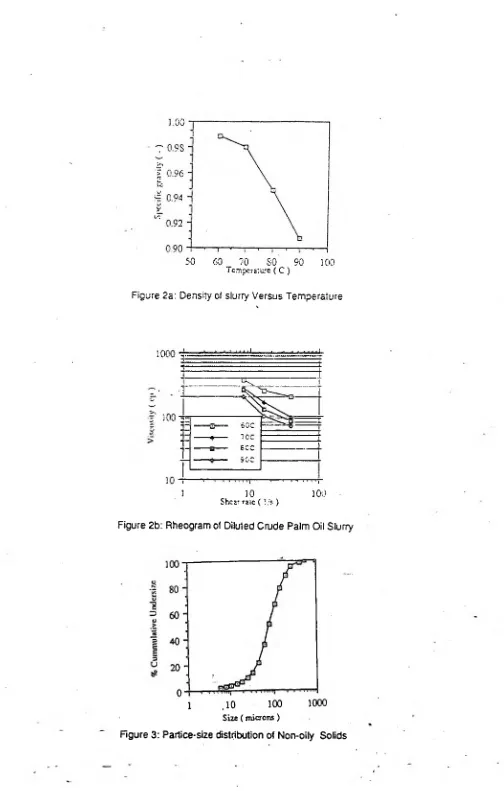
Dilution is initially c a r r i e d ^ to reduce the slurry viscosity to ease separation of oil from its mixture in the clarifier. The main composition of slurry is water, oil and non-oily solids. Water soluble material were also found in the slurry which is consist of carbohydrate, protein, tocopherol, etc1- The composition of non-oily solid ( DCPOS-)is not constant due to the diffrent quality of the palm fruits, uneven flow of undiluted crude palm oil slurry ( due batch oil extraction method ) and open-loop control ol hot water for dilution.. The typical composition of of diluted crude palm oil slurry is 21% - 25% oil, 66% - 72% water and 6 - 7% non-oily solids2. The typical density of the slurry is shown in Figure 2a where it is inversersely proportional to temperature. The DCPOS behaves as non-Newtonian fluid i.e. Bingham plastic type fluids and its viscosity deacreases with increasing temperature ( Figure 2b ). Non-oily solids consist of cell debris, fibres, calyx leaf and dirts as depicted in Photograph 1. The partiele-size distribution of NOS particles is presented in Figure 3. The shape of non-oily solids were described quantitatively in term of factors of elongantion( L/B ), area ( A/(LxB)) and sphericity ( P2/4A ) is given in Table 1. The true density of NOS particles in the range 0.92 - 1.34 g/cm3- A typical particle-size distribution of the is presented in Figure 3.
50 60 70 SO 90 100 l crnpcraturc ( C )
Figure 2a: Density of slurry Versus Temperature
1 ' ■ -... . ... >
i--- --- f
I 1
I i
i
*- 1 -- ---- L
T“ .... ... X1
T
i • * ’ • 1 • ■ i
1 ]0 100
Shear Tztc ( : /s )
Figure 2b: Rheogram of Diluled Crude Palm Oil Slurry
Size ( microns )
Photograph 1: Non-oily Solids Particles
Table-!: Shape Factors ot Non-Oily Solids
T y p e K-.-r.ber Z l c rc a z i cr. hr ea
cf Fcctcr F c c t cr
Psr'ci \
cl e
Ce ll 1 7 : . 0 - 2 . i w 1
-Det ri 1 . Z
s
F iber 2 4 . C - 4 . 3 Z.2
Zai yx 1 :. 4 C . ■'
The conventional milling process has been used lor twenty years. It involves sterilisation, thresing, digestion, pressing, and claritication. The heart ot claritication system is clarifier where the oil is continuously separated by sedementation. The perfomance of the clarifier depends on the slurry concentration, temperature, and cross-sectional area of clarifier. This method is inefficient when dealing with a larger volume of the slurry ( usually occurs during peak harvesting season ) and high concentration of slurry. The optimum efficiency obtained by diluting the undiluted crude palm oil slurry ( UCPOS )-to 30% dilution, maintaining settling time lo for 4 - 5 hours duration and operating temperature above 90°C 3. Clarification trials using decanter were reported by several reseachers 4-5'6- The system would be profitable if oil loss is reduced through good mill operation and process
condition7-Filtration of crude palm oil slurry has been considered long time ago5-. But trials using rotary vacuum filter were not succeful due to the fast clogging of filter cloth. The cake resistance of filtration undiluted crude palm oil slurry ( calculated by assuming that only oil in the filtrate ) in between 0.4 - 21.6 x 10¹¹ rrVkg for the pressure range 2.9 - 3.5 bar and temperature range 60°C - 8 0 °C 9. The value indicates that the slurry can be filtered since these values are in the range moderate separation ( Table 2 ).
The method has two advantages ( i ) reducing pollution problem by reuse of water since it contains very small quantity of suspended solids, ( r ^ tnereasing clarifier efficiency by integrating the filter with clarifier where the function of filter is to reduce the solids content in the slurry. However the viability of the technique would depend on filtrate flowrate and oil loss.
Tabie 2: Clasificaiion of Separation by Filtration111
E c s e c f a ST./*<3 ) Sswsc r e t i e .
Vfcry e*£ y'
^ U s y 1 c
yCCC I e t c 1C**
: ; f r ; c w : i * ~
V e r y j
Cake and M edium R e s is ta n c e E quations
Filtration of DCPOS involves two-phase flow of filtrate i.e .water and oil. Calculation of cake and medium resistance by conventional filtration equation require measurement of density and viscosity of filtrate. In-situ measurement of viscosity and density of two-phase of liquids flowing through a compressible cake and filter medium is cumbersome. Furthermore no reliable method has been developed for this purpose. Therefore calculation of cake and medium resistance of filtration of DCPOS was carried based on the following assumption:
The oil phase is dispersed while water remains as eontinuos phase. i. The system temperature is constant.
ii. The pressure accross the cake is constant.
v. The applied pressure is much larger than capillary pressure. Therefore it is assumed that no separation occurs due to capillary pressure,
v. The oil phase coaieescence occurs at the outflow of the filter medium.
Hence, the property of filtrate which consists of oil and water flowing through the cake and medium can be averaged as follow:
i) Density of filtrate
row = x r w + (l-x)r0 (
1
)ii) Viscosity of filtrate
mow = x n v + (1*x ) Mo ( 2 ) _
Modification of c* ( weight of the dry solids deposited on the cake when a unit volume of filtrate obtained) proposed by Gale 11 is.
c*ow = ws (1 - Wjj/WcVik>w (3 )
From here, the equation of cake and medium resistances of diluted crude palm oil can be developed by modification conventional filtration equation and result of plot time/volume ( t/v )
versus volume ( v ). <• '
i) cake resistance,
slopex 2 x A x P )
Mow x c‘ ow ii) medium resistance
a •« _____ ____ ___ —— (4)
ow v '
alternatively R0w also could be quatiti fied by measuring pressure at the top of filler medium and calculated using the following equation:
n = P / u q ( 6 )
ow m ow
The imperical equation of relationship of ooW and P is given by,
a = a (P)n (7 )
ow o ,o w ' '
The value of n can be obtained by plotting log aow versus log P and slope of the graph is equai 1o n.
A p p a ra tu s
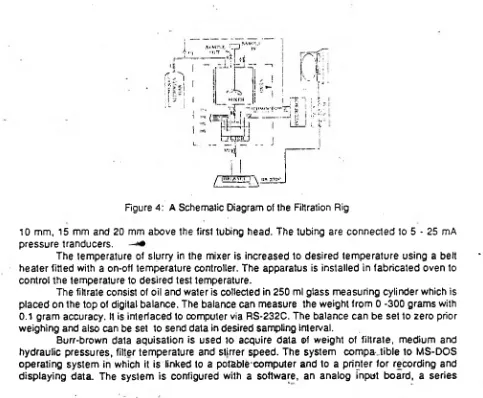
Figure 4 shows the schematic diagram filtration rig to study the filtration o t DCPOS at constant pressure and temperature. It mainly consists of a mixer and a filter which is placed in the
oven.
Mixer has 15 cm ID, 20.5 cm height and made from stainless steel. It is accomodated with a stirrer, a sample inlet facility, a thermocouple, a sampling facility and an inlet of compressed nitrogen cas. A
1
/2
" globe valve is fitted between the mixer and the filter.Filter has cylinderical shape 10 cm ID and 4 cm height and also made from stainless steel. Five 1/4* n p t holes at the top of filter are used to to equip five i/s - pressure tubing to measure medium and cake hydraulic pressures. The head of the first tubing touches the surface of filler cloth, the second, the third, fourth and fifth heads tubing are positioned at 5 mm,
1 H5 71*7*'
Figure 4: A Schematic Diagram of the Filtration Rig
10 mm, 15 mm and 20 mm above the first tubing head. The tubing are connected to 5 - 25 mA pressure tranducers. —
The temperature of slurry in the mixer is increased to desired temperature using a belt heater fitted with a on-off temperature controller. The apparatus is installed in fabricated oven to control the temperature to desired test temperature.
The filtrate consist of oil and water is collected in 250 ml glass measuring cylinder which is placed on the top of digital balance. The balance can measure the weight from 0 -300 grams with 0.1 gram accuracy. It is interfaced to computer via RS-232C. The balance can be set to zero prior weighing and also can be set to send data in desired sampling interval.
termination panel and anumber of analog signal cables. Number of channel lor this study are 10 i.e. & analog ( 6 pressure channels and 1 time channel), 1 parse and 1 time. The maximum period of data aquisation is 3600 seconds lor 60 seconds sampling rate between the sampling data. The data is displayed in numeric form on computer monitor for easiness m onitoring of filtration process.
M a te ria l and M ethod i) M a te ria l
The slurry was filtered using polyester multifilament twill weaves with air permeability of 20 3 2
cm /cm /sec.
The samples of DCPOS were provided by a palm oil mill. The samples were taken from a sampling point which is located just below vibrating screen.
ii) M e t h o d
Initially the filtration rig in the oven was heated.up to desired temperature lo r 4 hours. Then the temperature, was kept constant by oven's temperature controller The sample of diluted crude palm oil slurry was .heated at 60°C and then homogenised for 1 minute, by stirring. A 600 ml of homogenised slurry was placed into the mixer of filtration rig. The slurry was continuosly hom ogenised by stirring at 1200 rpm. If the slurry's tem perature below the desired test temperature then it is heated up using belt heater which is fitted with temperature controller. At the begining, all the pressure reading ( P1, P2, P3, P4, P5 and P5 ) were set 1o zero. Then the pressure valve was opened slowly until P1 ( displayed on the monitor ) had reached to the desired pressure. A 50 ml sample was taken through the sam pling facility to check its composition.
The valve V1 ( refer to Figure 4 ) and the data aquisation system was slowly opened lo start filtration and the data aquisation was activated simultenously. Filtration tests were carried out at temperatures of 60°C, 70°C, 80°C and S0°C and pressures of 1 bar, 2 bar, 3 bar and 4 bar. The volumetric ratio of oil and water of filtrate was recorded manually every 5 minutes for the first 1 hour, 15 minutes after 1 hour to 3 hours, 20 minufes after 3 hour to 4 hours and 30 minutes after 4 hours of filtration. The wet cake and dry cakes were weighted and the oil conlent in the cake was determined using soxhlet apparatus.
R e s u lt and D is c u s s io n i) S lu rry P re p a ra tio n
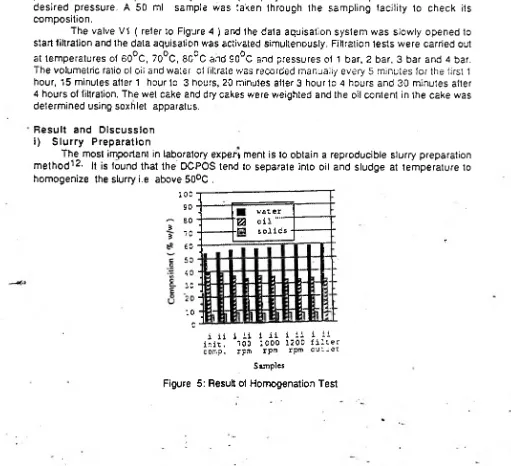
The most important in laboratory expert ment is to obtain a reproducible slurry preparation m e tho d 12- It is found that the DCPOS tend to separate into oil and sludge at tem perature lo homogenize the slurry i.e above 50°C .
100 so — 80
5 ? -o
eo C '
| 30
;o c
i ii i ii 1 ii i ii i ii ir.it. 700 1 0 0 0 1200 filter cor.?, rpm r p ™ rp m outlet
Samples
v£ te r ea o n ■m s o li d s
A homogenaticntest was carried out at 60°C to find appropriate speed ot filter, stirrer
10
obtain a reproducible composition ol the slurry. The test was divided inlo two stages, where the composition ol slurry was determined immediately after homogenation, and in the second stage the slurry composition ( in duplicate ) was determined after it was homogenised 1or period 30 minutes in the filter mixer at rolation speed 700 rpm, 1000 rpm and 1200 rpm. Typical result of the homogenation test is presented in Figure 5. It shows that stirring at rolation speed of 1200 rpm gives a consistent slurry composition. Thus, for all sample preparation, the slurry was continuosly homogenation in the filler mixer by stirring the slurry at 1200 rpm.ii) E ffe c t o f P ressure to F iltra tio n Rate
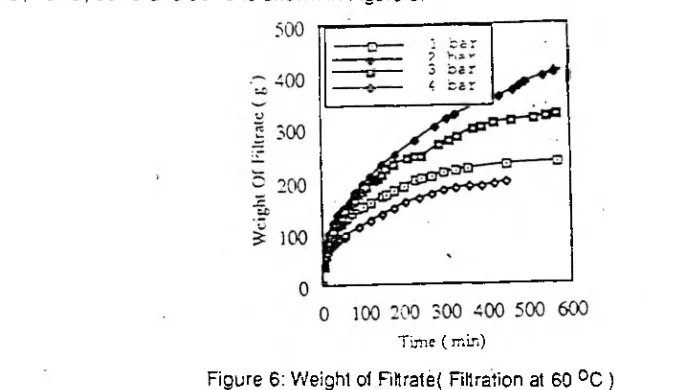
Typical eftect of pressure to the filtration rate of filtration DCPOS at operating temperature 60°C, 70°C , 80°C and 90°C is shown in Figure 6.
Time ( rr.ir.)
Figure 6: Weight of Fittrate( Filtration at 60 °C )
For each operating temperature the highest tlowrate is obtained at applied pressure 2 bar followed by pressures 3 bar,
1
bar and 4 bar. The results reflected that the cake is inelastic where the filtrate llowrale was increased10
maximum at 2 bar and then deacresed as pressure was increased. The reduction of the filtrate at temperature above 2 bar was probably due to the change of internal cake structure .Time ( min )
Figure 7: A Typical Example of Effect of Temperature on nitration Rale Hi) Effect of Tem perature to Filtration Rate
Figure 7 shows a typical effect of lemperature on the filtration rate. Increasing tem perature has increased the filtration rate significantly by reducing the viscosity ( liquid
iv ) Q u a n tity W ater and Oil in F iltrate
Figure 8 presents the typical quantity of water and oil in filtrate. The volume of water phase reaches maximum at early filtration ( up to 40 minutes ) and then reduces steadily until the end of filtration. The increment ol volume of oil is quite steadily from beginning to the end of filtration.
:-iO •
>*>■! ^
' f
), ,) J P.l:ry Cur. . '.. *. - ) ! Z? ~1'e Wjtct. 22*5 <>i!. N( ;<
«> I'O 2>v 300 5r-:• Thru. ( mi:i )
Figure 8: Volume of Water nad Oil Versus Time ( Filtration at 1 bar 60°C)
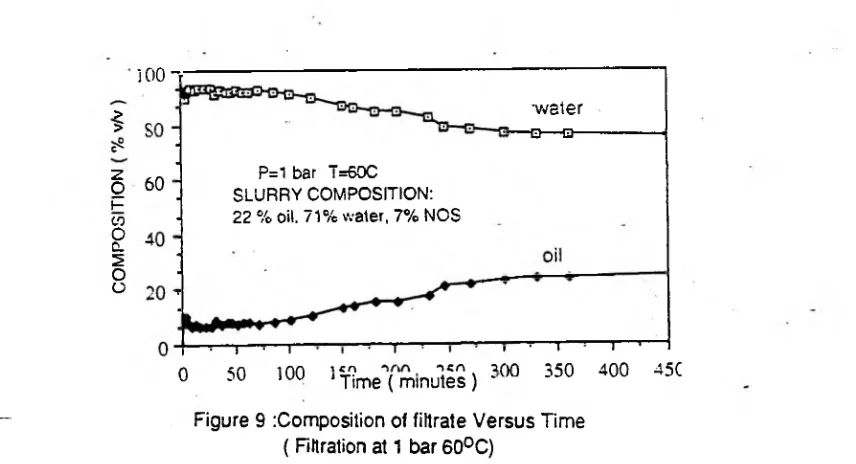
The changes of composition of filtrate ( % per total volume ) of water
2
nd oil with time is given in Figure 9. The water content is at maximum at early filtration and reduces linearly until the end of filtration whilst the changes oilcontent is reversed i.e. minimum at beginning of filtration and increased ■ until the end of filtration.i0 0 -r > > z O H 00 O Cl 2 O o •water
- O ---0 —
60 P=1 bar T=60C
SLURRY COMPOSITION: 22 % oil. 71% water, 7% NOS
0 ~ r
-50 —i—
100
T
-icr\ ->cn -iQO Time ( minutes ) *
I
350
— i— ir-400 45C
— Figure 9 :Composition of filtrate Versus Time ( Filtration at 1 bar 60°C)
It means that no separation occurs from beginning to the end of filtration. The curves of water and oil in the graph illustrate . the flowrate of continues and dispersed phases through the cake and medium. The flowrate of oil ( dispersed phase ) slower than water ( continuos phase ) because the dispersed phase needs to coalease to a certain size before it can flow out13.
v) Cake Hydraulic Pressures
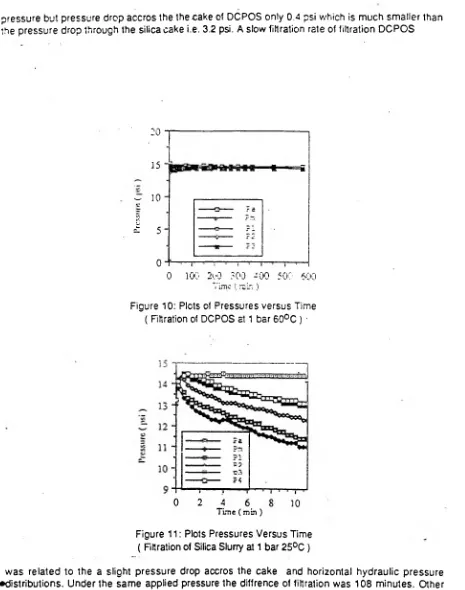
pressure but pressure drop accros the the cake of DCPOS only 0.4 psi which is much smaller than the pressure drop through the silica cake i.e. 3.2 psi. A slow filtration rate of filtration DCPOS
:o
-j---15 « ".= g
r 30
Zr,
lA
& 5
0
0 100 2v0 ?00 -00 500 600
Figure 10: Plots of Pressures versus Time { nitration of DCPOS st 1 bar 6 0 ° C ) *
« ".= g
0 tQO 2tO ?00 -0 0 50C 6C
Tun e (min )
Figure 11: Plots Pressures Versus Time ( Filtration of Silica Slurry at 1 bar 2 5 °C )
was related to the a slight pressure drop accros the cake and horizontal hydraulic pressure -^•distributions. Under the same applied pressure the diffrence of filtration was 108 minutes. Other factors could affect the filtration rate of DCPOS are particle-size distribution and oil globules in the slurry. The NOS particles has wide range particle-size disribution ( as shown in Figure 3 ). The wide particle-size distribution to cause media blinding and migration of fine particles in Jhe pores. The oil globules were attributed a low fluid loss property and recognised as effective sealing property in the wail of bores holes 15- The small particle size might reduce the . porosity of the cake by migrating into the interstices16- Combination of these two factors of course
v i) C a lc u la tio n o f Cake R esistance
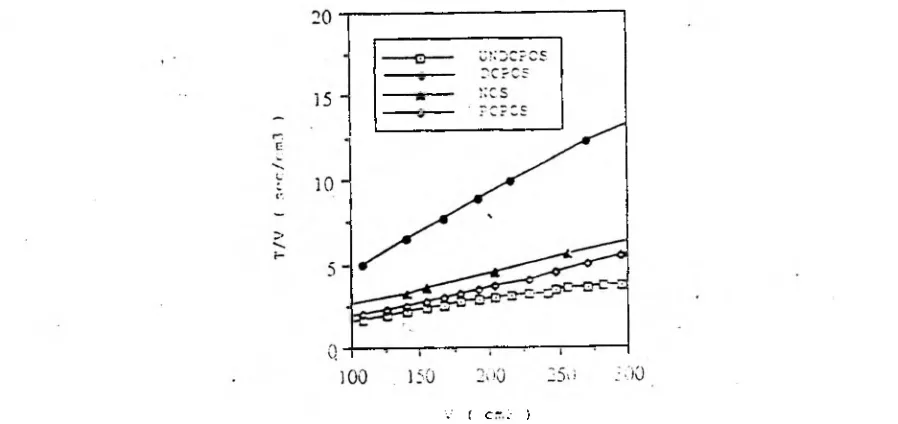
A set of filtrations which consist of filtration of non-oily solids slurry ( NOSS ), undiluled crude palm oil slurry ( UDPOS ), prepared crude palm oil slurry ( PCRPOS ) and diluted crude palm oil slurry ( DCPOS ) were carried out lo determine the s u ita b ly of the equations (1) and (2 ). to be used for quantifying the cake and medium resistances of DCPOS. A graph of t/v versus v of the filtration o f that slurries is presented in Figure 12. The slopes of the graph and the equations (1) to (2) were used to calculate the cake and medium resistances. The values of the resistances is presented in Table 1. The highest value oj the cake resistance is found for filtration of DCPOS, followed by NOSS, PCPOS and UDCPOS. The data indicative that the calculation of viscosity and density based on weigted average and equationa (1) and (2) can be used sufficiently to calculate medium and cake resistances. Modification of conventional filtration equation can be used lo quantify the cake resistance.
v ( c-> :•
Figure
12
: Pfot T/V Versus V For Diffrent Crude Palm Oil SlurriesThe slopes of the graph and the equations (1) to (2) were used to calculate the cake and medium resistances. The value of the resistances is presented in Table 2. The highest value of the cake
Table 3: Cake and Medium Resistances
S L U R R Y T U Ws (; x iZ -1 1 K m ' I - - 1 ’
( C > ( kc/m s ) ( - ) ( p V « * ). ( 1 '111 )
DCPOS 00 2596 0.06 101.0 126.0
NOS 9-56 0.07 fi7 J i - .7
PCPOS >*0 R734 0.07 - 4.2 i'i.-J
I DCPOS '«) 1 0.07 2.5 7.7
and (2) to calculate medium and cake resistances and modification ot conventional filtration equation can be used sufficiently to quantify the cake resistance.
• v i i ) M e d i u m R e s i s t a n c e
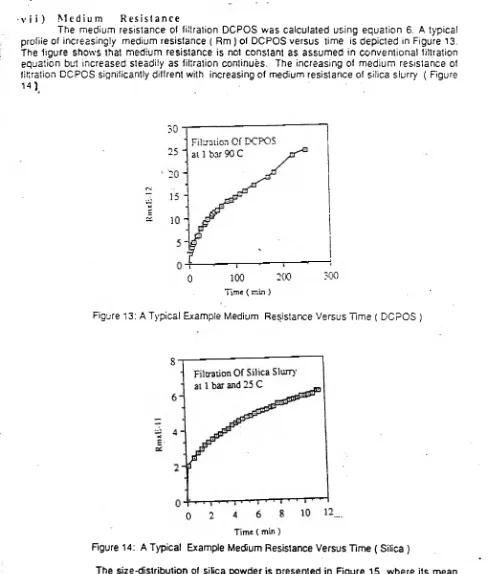
The medium resistance of filtration DCPOS was calculated using equation 6. A typical profile of increasingly medium resistance ( Rm ) of DCPOS versus lime is depicted in Figure 13. The ligure shows that medium resistance is not constant as assumed in conventional filiration equation but increased steadily as filtration continues. The increasing of medium resistance of filtration DCPOS significantly diffrent with increasing of medium resistance of silica slurry ( Figure .1 4 }
Time ( n in )
Figure 13: A Typical Example Medium Resistance Versus Time ( DCPOS )
Time ( min )
Figure 14: A Typical Example Medium Resistance Versus Time ( Silica )
Size { microns)
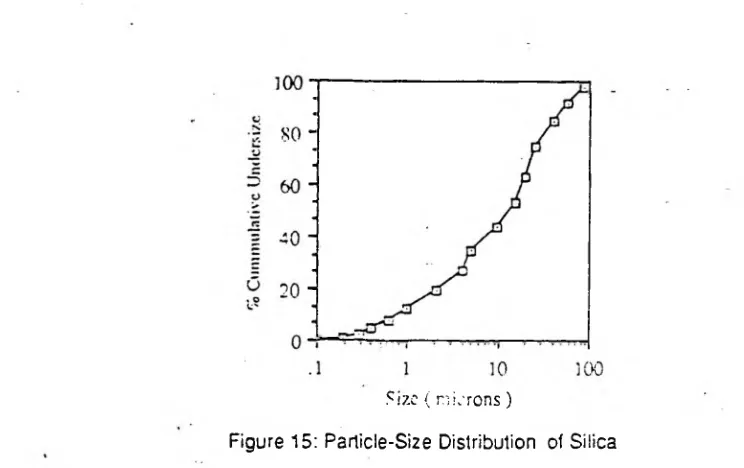
Figure 15: Particle-Size Distribution of Silica v iii) Effect of T e m p e ra tu re to The Cake Resistance
The cake resistance of filtration of DCPOS was calculated using of equation 4. Figure 16 shows the effect of temperature to the cake resistance. It deacreases linearly as lemperature increases except for filtration at 2 bar. The deacreasing of the cake resistance could be due to the deacreasing of viscosity ( low viscosity high filtration rate ) of liquid and increasing the size of pores in the cake..There are two mechanisms may be involved in increasing the pore size of the cake.. The first mechanism is due to the flowing out ol some water in the pores when its viscosity deacreses or when evaporation occured. The second mechanism is due to the. escaping of oil globules from the pores when their surface lension is reduced at high temperature. Reducing the oil globules surface tension would increase the coalesing between the globules and assit the movement of oil out of the pores. .Besides of these two factors, the porosity of the cake is also influenced by the size-distribution and dispersion of NOS particles.
Log P
Figure 16: Plot Log a Versus Log P
The increasing of cake resistance for the filtrations at 2 bar probably due to the migration of the fine particles into the pores or increasing dispersion of solid particles during the slurry prepartion. ix) Cake C om pressibility
using equation 7. The values ol n at dittrent temperatures are given in Table 4.The cake is very ccmpresibie
T ( C )
Figure 17: Plot a Versus Temperature
so : . c ?
£0
To
Table 4: Cake Compressibility
at 60°C ( rr > 1 ) and becoming less compressible as temperature increases. Deacreasing ot n possibly due to deacreasing of the amount of soluble material in water, oil globules and water in the pores as temperature is increased.
x ) C ake ‘C o m p o s itio n
slurry have higher water content than inorganic cakes. The high water content in the former cakes could be-due lo the wide range particle-size distribution.
Table 5a: Composition of DCPOS and Cake at B0Cand90C (labscale tests)
i
---P C s k e C o m p o s i t i o n Sl'orrv C c ~ c c E i t i c r , (C> ( b a r } rtctrl C i r S c l i c s W a t e r O i l S c l i c s c 0 i 6 9 . 9 : 9 . 2 1 3 . 0 6 S . 5 2 5 . S 5 . 7 80 2 6 9 : 4 2 1 . 4 9.2 7 0 . 7 2 3 . 3 6 . 0 80 3 €7.6 2 2 . 4 1 0 . 0 6 7 , 2 2 5 . 9 6 . 9 eo / 6 7 . 2 2 3 . 1 9.1 6 5 . 5 2 8 . 3 6.2
sc 1 7 0. e 1 9 . 0 10.4- 7 1 . 7 2 2 . 6 5 . 7 90 2 7 0 . 1 1 7 . 3 1 2 . 6 7 2.1 2 1 . 6 6 . 3 C 0 3 6 5 . 6 2 1 . 3 13 .1 7 1 . 3 2 1 . 6 7 . 1
'4 7 1 . 2 1 7 . 2 1 1 . 6 6 9 . 7 2 3 . 5 6 . 9
: able 5b: Composition of DCPOS and Cake ( pilot sea's trials 1 T = C a k e C or . oos i tic r S l u r r y Ccr-.ccsiticr. (C) (bar ’•v.'ster O i l S o l i d s W a t e r Cil S c l i c s
eo 1 . 7 6 6 . 1 2 4 . 8 9 . 1 6 8 . 4 2 6 . 6 5 . 0
90 3 . 4 7 3 . C 1 7 . 8 S-.2 6 4 . 8 3 0 . 0 5 . 2 C f; cV ♦ — 7 C . 1 2 C . 6 9 . 3 6 9 . 8 2 5 . 2 4 . 9
W
§. £
o
u 100 1
eo
60
40
20
‘S.waip.r %oil '
fe.I l l
D C P PC! U D C P N O S I L C D P R T A L C
DC? ?C; U D C ? KC SI L CL'rS TALC
Figure 19 : Composition of Cakes of Diflrent Slurries C o n c l u s i o n
At first it is essential to determine that filtration rig and method which capable and suitable to be used for filtration of DCPOS. From a series of filtration test, it was found that the rig and method employed can produce a reproducible slurry composition. The rig capable 1o filter the DCPOS af temperature range 60°C - 90°C and pressure range 1 bar - 4 bar (1 4 .5 psi - 87 psi.).
v o
The optimum filtration rate of DCPOS was found at 2 bar and 90 C. The llowrate of water phase faster than the flowrate of oil phase because the composition of water in the DCPOS slurry more than oil. The DCPOS is the most difficult to filter slurry followed by NOSS, PCPOS and UDCPOS. The pressure drop through the cake of ’DCPOS is too small and distribution of hydraulic pressures in the-cake is almost independent of time. The modification of conventional filtration equation based on weighted average can be used for calculation of the cake resistance and might be extent to quantify the medium resistance. The cake resistance deacreses as.temperature increases. The cake is highly compressible at 60°C ( n>i ) and becoming less compressible as temperature increase. The medium resistance of filtration DCPOS is not constant ( i.e. oppose to conventional filtration equation ) but increases in form of parabolic curve.The cake composition which obtained by filtration rig ( labscale ) is similar to the cake produced from pilot scale filter press. Pressure and temperature were unsignificantly effected to the cake composition. The cake of palm slurries are hydrofobic than the cakes of silica, cupric oxide and talc.. This is correspond to the property of NOS particle i.e. has a wide particle-size distribution and diflrent shapes.
A c k n o w l e d g e m e n t
We would like to thank Golden Hope Limited for providing slurry sample and Nakao Filter for donation filter cloth.
N o m e n c l a t u r e -A = filtration area ( rr>2)
c‘ ow = dry suspended solids/ unit volume of filtrate( kg/m3 ) n = compressibility ( - )
P « applied pressure ( Pa )
?2
* medium pressure ( Pa ) q = superficial velocity ( m / s ) Rm = medium resistance ( 1 /m ) x = fraction of water in filtrate p0 = densisty of oil ( kg'm3 ) pw - density of water ( kg/m3) Mo = viscosity of oil ( kg'ms ) Mw = viscosity of water ( kg/m s)Mow * weighted average of viscosity ( kg/ms) •
R e f e r e n c e s
1. Ho C.C. and Tan Y.K., Water Research. L 613,1983. 2. S a'ari M., Progress Report to UPP, UTM.
3. Hoe L.K.,Proc. of Reg. Workshop on Palm Oil Mill Technology and Effluent Treatment, 61, 1982.
4. Roege W., Velyuthan, A. and Chan K. L , Palm Oil Technology and Eftluent Treatment, 85, 1982.
5. Sulong M., Enhancing Crude Palm Oif Recoverey by Three Phase Decanter System: Theoritica! Consideration and Field Evaiution, Partec'88,1388.
6. Urn N.B. H., Porim Engineering News, 30,1388.
7. Southworth A.," A Review of the Use of Decanters in The Palm Oil Extraction Process” , A National Workshop on Recent Development in Palm Milling Technology and Pollution Control, PORIM, 1988.
8. Mongana Report Vol 1: Research on Production and Storage of Palm Oil. Kuala Lumpur: Malaysia.Oil Palm Growers Council, 1S52-1955.
9. Tang L .C .," Filtration of Crude Palm Oil” , BSc Thesis, National University of Malaysia, 1987. 10. Leu W. F .," Cake Filtration ".PhD Diss., University of Houston, 1981.
11. Gale R. S., Water Poluttion Conrol, 622,1967.
12. Machej J.; International Chemical Engineering, Vol. 14, No.1 ,2 7 ,19 7 4. 13. Dahliquit E., SteterwaJI F.,.Filtech Conference 1987, University of Technology
Loughborough, Vol.1, 36, 1987.
14. Shirato M., Sambuichi M., Murase T., Aragaki T., Kobayashi and Iritani E .," Theoritica! and Experimental Studies in Cake Filtration", Memoirs of Fatuity of Engineering, Nagoya University, Vol. 37, No.1, 49,1.985.
15. Roger W. F., Composition and Properties of Oil Well Drilling Fluids, Gulf Publishing Company, 3td. Ed., 562, 1963. '
16. Notebaert F. F., Wilms D.A., Van Haute., A New Deduction With A larger Application of the Specific Resistance to Filtration of Sludges, Water Research, Vol. 9, Pergamon Press,
![Efficacy and safety of acupuncture for the treatment of non specific acute low back pain: a randomised controlled multicentre trial protocol [ISRCTN65814467]](data:image/gif;base64,R0lGODlhAQABAIAAAP///wAAACH5BAEAAAAALAAAAAABAAEAAAICRAEAOw==)