EFFECTS OF TIME-DEPENDENT PARAMETERS ON THE
PERFORMANCE OF A CONCRETE CONTAINMENT STRUCTURE
Xu Huang1, Oh-Sung Kwon2, Evan Bentz3and Julia Tcherner4
1
Ph.D. Candidate, Department of Civil Engineering at University of Toronto, CANADA 2
Assistant Professor, Department of Civil Engineering at University of Toronto, CANADA
3Associate Professor, Department of Civil Engineering at University of Toronto, CANADA
4
Senior Civil Engineer, Candu Energy Inc, CANADA
ABSTRACT
In extending a design life of nuclear facilities, a thorough review of a long term performance is required as time-dependent parameters such as concrete shrinkage and creep as well as relaxation of prestressing tendons will influence an overall performance of a prestressed concrete containment structure. In this
paper, long-term performance of a CANDU®1containment structure was investigated. The
three-dimensional nonlinear finite element model was built using VecTor4 to realistically evaluate the performance of the structure and predict crack width and spacing, under service loads and under hypothetical beyond-design basis loads. Consideration was given to the time-dependent effects of concrete shrinkage, creep, and relaxation of prestressing tendons over a 60 year timeframe. In addition, the sensitivity of the containment structure response to the modelled support condition and the internal temperature profile was investigated. The analysis results showed that the containment structure develops ductile mechanism when the internal pressure increases up to the failure. The apparent internal pressure that leads to this mechanism is approximately three times of the design pressure. The pressure-deformation relationship of the structure is sensitively affected by the considered time-dependent parameters. The paper discusses influence of various time dependant parameters on the performance of the post-tensioned concrete containment structure.
INTRODUCTION
Nuclear power plants supply more than 50% of the total electricity generated in Ontario and 15% of the electricity generated in Canada (World Nuclear Association, 2014). Together with hydro, they represent a key component of Canada’s low-carbon electricity production infrastructure. The CANDU power plants that were designed in 1970s have a design life of 30 years. Once this design life is reached, the nuclear power plants can be refurbished to extend their life. The performance requirements for the nuclear power plant containment structure (containment structure, hereafter) are more rigorous than those for a conventional building or bridge structures. The effects of time-dependent parameters such as concrete shrinkage, creep, and relaxation of prestressing tendons could significantly influence the overall performance of the structure.
Involving both chemical and physical processes, shrinkage and creep are not only affected by material components but are also significantly influenced by loading condition and environmental variables such as temperature and humidity. In addition, the strain due to creep is dependent on the applied long-term stress. Due to the complex mechanism of shrinkage and creep of concrete, researchers relied on physical tests to understand the long-term behaviour of concrete. However, constrained by the limited size of testing apparatuses (such as drying rooms to mimic the actual environment that the full-scale structure is
1
exposed to) and the difficulty in obtaining reliable creep and shrinkage experimental data for the particular concrete, experimental data must be replaced by numerical models for large scale reinforced concrete structures, especially for nuclear power plants many of which are more than 25 years old.
Although there is no universally accepted theory to explain the mechanism of shrinkage and creep of concrete, the following parameters have been proven to be critical for the prediction of shrinkage and creep of concrete (ACI Committee 209, 2008):
Concrete composition;
Ambient relative humidity;
Temperature;
Age at loading;
Duration of drying;
Duration of loading, and
Specimen size.
Based on a number of experimental tests with the consideration of these parameters, many prediction models have been proposed, e.g. ACI 209 (ACI Committee 209, 1992), The B3 model (Bazant and Kim 1995, 2000), CEB/FIP 90 model (CEB/FIP, 1990), and GL2000 model (Gardner & Lockman, 2001). The applicability of these models in predicting long-term behaviour of reactor containment structures were also evaluated in Lundqvist and Nilsson (2011) and Song et al. (2002).
The objective of this study was to investigate the long-term performance of a typical CANDU containment structure. Time-dependent effects of shrinkage, creep, and relaxation of prestressing tendons over a 60 year time frame were numerically investigated. In addition, factors such as ambient temperature and boundary condition were also taken into account.
CONFIGURATION OF THE CONTAINMENT STRUCTURE
The containment structure is designed to withstand the loading from postulated events. It provides protection to the nuclear reactor and systems housed inside. It is the final physical barrier to radioactive materials.
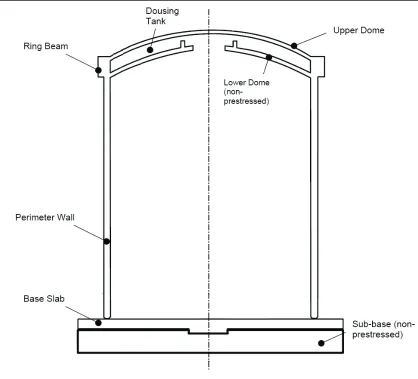
The containment structure consists of a base slab, perimeter wall ring beam and upper dome as shown in Figure 1. These are all post-tensioned structural elements.
NUMERICAL MODEL
Figure 1. Containment structure
Modelling Assumptions
The perimeter wall has a generally uniform section but there are several openings, embedment, and irregular layout of reinforcing bars which also influenced the layout of prestressing tendons. Precisely modelling these irregularities not only takes significant modelling time but also does not necessarily lead to more accurate results considering the uncertainties in the material properties. Thus, a few simplifying assumptions were made as listed below.
1. The perimeter wall is prismatic; i.e. the irregular layout of reinforcement due to permanent or temporary openings or embedded parts is ignored.
2. Reinforcing bars are continuous; i.e. lap splices are long enough to develop full strength of the reinforcing bars and provide no significant change in stiffness at the location of the laps.
3. The vertical and horizontal tendons in the perimeter wall are uniformly distributed.
4. Two cases of the numerical boundary condition of the perimeter wall to the foundation are considered: pinned and fixed.
5. The tendon layers in the upper dome are decomposed into two components: one in the circumferential direction and the other one in the radial direction.
the geometry as shown in Figure 2. This assumption is necessary to avoid numerical errors at the connection.
7. Considering the large density of reinforcement in the ring beam, all in-plane reinforcing bars are smeared and represented with a total of 6 material type reinforcement layers. An additional 4 layers of reinforcement components are used to model the effect of prestressing tendons.
8. The vertical buttresses are not included in the numerical model.
9. The containment structure is represented by a quarter model in VecTor4. Due to geometric
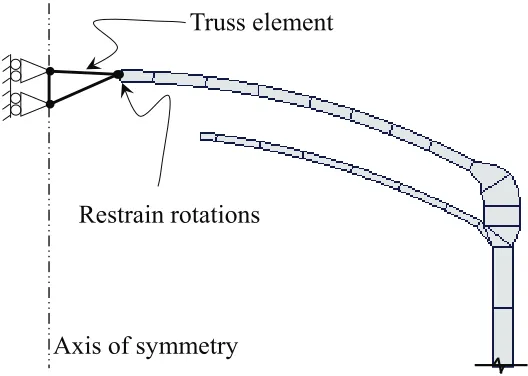
limitations of the program, a hole is left at the top of the dome. The effect of the hole is negligible when the diameter of the hole is sufficiently small compared to the diameter of the dome. For the axi-symmetric containment structure, the apex of the dome does not rotate nor move in a horizontal direction under symmetric load. To model this behaviour, rotational degree of freedoms at the top nodes of the upper dome elements are restrained. In addition, these top nodes are connected to the apex of the containment structure using truss element as show in Figure 2. Material properties of the truss elements are defined to obtain a stiffness equivalent to the stiffness of the embedded reinforcing bars and tendons.
Figure 2. Boundary condition at the top of the upper dome (not to scale)
Shrinkage and Creep
The development of shrinkage and creep of concrete is highly affected by temperature and humidity. The CEB/FIP 90 model was used and several assumptions were made for modelling of shrinkage and creep:
Yearly average temperature and relative humidity were used in the CEB/FIP 90 model. The external
yearly average temperature and relative humidity used were 6.3 °C and 70%, respectively. It was conservatively assumed that the internal temperature varies from 40 °C to 60 °C. Both uniform and linearly varying temperature distributions were considered. Even though the actual internal humidity is lower, the internal relative humidity was assumed to be 40% which is the applicability limit of the CEB/FIP 90 model.
Strain changes due to concrete creep and shrinkage are modeled by applying equivalent temperature
loads to the internal and external surfaces of the containment. Thermal strains due to the equivalent temperature loads will be equal to the creep-induced strain changes obtained from the CEB/FIP 90 model code. Different temperature loads were applied to the internal and external surfaces to consider
Axis of symmetry
Truss element
the differences in the yearly average temperature and humidity at both sides. Then, differential shrinkage and creep gradients throughout the cross section were obtained based on the temperature profile defined in VecTor4 using one-dimensional heat flow principals.
Concrete stresses used for the creep calculations were obtained from an initial static analysis where
the containment was subjected to dead load and initial prestressing forces. Then, the effect of the remaining prestressing force was also considered. Because the elements at the bottom of the perimeter wall and at the top of the wall are subjected to different compressive strains, different strains due to creep were modelled for each element.
For the purpose of creep induced strain calculation, it is assumed that the initial concrete stresses
remain constant at different concrete ages, disregarding the small changes in concrete stress due to the long-term effects.
Relaxation of Tendons
Relaxation of prestressing steel refers to the loss of tensile stress over time in tendons that are held at a constant strain. The following cases are considered for relaxation of prestressing steel:
! In the first case, it is assumed that the stress in the tendons is 62% of ultimate strength. It is also
assumed that the relaxation occurs in a relatively short time such that the stress is maintained from years 10 to 60. This case may be considered as an upper bound.
! In the second case, it is assumed that the tendons are only prestressed up to 54~57% of the ultimate
stress.
! In addition, it is assumed that the tendons lose stresses over time due to relaxation following DIN
1045-1 (DIN 1045-1:2001-07, 2001), which results in approximately 52% of ultimate stress at the age of 60 years. This case is considered as conservative lower bound.
The loss of prestressing stress is modelled in VecTor4 by applying an equivalent strain change in the tendon material.
ANALYSIS CASES
A series of analyses were conducted to understand the influence of each modelling parameter on the long-term performance of the containment. As shown in Table 1 a total of five analysis cases were defined for the sensitivity analysis and most cases included analyses at the ages from 10 to 60 years with 10 year time intervals.
In the Base Case, only the loading combination of self-weight, internal pressure, prestressing force, water pressure and temperature load were applied.
Time-dependent parameters such as creep, shrinkage and relaxation were considered in Case 1. For Cases 1 through 4, it is assumed that the tendons were tensioned up to 70% of the ultimate stress and 8% of the ultimate stress is lost within 10 years due to relaxation. Thus in the model the strain difference between the strand and the concrete for the 10 to 60 year analyses would produce 62% of ultimate stress in the strands if creep and shrinkage were ignored.
The influence of internal temperature distribution was also considered by comparing Case 1 with Case 2 and Case 4 which considers the uniform internal temperature of 40°C and 60 °C, respectively.
The influence of the support condition is accounted for by comparing the pinned support condition in Case 1 with the fixed support condition in Case 3.
In all cases in the above, self-weight of the containment structure and weight of water between the upper and lower domes for the quarter model were included.
Table 1. Analysis cases
Case Time-dependent parameters Other modelling assumptions
C S R SUP PF TL(°C) Ages
Base - - - Pin 70% !Tbot = 33.7°
!Ttop = 53.7° 0
1 Y Y Y Pin 62% !Tbot = 33.7°
!Ttop = 53.7°
10~60
2 Y Y Y Pin 62% !Tbot = 33.7°
!"top = 33.7° 10~60
3 Y Y Y Fix 62% !Tbot = 33.7°
!"top = 33.7° 10~60
4 Y Y Y Pin 62% !Tbot = 53.7°
!"top = 53.7° 10~60
5 Y Y Y Pin 54~57 !Tbot = 33.7°
!"top = 33.7° 10~60
Note: C-Creep; S-Shrinkage; R-Relaxation; SUP-support condition, PF-Prestressing forces (ratio to ultimate stress); TL-Temperature difference between inner and exterior surfaces.
RESULTS
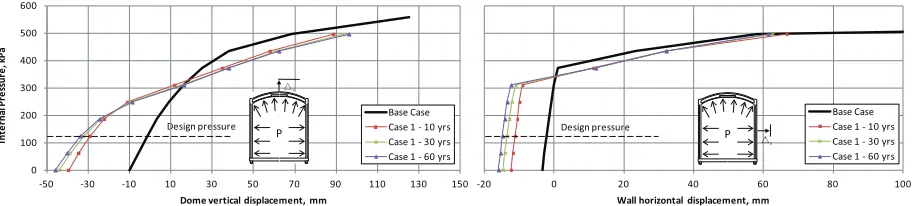
As an overview of the structural response, the vertical displacement of top of the upper dome and the horizontal displacement of the perimeter wall with respect to internal pressure are plotted in Figure 3 for the Base Case and Case 1 at the ages of 10 and 60 years.
Figure 3. Internal pressure – displacement relationship (Base Case, Case 1)
When the internal pressure is zero, there is a clear difference in the upper dome displacement between the Base Case and the Case 1 including aging effects. This difference is mainly due to the shrinkage and creep, which is not considered in the Base Case.
Design pressure Design pressure
-20 0 20 40 60 80 100
Wall horizontal displacement, mm
Base Case Case 1 - 10 yrs Case 1 - 30 yrs Case 1 - 60 yrs 0
100 200 300 400 500 600
-50 -30 -10 10 30 50 70 90 110 130 150
In
te
rn
a
l P
re
ss
u
re
,
k
P
a
Dome vertical displacement, mm
Base Case Case 1 - 10 yrs Case 1 - 30 yrs Case 1 - 60 yrs P
Ƹ\
Similar trends can be found in the perimeter wall between the Base Case and other cases. When the internal pressure is zero, the dome displacement is predicted to become more negative as the structure becomes older, but the increment becomes less significant as the structure ages. For example, from 10 years to 60 years, the predicted vertical displacement increases by only 6 mm and the horizontal displacement of the perimeter wall increases by only 4 mm due to the effects of time-dependent parameters when the internal pressure is zero. This result is because of the prediction model in which most of the creep and shrinkage occurs by 10 years after construction.
Under the design level internal pressure, the normal stress in either radial or circumferential directions is still in compression in the most part of the Base Case structure except the region near the perimeter wall-ring beam connection. With the increase of the internal pressure, first cracking is predicted to occur in vertical direction at the external face of the perimeter wall to ring beam intersection. At about 3.5 times the design pressure, the structure is predicted to start developing a mechanism due to the loss of strength of the perimeter wall in resisting circumferentially outward expansion. Meanwhile, the upper dome is predicted to start behaving as an arch membrane subjected to bidirectional tension stresses. The shape of the pressure-deformation curve implies that the ultimate failure of the perimeter wall would be associated with yielding of the prestressing steel. The internal pressure required to cause yielding is lower for the aged structure Case 1 than for the Base case. For the same increment of internal pressure, Case 1 tends to predict larger changes in vertical displacement than the Base Case because the structure in Case 1 develops tensile cracks earlier than the Base Case structure.
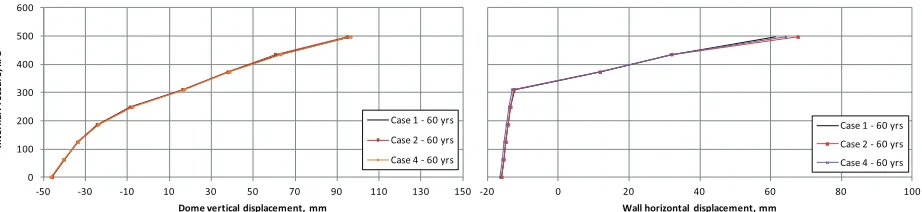
In terms of modelling, the temperature has mainly two effects: 1) depending on the temperature distribution, the shrinkage and creep strains can be different. 2) due to the thermal gradient between internal and external surfaces, the structure may be subjected to additional strain. Temperature also influences relaxation of steel though this is not considered in this study. The analysis results of the containment structure at the age of 60 years for Cases 1, 2, and 4 are compared in Figure 4. The figure clearly shows that the load-deformation curves from all three cases are very similar. This result implies that at the considered temperature range (40 ~ 60 °C), the predicted structural response at 60 years of age does not noticeably depend on temperature variation.
Figure 4. Sensitivity of structural response against internal temperature
Case 2 and Case 3 are identical models except that the support conditions are different. In Case 2, the support of the perimeter wall is pinned while in Case 3 the support is fixed. The analysis results show that the stress and crack distribution at the support are somewhat different. The overall force-deformation relationship, however, is very similar as shown in Figure 5. This results from the prestressing force “clamping” the bottom joint and preventing significant rotation whatever the boundary condition. Therefore, the support boundary condition has little impact on the overall response of the structure as modelled.
-20 0 20 40 60 80 100
Wall horizontal displacement, mm
Case 1 - 60 yrs Case 2 - 60 yrs Case 4 - 60 yrs 0
100 200 300 400 500 600
-50 -30 -10 10 30 50 70 90 110 130 150
In
te
rn
a
l P
re
ss
u
re
,
k
P
a
Dome vertical displacement, mm
Figure 5. Sensitivity of structural response against support conditions
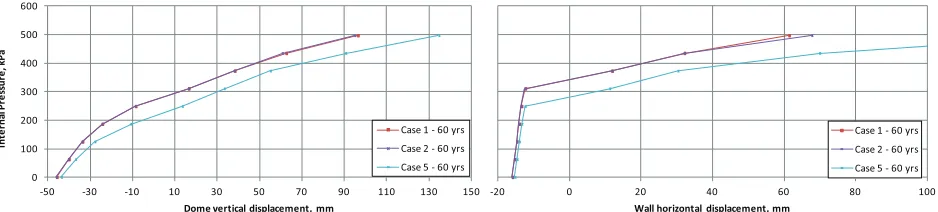
In Case 5, a significantly lower level of prestressing stress is used than other analysis cases. In addition, the DIN code is used to model time-dependent relaxation of the tendons. At the age of 60 years, the stresses in the tendons are in the range of 53~56% of ultimate stress. The relaxation model and the initial stress used may be overly conservative. However, the comparison of Case 1, Case 2, and Case 5 can provide insights into how the stress in the tendon influences the structural response. Figure 6 and Figure 7 compares force deformation curve of the three cases when the structure is 10 and 60 years, respectively.
The figure shows the Case 5 structure exhibits smaller stiffness and strength in comparison with other cases. This is because the Case 5 has smaller prestress, and it takes less internal pressure to develop cracks in the concrete than the other Cases. This analysis results clearly shows that the structural response is more sensitive to the stresses in the tendons than other time-dependent parameters.
Figure 6. Sensitivity of structural response against prestressing stress (10 years)
Figure 7. Sensitivity of structural response against prestressing stress (60 years)
CONCLUSION
The study investigated the performance of the nuclear containment structure when subjected to increasing internal pressure. Time-dependent effects and several other parameters were considered to understand the sensitivity of the structural behaviour; those included concrete shrinkage, creep, and prestressing tendons
-20 0 20 40 60 80 100
Wall horizontal displacement, mm
Case 2 - 60 yrs
Case 3 - 60 yrs 0 100 200 300 400 500 600
-50 -30 -10 10 30 50 70 90 110 130 150
In te rn a l P re ss u re , k P a
Dome vertical displacement, mm
Case 2 - 60 yrs
Case 3 - 60 yrs
-20 0 20 40 60 80 100
Wall horizontal displacement, mm
Case 1 - 10 yrs Case 2 - 10 yrs Case 5 - 10 yrs 0 100 200 300 400 500 600
-50 -30 -10 10 30 50 70 90 110 130 150
In te rn a l P re ss u re , k P a
Dome vertical displacement, mm
Case 1 - 10 yrs Case 2 - 10 yrs Case 5 - 10 yrs
-20 0 20 40 60 80 100
Wall horizontal displacement, mm
Case 1 - 60 yrs Case 2 - 60 yrs Case 5 - 60 yrs 0 100 200 300 400 500 600
-50 -30 -10 10 30 50 70 90 110 130 150
In te rn a l P re ss u re , k P a
Dome vertical displacement, mm
relaxation, internal temperature profile, and support conditions (fixed or pinned) at the base of the perimeter wall.
The analysis is carried out with the state of the art analysis tool, VecTor4, for concrete shell structures. The analysis results show that the containment structure would develop a ductile mechanism if the internal pressure were increased significantly. The apparent internal pressure that leads to a mechanism is approximately three times the design pressure. Time-dependent effects (shrinkage and creep) sensitively affect the response of the structure. Among the considered parameters, the effective prestressing stress most sensitively influences global behaviour.
REFERENCES
ACI Committee 209 (Ed.). (1992). Prediction of Creep, Shrinkage and Temperature Effects in Concrete Structures. Detroit: American Concrete Institute.
ACI Committee 209. (2008). Guide for Modeling and Calculating Shrinkage and Creep in Hardened Concrete. Detroit: American Concrete Institute.
Bazant, Z. . (2000). Criteria for Rational Prediction of Creep and Shrinkage of Concrete. In The Adam
Neville Symposium: Creep and Shrinkage-Structural Design Effects(pp. 237–260). Famington Hills, MI:
American Concrete Institute.
Bazant, Z. ., & Kim, J. K. (1995). Creep and Shrinkage Prediction Model for Analysis and Design of
Concrete Structures. Materials and Structures,25, 84–94.
Caputo, R. (2011). A Non-Linear Finite Element Analysis for an Offshore Oil Reserve Tank. University of Toronto.
CEB/FIP. (1990). CEB-FIP Model Code 1990. Comite Euro-International du Beton.
DIN 1045-1:2001-07. (2001). Concrete, Reinforced Concrete and Prestressed Concrete Structures-Part 1: Design and Construction. Beuth Verlag GmbH, Berlin.
Gardner, N. J., & Lockman, M. J. (2001). Design Provisions for Drying Shrinkage and Creep of Normal
Strength Concrete. Canadian Journal of Civil Engineering,98(March-April (2)), 159–167.
Hrynyk, T. D. (2013). Behavior and Modelling of Reinforced Concrete Slabs and Shells Under Static and Dynamic Loads. University of Toronto.
Lundqvist, P., & Nilsson, L.-O. (2011). Evaluation of prestress losses in nuclear reactor containments.
Nuclear Engineering and Design,241(1), 168–176.
Song, H.-W., Kim, S.-H., Byun, K.-J., & Song, Y.-C. (2002). Creep prediction of concrete for reactor
containment structures. Nuclear Engineering and Design,217(3), 225–236.
doi:10.1016/S0029-5493(02)00135-8
Vecchio, F. J., & Collins, M. P. (1986). The Modified Compression-Field Theory for Reinforced
Concrete Elements Subjected to Shear. ACI Journal,83(2), 219–231.
World Nuclear Association. (2014). Nuclear Power in Canada. Retrieved from