The multi-PMT optical module for the IceCube-Upgrade
LewClassen1,∗and AlexanderKappes1,∗∗for the IceCube Collaboration
1Institut für Kernphysik, Westfälische Wilhelms-Universität Münster, 48149 Münster, Germany
Abstract.Following the first observation of an astrophysical high-energy neu-trino flux with the IceCube Neuneu-trino Observatory in 2013, planning for an up-grade of the detector is progressing, which will expand the capabilities of the detector both at low and high neutrino energies. A substantial contribution to the improved performance is anticipated to be achieved by the application of advanced optical module technology. The multi-PMT optical module, mDOM, consists of 24 3-inch PMTs which provide, amongst others, a large, homoge-neous photosensitive area and sensitivity to the incident direction of photons. After an introduction, the current status of the mDOM development is presented with emphasis on the characterization of the photomultipliers under considera-tion.
1 The multi-PMT optical module (mDOM)
Located in the deep glacial ice of Antarctica, IceCube [1] is the world’s largest neutrino telescope. Originally designed for the investigation of the neutrino sky on the TeV to PeV energy scale and beyond, the energy threshold was lowered to∼10 GeV by the DeepCore [2] extension. In a next step, IceCube’s potential will be further enhanced through the installation of seven new strings in the DeepCore region (IceCube-Upgrade) which will be equipped with up to 120 optical modules each. This will lower IceCube’s energy threshold to few GeV and provide a platform for improved calibration of the detector. Novel optical sensors will have a key role in the expected performance enhancements. Among the new designs is the so-called mDOM, a multi-PMT Digital Optical Module. Optical modules based on this concept, first used for deep-sea detectors by the KM3NeT Collaboration [3], feature an array of several small photomultipliers (PMTs) housed inside a transparent pressure vessel (see Fig. 1). Currently, the designs of mechanical and electronic components of the mDOM are being finalized and a first performance demonstrator module is under construction.
2 mDOM components
2.1 Photomultipliers (PMTs)
With the mDOM being based on the KM3NeT multi-PMT module, the baseline PMT is a derivative of the well-characterized KM3NeT model from Hamamatsu. The mDOM however introduces stricter spacial constraints: the PMT including the base is limited to a conical volume with an opening angle of 45◦and an edge length of∼160 mm.
∗e-mail: [email protected]
Figure 1.mDOM overview:Left: Rendered view.Right: Exploded view.
HZC XP82B2F Hamamatsu R12199-01 mod
conductive coating
87 mm 80 mm
reflector connector
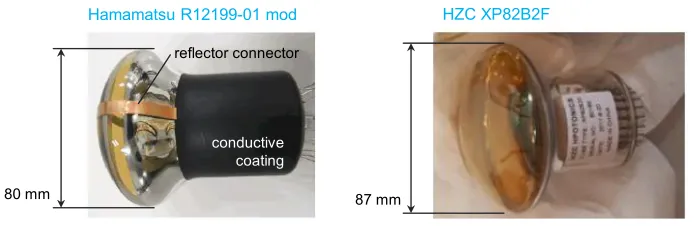
Figure 2.Candidate PMTs for the multi-PMT Digital Optical Module (mDOM).
The Hamamatsu typeR12199-01 MOD HAPMT (see Fig. 2,left) is a 80 mm photomulti-plier based on the KM3NeT model R12199-02. It was modified for the use in low-background applications with tight spacial constraints such as the mDOM. To fit this usage profile, the PMT features a tube that has been reduced in length from 97 mm to 93 mm and a so-called “HA-coating”, a conductive layer located on the outside surface of the tube surrounding the electron multiplier system which is electrically connected to the photocathode. This feature is designed to reduce and stabilize the dark-noise rate for PMTs operated at negative HV. In addition, the latest modification features a dedicated copper strip for easy connection of the optical reflectors (see Section 2.4) to photocathode potential. This measure is also di-rected at minimizing noise as conductive objects at non-photocathode potential close to the photocathode tend to invoke high and unstable dark-noise rates [4].
A promising alternative PMT candidate is theXP 82B2FPMT manufactured by HZC photonics (see Fig. 2,right). The device fits the tight spatial constraints of the mDOM while featuring a larger tube diameter of 87 mm. Being pin-compatible to the baseline Hamamatsu model, the integration effort is expected to be moderate while the larger tube diameter
pro-vides an increase in overall module photo-sensitive area of∼20−30 %.
2
EPJ Web of Conferences 207, 06004 (2019) https://doi.org/10.1051/epjconf/201920706004
Figure 1.mDOM overview:Left: Rendered view.Right: Exploded view.
HZC XP82B2F Hamamatsu R12199-01 mod
conductive coating
87 mm 80 mm
reflector connector
Figure 2.Candidate PMTs for the multi-PMT Digital Optical Module (mDOM).
The Hamamatsu typeR12199-01 MOD HAPMT (see Fig. 2,left) is a 80 mm
photomulti-plier based on the KM3NeT model R12199-02. It was modified for the use in low-background applications with tight spacial constraints such as the mDOM. To fit this usage profile, the PMT features a tube that has been reduced in length from 97 mm to 93 mm and a so-called “HA-coating”, a conductive layer located on the outside surface of the tube surrounding the electron multiplier system which is electrically connected to the photocathode. This feature is designed to reduce and stabilize the dark-noise rate for PMTs operated at negative HV. In addition, the latest modification features a dedicated copper strip for easy connection of the optical reflectors (see Section 2.4) to photocathode potential. This measure is also di-rected at minimizing noise as conductive objects at non-photocathode potential close to the photocathode tend to invoke high and unstable dark-noise rates [4].
A promising alternative PMT candidate is theXP 82B2FPMT manufactured by HZC
photonics (see Fig. 2,right). The device fits the tight spatial constraints of the mDOM while featuring a larger tube diameter of 87 mm. Being pin-compatible to the baseline Hamamatsu
model, the integration effort is expected to be moderate while the larger tube diameter
pro-vides an increase in overall module photo-sensitive area of∼20−30 %.
Temperature [°C] ~ 70 Hz @ -20°C ~ 30 Hz @ -20°C
Hamamatsu PMT
mean 27.3% min 26.0% max 28.4%
single photoelectron charge spectrum
peak (spe)
valley pedestal (0 pe)
spe charge
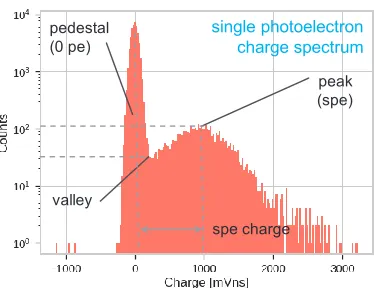
Figure 3.Single photoelectron (SPE) charge spectrum. Features used for gain and peak-to-valley ratio determination are highlighted.
2.2 Photomultiplier performance
PMT testing was carried out with slightly different setups in Erlangen (Hamamatsu PMT)
and Madison (HZC PMT). 66 Hamamatsu PMTs were tested while the HZC batch consisted of three tubes. The respective results are discussed in the following paragraphs. The perfor-mance of the KM3NeT PMT R12199-02 [5], the progenitor of the tested Hamamatsu model, was considered as reference.
Gain
The gain gwas derived from a single photoelectron (SPE) charge spectrum (illustrated in
Fig. 3) asg= ∆Q/e, where∆Qis the position of the single-photoelectron charge peak relative
to the pedestal determined from a fit of the distribution based on [6], andeis the electron
charge. For both PMT models the gain was determined in relation to the PMT supply voltage (also known as gain slope). This information allowed to identify the voltage corresponding to the nominal gain (Erlangen setup: 5·106 1; Madison setup: 1·107 2) at which the PMTs were operated for the rest of the study. In both cases the supply voltages were well between 900 V and 1300 V, the range of the reference model [5]. Details are presented in Fig. 4.
Peak-to-valley ratio
The peak-to-valley ratio, a quality parameter combining the baseline noise and SPE reso-lution, was also derived from the above-mentioned SPE spectrum (Fig. 3). Results for the Hamamatsu and HZC tubes are presented in Fig. 5. As large peak-to-valley ratios are favor-able, the HZC model features a slightly superior performance. However, the comparability is somewhat limited as the parameter increases with gain.
Transit-time spread
The transit-time spread (TTS) or signal jitter defines the single-photon time resolution achiev-able with a PMT. It was measured in terms of the standard deviation of a Gaussian distribution fitted to the main peak of the arrival time distribution. The latter was recorded illuminating
the PMT with a sub-nanosecond pulser and a mean photon illumination level<0.1 pe. The
results are displayed in Fig. 6. The Hamamatsu PMT is slightly superior to the HZC model.
This difference is expected to become more pronounced if both PMTs are operated at
identi-cal gain. The performace of both PMTs is comparable to the reference model [5].
1The gain envisioned for the mDOM.
2The gain of the current IceCube optical modules.
EPJ Web of Conferences 207, 06004 (2019) https://doi.org/10.1051/epjconf/201920706004
supply voltage [V] supply voltage [V]
mean 1155 V min 1055 V max 1257 V
mean 3.4 min 2.8 max 5.2
Hamamatsu PMT gain 5 ∙106
PMT peak-to-valley ratio SN80187 3.1 SN80171 4.3 SN80169 3.6
HZC
gain 107HZC PMT
PMT TTS [ns]
SN80187 1.8 SN80171 1.8 SN80169 1.4
gain 107
HZC PMT Hamamatsu PMT
gain 5 ∙106
mean 1.5 min 1.3 max 1.7
HZC PMT Hamamatsu PMT
gain 5 ∙106
Figure 4. Left: Distribution of nominal PMT supply voltages, i.e. the voltages needed to operate the PMTs at the standard gain of 5·106, for the tested Hamamatsu PMTs.Right:Gainslopes for the HZC
PMTs. supply voltage [V] supply voltage [V]
mean 1155 V min 1055 V max 1257 V
mean 3.4 min 2.8 max 5.2
Hamamatsu PMT gain 5 ∙106
PMT peak-to-valley ratio SN80187 3.1 SN80171 4.3 SN80169 3.6
HZC
gain 107HZC PMT
PMT TTS [ns]
SN80187 1.8 SN80171 1.8 SN80169 1.4
gain 107
HZC PMT Hamamatsu PMT
gain 5 ∙106
mean 1.5 min 1.3 max 1.7
HZC PMT Hamamatsu PMT
gain 5 ∙106
Figure 5.Left:Peak-to-valley ratio distribution obtained for 66 Hamamatsu PMTs at a gain of 5·106.
Right:Peak-to-valley ratios for the tested HZC PMTs at a gain of 107.
Dark noise rate
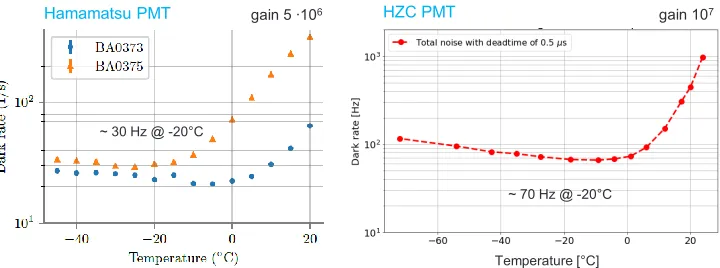
As the deep ice at the South Pole has negligible optical activity the dependence of the dark-rate on temperature is of particular interest. The test sample consisted of two Hamamatsu PMTs and one specimen of the HZC model. The results are illustrated in Fig. 7. Towards lower temperature, the rate first decreases due to reduced thermionic emission from the
pho-tocathode. Below 0◦C, light from radioactive decays in the glass of the PMT envelop
be-comes the dominant source of noise. In the temperature range most relevant for the
IceCube-Upgrade (around−20◦C at the installation depths of the modules [7]) the rate for both PMT
models is well below 100 s−1. The larger dark rate of the HZC model is at least partially
caused by the larger photocathode area and the higher operation voltage associated with the
higher gain selected (the shorter dead-time of 0.5µs during data taking for the HZC PMT
compared to 1µs for the Hamamatsu PMT accounts only for few counts per second).
4
EPJ Web of Conferences 207, 06004 (2019) https://doi.org/10.1051/epjconf/201920706004
supply voltage [V] supply voltage [V]
mean 1155 V min 1055 V max 1257 V
mean 3.4 min 2.8 max 5.2
Hamamatsu PMT gain 5 ∙106
PMT peak-to-valley ratio SN80187 3.1 SN80171 4.3 SN80169 3.6
HZC
gain 107HZC PMT
PMT TTS [ns]
SN80187 1.8 SN80171 1.8 SN80169 1.4
gain 107
HZC PMT Hamamatsu PMT
gain 5 ∙106
mean 1.5 min 1.3 max 1.7
HZC PMT Hamamatsu PMT
gain 5 ∙106
Figure 4. Left: Distribution of nominal PMT supply voltages, i.e. the voltages needed to operate the PMTs at the standard gain of 5·106, for the tested Hamamatsu PMTs.Right:Gainslopes for the HZC
PMTs. supply voltage [V] supply voltage [V]
mean 1155 V min 1055 V max 1257 V
mean 3.4 min 2.8 max 5.2
Hamamatsu PMT gain 5 ∙106
PMT peak-to-valley ratio SN80187 3.1 SN80171 4.3 SN80169 3.6
HZC
gain 107HZC PMT
PMT TTS [ns]
SN80187 1.8 SN80171 1.8 SN80169 1.4
gain 107
HZC PMT Hamamatsu PMT
gain 5 ∙106
mean 1.5 min 1.3 max 1.7
HZC PMT Hamamatsu PMT
gain 5 ∙106
Figure 5.Left:Peak-to-valley ratio distribution obtained for 66 Hamamatsu PMTs at a gain of 5·106.
Right:Peak-to-valley ratios for the tested HZC PMTs at a gain of 107.
Dark noise rate
As the deep ice at the South Pole has negligible optical activity the dependence of the dark-rate on temperature is of particular interest. The test sample consisted of two Hamamatsu PMTs and one specimen of the HZC model. The results are illustrated in Fig. 7. Towards lower temperature, the rate first decreases due to reduced thermionic emission from the
pho-tocathode. Below 0◦C, light from radioactive decays in the glass of the PMT envelop
be-comes the dominant source of noise. In the temperature range most relevant for the
IceCube-Upgrade (around−20◦C at the installation depths of the modules [7]) the rate for both PMT
models is well below 100 s−1. The larger dark rate of the HZC model is at least partially
caused by the larger photocathode area and the higher operation voltage associated with the
higher gain selected (the shorter dead-time of 0.5µs during data taking for the HZC PMT
compared to 1µs for the Hamamatsu PMT accounts only for few counts per second).
supply voltage [V] supply voltage [V]
mean 3.4 min 2.8 max 5.2
Hamamatsu PMT gain 5 ∙106
PMT peak-to-valley ratio SN80187 3.1 SN80171 4.3 SN80169 3.6
HZC
gain 107HZC PMT
PMT TTS [ns]
SN80187 1.8 SN80171 1.8 SN80169 1.4
gain 107
HZC PMT Hamamatsu PMT
gain 5 ∙106
mean 1.5 min 1.3 max 1.7
Figure 6.Transit-time spread (TTS,σ) for the tested Hamamatsu (left) and HZC (right) PMTs, obtained at respective standard gains.
Temperature [°C]
HZC PMT
Hamamatsu PMT gain 5 ∙106 gain 107
~ 70 Hz @ -20°C ~ 30 Hz @ -20°C
Hamamatsu PMT mean 27.3% min 26.0% max 28.4% single photoelectron charge spectrum peak (spe) valley pedestal (0 pe)
Figure 7. Dark rate as a function of the ambient temperature, measured for two specimen of the Hamamatsu model (left) with a dead-time of 1µs and one HZC PMT (right) with a dead-time of 0.5µs. The PMTs were operated at respective standard gains at all temperatures.
Quantum efficiency
As of now, the quantum efficiency was measured for the Hamamatsu model only.
Monochro-matic light selected via a monochromator from the spectrum of a continuous light source was guided onto the PMT’s photocathode, illuminating the innermost region of approximately
1 cm2. The resulting photocathode current was collected via a dedicated base shorting the
electron multiplier system and calibrated with the current from a reference photo-diode
ex-posed to an identical photon flux. The resulting quantum efficiency spectra are presented in
Fig. 8. The values are comparable to measurements by the manufacturer as well as to the quantum efficiency of the reference model [5].
Response uniformity
For one specimen of the Hamamatsu PMT the response uniformity was investigated in terms
of the relative anode signal. The output of a pulsed light source (λ=390 nm) was fed into a
fiber. The collimated fiber output, oriented parallel to the PMT axis (beam diameter<1 mm), EPJ Web of Conferences 207, 06004 (2019) https://doi.org/10.1051/epjconf/201920706004
Temperature [°C]
HZC PMT
Hamamatsu PMT gain 5 ∙106 gain 107
~ 70 Hz @ -20°C ~ 30 Hz @ -20°C
Hamamatsu PMT
mean 27.3% min 26.0% max 28.4%
single photoelectron charge spectrum
peak (spe)
valley pedestal (0 pe)
spe charge
Figure 8.Left:Quantum efficiency (QE) spectra for all tested Hamamatsu PMTs.Left:Distribution of
the quantum efficiency for 390 nm photons.
50%
large spot small spot
80 m
m
Figure 9. Left: Anode response scan of the Hamamatsu R12199-02. The dashed white line marks a circle with 80 mm diameter. Values are normalized to the center.Right:Example vertical and horizontal slices selected from the scans, comparing the results obtained with different beam diameters.
was moved inx-yacross the entrance window of the PMT determining the photo-current at
each position. Results of the scan, presented in Fig. 9, show the contribution of internal reflections inside the PMT. The data also allowed to derive an effective diameter for the PMT
under investigation (integration of the area weighted by the relative signal strength) which was found to be 77 mm to 78 mm, exceeding the more conservative statement of 72 mm by the manufacturer.
2.3 Readout electronics and high voltage generation
The general requirements for the readout and high voltage systems are a low power consump-tion, low sensitivity to interference signals, a low footprint and high reliability, paired with the ability to sample semi-complex wave-forms from the PMTs. IceCube uses a modular archi-tecture of common electronics components (communication, timing etc.) with well-defined
6
EPJ Web of Conferences 207, 06004 (2019) https://doi.org/10.1051/epjconf/201920706004
Temperature [°C] ~ 70 Hz @ -20°C ~ 30 Hz @ -20°C
Hamamatsu PMT
mean 27.3% min 26.0% max 28.4%
single photoelectron charge spectrum
peak (spe)
valley pedestal (0 pe)
spe charge
Figure 8.Left:Quantum efficiency (QE) spectra for all tested Hamamatsu PMTs.Left:Distribution of
the quantum efficiency for 390 nm photons.
50%
large spot small spot
80 m
m
Figure 9. Left: Anode response scan of the Hamamatsu R12199-02. The dashed white line marks a circle with 80 mm diameter. Values are normalized to the center.Right:Example vertical and horizontal slices selected from the scans, comparing the results obtained with different beam diameters.
was moved inx-yacross the entrance window of the PMT determining the photo-current at
each position. Results of the scan, presented in Fig. 9, show the contribution of internal reflections inside the PMT. The data also allowed to derive an effective diameter for the PMT
under investigation (integration of the area weighted by the relative signal strength) which was found to be 77 mm to 78 mm, exceeding the more conservative statement of 72 mm by the manufacturer.
2.3 Readout electronics and high voltage generation
The general requirements for the readout and high voltage systems are a low power consump-tion, low sensitivity to interference signals, a low footprint and high reliability, paired with the ability to sample semi-complex wave-forms from the PMTs. IceCube uses a modular archi-tecture of common electronics components (communication, timing etc.) with well-defined
0 100 200 300 400 500 600 700
Pressure (bar)
0 500 1000 1500 2000 2500 3000 3500
Deformation
(
µ
m)
700 bar test
Top half hor. (5.233±0.003)µm/bar
Bottom half hor. (5.210±0.002)µm/bar
Vertical (3.200±0.001)µm/bar
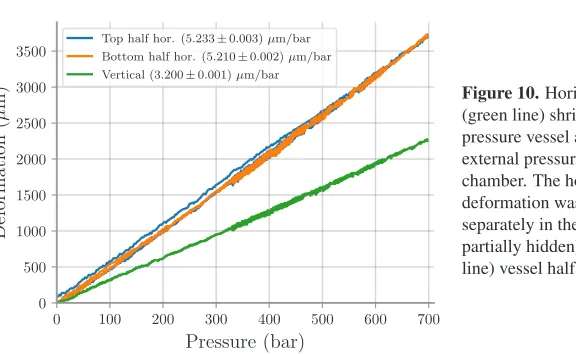
Figure 10.Horizontal and vertical (green line) shrinkage of an mDOM pressure vessel as function of external pressure in a hyperbaric chamber. The horizontal deformation was measured separately in the upper (blue line, partially hidden) and lower (orange line) vessel half.
interfaces to reduce the development efforts for the different modules. The baseline of the
high-voltage system is a low-power Cockcroft-Walton circuitry for high-voltage generation on the PMT base. The baseline design for the readout consists of “slow” ADCs (e.g. 12 bit, 100 MSPS) which digitize the signals individually for each PMT. Precise leading-edge timing
is provided by fast sampling (>500 MHz) of a comparator output which analyzes the analog
PMT signal at a low threshold of about 0.2 pe.
2.4 Support structure and reflectors
A support structure is used to position PMTs, reflectors and the main electronics board inside the pressure vessel. This component is produced via selective laser sintering (a form of 3D printing) from white polyamide and subsequently died black with non-conductive color. The color was chosen as a white structure only marginally increases the overall module sensitivity while enhancing the amount of undesired photon scattering. In addition to positioning, the design ensures electric insulation of the photocathode at negative HV with gel pockets.
Mounted around the entrance window of the PMTs, light concentrators or reflectors
in-crease the PMT’s effective area for vertical illumination. The devices are produced from
enhanced-reflectivity coated aluminum sheets. The reflectors allow to reclaim photons other-wise lost due to shadowing and absorption in glass and gel. With respect to realistic config-urations the utilization of reflectors yields an extra∼20% in overall module sensitivity. The material was chosen to maximize the average Cherenkov-weighted reflectivity based on lab measurements. In a Monte Carlo study, simulating the incidence of a plane wave-front, the opening angle was optimized to provide maximum sensitivity for vertical photons, narrowing
the PMT’s field of view. This resulted in a final angle of 51◦ with respect to the symmetry
axis of the PMT. The effective concentration of the photon acceptance at small incidence
angles comes at only marginal cost in terms of overall sensitivity (<1% deviation from the achievable maximum).
2.5 Pressure vessel and optical gel
With its cylindrical extension around the equator (see Fig. 1), the mDOM pressure vessel slightly deviates from the usual spherical form factor. The design is driven by the limited diameter of the borehole and the non-reducible length of the PMTs. The pressure vessel is rated for 700 bar. This criterion, which is substantially larger than the hydrostatic pressure EPJ Web of Conferences 207, 06004 (2019) https://doi.org/10.1051/epjconf/201920706004
at the location of the detector, is based on the measured pressure peaks during re-freezing where up to 550 bar were observed during IceCube construction. The pressure rating has been verified in pressure tests: Figure 10 shows the reduction in horizontal and vertical diameter of the pressure vessel as function of external pressure. The shrinkage is reversible and agrees well with calculations based on finite element simulations.
Curing two-component silicone gel, poured between the PMTs and the pressure vessel, provides optical coupling as well as structural stability an cushioning. The baseline choice for prototyping is QGel 900 by Quantum Silicones which has been employed in the original IceCube optical module and proven to be usable at low ambient temperatures.
3 Conclusion & Outlook
The multi-PMT Digital Optical Module (mDOM) is being developed for deployment in the deep ice at the South Pole for future IceCube extensions (IceCube-Upgrade, IceCube-Gen2 [8]). Harsh environmental conditions and available infrastructure pose stringent limits on the module parameters like size, power consumption and reliability. The mechanical de-sign of the mDOM is well advanced and is currently being scrutinized and optimized. The Hamamatsu R12199-01 HA mod PMT, a well-characterized model suited for the applica-tion, is considered the baseline model for the mDOM and will be used in the construction of a demonstrator module. The HZC XP 82B2F could be a viable alternative: The examined PMTs feature a performance comparable to the Hamamatsu model and a larger batch has been ordered for further testing. These tests will also include the parameters not investigated so far, such as the quantum efficiency and the effective diameter, which will allow to assess
the actual sensitivity gain from the utilization of the new model. For the readout and HV electronics baseline designs have been developed and prototypes are under construction. A fully integrated and operational module is expected to be available by the end of 2019.
References
[1] M.G. Aartsen et al. (IceCube), JINST12, P03012 (2017),arXiv:1612.05093 [2] R. Abbasi et al. (IceCube), Astroparticle Phys.35, 615 (2012),arXiv:1109.6096 [3] H. Löhner et al. (KM3NeT), Nucl. Inst. Meth.A718, 513 (2013)
[4] Photomultiplier Tubes – Basics and Applications, Hamamatsu Photonics K.K., 3rd edn. (2007), https://www.hamamatsu.com/resources/pdf/etd/PMT_handbook_ v3aE.pdf
[5] S. Aiello et al., JINST13, P05035 (2018)
[6] E. Bellamy et al., Nucl. Inst. Meth.A339, 468 (1994)
[7] M. Aartsen et al. (IceCube), Nucl. Inst. Meth.A711, 73 (2013),arXiv:1301.5361 [8] M.G. Aartsen et al. (IceCube) (2014),arXiv:1412.5106
8
EPJ Web of Conferences 207, 06004 (2019) https://doi.org/10.1051/epjconf/201920706004