Performance Analysis of Optical Spatial Modulation
in Atmospheric Turbulence Channel
Hammed G. Olanrewaju1,†,‡ , John Thompson2,†,‡and Wasiu O. Popoola3,†,‡* 1 [email protected]
2 [email protected] 3 [email protected]
* Correspondence: [email protected]
† School of Engineering, Institute for Digital Communications, LiFi R&D Centre, University of Edinburgh, United Kingdom.
‡ These authors contributed equally to this work.
1
2
3
4
5
6
7
8
9
10
11
12
13
14
§ InvitedPaper
Abstract:Inthispaper,spatialpulsepositionmodulation(SPPM)isusedasacasestudytoinvestigate theperformanceoftheopticalspatialmodulation(SM)techniqueinoutdooratmosphericturbulence (AT).Aclosed-formexpressionfortheupperboundontheasymptoticsymbolerrorrate(SER)of SPPMinATisderivedandvalidatedbyclosely-matchingsimulationresults.Theerrorperformance isevaluatedinweaktostrongATconditions.AstheATstrengthincreasesfromtheweaktostrong, the channelfading coefficientsb ecomem ored isperseda ndd ifferentiable.T hus,ab ettererror performanceisobservedundermoderate-to-strongATcomparedtoweakAT.Theperformance in weak AT can beimproved by applying unequal power allocation to make FSO links more distinguishableatthereceiver.Receivediversityisconsideredtomitigateirradiancefluctuationand improvetherobustnessofthesystemtoturbulence-inducedchannelfading. Thediversityorder iscomputedashalfofthenumberofdetectors.Performancecomparisons,intermsofenergyand spectralefficiencies,aredrawnbetweentheSPPMschemeandconventionalMIMOschemessuchas repetitioncodingandspatialmultiplexing.
Keywords:opticalcommunications;opticalspatialmodulation;free-spaceopticalcommunication; multiple-input-multiple-output(MIMO)systems;pulsepositionmodulation;atmosphericturbulence. 15
1. Introduction 16
Free-space optical communication (FSO) technology is a promising complement to existing 17
radio frequency communications. In addition to its huge bandwidth resource and its potential to 18
support gigabit rate throughput, the FSO system can be deployed using low-power and low-cost 19
components [1,2]. The major drawback of the FSO technology is its dependence on atmospheric 20
conditions, which affects link availability. Variations in pressure and temperature create random 21
changes in the refractive index of the atmosphere. This leads to atmospheric turbulence (AT) induced 22
fluctuation in the received irradiance [3–5]. 23
In order to enhance capacity, reliability and/or coverage, multiple-input multiple-output (MIMO) 24
techniques are employed to exploit additional degrees of freedom, such as the space and emitted 25
colour of the optical sources and the field of view of the detectors. FSO systems using MIMO diversity 26
techniques are explored in [4,6,7] to mitigate the effect of turbulence-induced fading by providing 27
redundancy. In this paper, we consider the use of a low-complexity MIMO technique known as spatial 28
modulation (SM) [8,9], to enhance the spectral efficiency of FSO systems. The SM technique achieves 29
higher spectral efficiency by encoding additional information bits in the spatial domain of the multiple 30
optical sources at the transmitter. 31
Multiple variants of SM have been explored in FSO systems, using different statistical distributions 32
to model the channel fading [10–15]. A variant of optical SM (OSM) termed space shift keying (SSK) is 33
studied in [10–12]. In the SSK scheme, no digital signal modulation is used, and the information bits are 34
encoded solely on the spatial index of the optical sources. Our paper differs from these previous works 35
in that we have considered a full-fledged OSM scheme which entails using both the spatial index of the 36
sources and the transmitted digital signal modulation to convey the information bits. The work in [13] 37
is related to ours, as it considered an OSM scheme in which digital signal modulation is also employed. 38
However, the analytical framework includes kernel density estimation which does not provide a 39
closed-form solution. Using the Homodyned-K (HK) distribution to model turbulence-induced fading, 40
the performance of outdoor OSM (SSK) with coherent detection is reported in [14]. Also, [16] considers 41
power series based analysis of effect of misalignment and Gamma–Gamma turbulence fading on the 42
SM technique with BPSK constellation 43
Given that AT primarily affects the emitted light intensity, pulse position modulation (PPM) 44
is commonly used in an FSO system because, unlike on-off keying (OOK) and pulse-amplitude 45
modulation (PAM), its detection process is not reliant on the channel states [3]. Nevertheless, PPM 46
is limited by its high bandwidth requirement. In order to enhance the spectral efficiency of PPM, a 47
variant of the OSM technique termed spatial pulse position modulation (SPPM) [17] is explored in this 48
paper. SPPM also benefits from the power efficiency of the PPM technique. The intensity fluctuations 49
caused by AT is modelled by the Gamma-Gamma (GG) distribution, which is widely adopted to study 50
FSO links under weak to strong AT conditions because it matches experimental results [1,18]. 51
In this work, the performance of an SPPM-based FSO system is evaluated under weak to strong 52
AT conditions. The contributions of this paper include: (1) the theoretical expression for the upper 53
bound on the asymptotic symbol error rate (SER) of SPPM in FSO channels is derived and validated 54
by closely matching simulation results. (2) As the AT strength increases from the weak to strong, 55
the distribution of the fading coefficients spreads out more. Thus, the influence of the dispersion 56
of the coefficients on error performance of OSM schemes is explored under different AT conditions. 57
(3) Furthermore, since SM provides increased throughput but not transmit diversity gain, spatial 58
diversity is considered at the receiver in order to improve the system performance, and the diversity 59
gain of the multiple-detector system is obtained from the error plots. (4) The performance of the SPPM 60
scheme is also compared to that of SSK and other conventional MIMO schemes such as repetition 61
coding (RC) and spatial multiplexing (SMUX). The performance comparison is presented in terms of 62
energy and spectral efficiencies. 63
The rest of the paper is organized as follows. The system and channel models are provided in 64
Section2. In Section3, the theoretical derivation of the upper bound on asymptotic SER of SPPM in 65
GG FSO channels is presented. The results of the performance evaluation are provided and discussed 66
in Section4, and our concluding remarks are given in Section5. 67
2. System and Channel Model 68
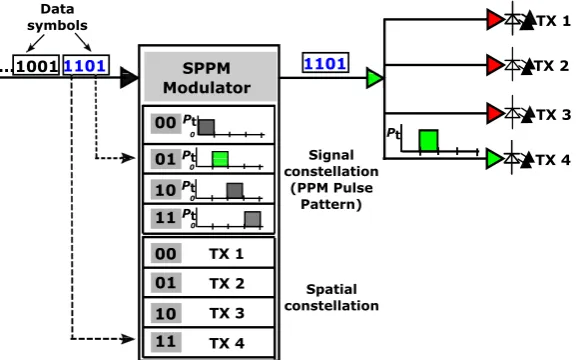
2.1. The SPPM Scheme 69
Considering an Nt×Nr optical MIMO system with Nt optical transmit units (TXs), i.e., light 70
emitting diodes (LEDs) or lasers andNrreceive units (RXs), i.e., PIN photodetectors (PD), by using the 71
SPPM scheme [17], only one of the TXs is activated in a given symbol duration, while the rest of the 72
TXs are idle. The activated source transmits anL-PPM signal pattern, whereLdenotes the number of 73
time slots (chips) in a symbol duration. A total ofM=log2(NtL)bits are transmitted per data symbol. 74
The first log2(Nt)most significant bits are encoded in the index (position) of the activated TX while the 75
remaining log2(L)bits are conveyed by the pulse position in the transmitted PPM signal. The SPPM 76
encoding is further illustrated in Figure1for the case ofNt=4 andL=4. For instance, to transmit the 77
symbol ‘13’ with binary representation ‘1101’, the two most significant bits, ‘11’, are used to select ‘TX 78
4’, while the last two bits, ’01’, indicate that the pulse will be transmitted in the second time slot of the 79
...1001 SPPM Modulator
1101
11 10 00
01
1101
Spatial constellation
Signal constellation
(PPM Pulse Pattern)
Pt
11 10 00
01
TX 1
TX 4 TX 3 TX 2
TX 2
TX 3
0
0
0 0
TX 4 TX 1
Data symbols
Pt
Pt
Pt
Pt
Figure 1.Illustration of SPPM encoding usingNt=4,L=4.
2.2. SPPM System Model 81
Consider that a data symbol is transmitted by activating thejth LED, 1≤j≤Nt, to transmit a
pulse in slotm, 0≤m≤(L−1), of theL-PPM signal, theNr×1 vector of received electrical signal over
the symbol duration,T, is:
r(t) =ωjRH sj,m(t) +n(t), 0≤t≤T, (1) where Ris the responsivity of the PD. The parameter ωj for j=1, . . . ,Nt, are weights which can 82
be applied to induce power imbalance between the TXs in order to improve their differentiability 83
of at the receiver. The Nr×Nt FSO channel matrix is represented byH. The quantityn(t)is the 84
sum of the ambient light shot noise and the thermal noise in theNr PIN PDs, and it is modelled as 85
independent and identically distributed (i.i.d) additive white Gaussian noise (AWGN) with variance 86
σ2=N0/2;N0represents the noise power spectral density [1,19]. The Nt×1 transmit signal vector, 87
sj,m(t) = [0, . . . ,sj,m(t), . . . , 0]T, has a nonzero entry at the index of the activated jth TX, whereT
88
denotes the transpose operation, andsj,m(t)is the transmitted L-PPM waveform, with a pulse of
89
amplitudePtin slotm. 90
The matched filter (MF) receiver architecture employs a unit-energy receive filter, and the output of the MF in each time slot is obtained by sampling at the chip rate, 1/Tc, where the duration of each
time slot,Tc=T/L. Based on the maximum likelihood (ML) detection criterion, the estimate of the
transmitted SPPM symbol is obtained from the combination of the pulse position and the TX index which gives the minimum Euclidean distance from the received signal [17]. That is,
[mˆ, ˆj] =arg max
m,j fr r|sj,m,ωj,H
, (2)
where fr r|sj,m,ωj,H is the probability density function (PDF) of r conditioned on sj,m being
91
transmitted, weightωjand channel matrixH.
92
2.3. FSO Channel Model 93
As the transmitted signal propagates through the FSO channel, it experiences turbulence-induced channel fading which is characterised by the GG distribution [1,20]. The PDF of the GG fading coefficients is given by [20]:
fH(h) = 2(
αβ) α+β
2
Γ(α)Γ(β)h α+β
2 −1K
α−β(2
p
where h is the fading coefficient. The functionsΓ(·) and Kν(·) denote the Gamma function and
94
the modified Bessel function of the second kind of orderν, respectively. The scalarsα andβare 95
the scintillation parameters that characterize the intensity fluctuations, and they are related to the 96
atmospheric conditions through the log-intensity varianceσl2. The values ofα,βandσl2specified for 97
different regimes of atmospheric turbulence are given in Table1from [1]. 98
Table 1.Atmospheric turbulence parameters [1].
Turbulence Level σl2 α β
Weak 0.2 11.7 10.1
Moderate 1.6 4.0 1.9
Strong 3.5 4.2 1.4
In order to provide a closed-form solution, the modified Bessel function in (3) is expressed in terms of the Meijer-G function,Gca,,db(·)by applying [21, (8.4.23.1)]:
Kα−β(2
p
αβh) =1 2G
2,0 0,2
αβh
− α−β
2 , β−α
2
, (4)
to obtain:
fH(h) = (αβ)
α+β 2
Γ(α)Γ(β)h α+β
2 −1G2,0 0,2
αβh
− α−β
2 ,β −α
2
. (5)
To further simplify (5), we utilize [21, (8.2.2.15)]:
ZαGm,n p,q
z
(ap)
(bq)
=Gpm,q,n
z
(ap)+α
(bq)+α
, (6)
and the expression (5) is reduced to:
fH(h) = (αβ)
Γ(α)Γ(β)G 2,0 0,2
αβh
−
α−1,β−1
. (7)
It is assumed that the individual units in the transmitter and receiver arrays are spatially separated 99
by at least the correlation width,wc=
√
λd, such that the elements of the FSO channel matrix,H, are 100
independent and uncorrelated. The transmission wavelength and the link distance are denoted byλ 101
anddrespectively. This assumption is realistic because the transverse correlation width of the laser 102
radiation in AT is typically on the order of a few centimeters [5,22]. For instance, in an FSO system 103
withλ=1.55µm and link distance ofd=2.5 km, for the received signals to be uncorrelated, the 104
required spatial spacing is aboutwc=6.2 cm. Thus, we can infer that the proposed system model can 105
be implemented with practical spacings between each unit of the transmit and receive arrays. 106
3. Performance Analysis of SPPM in FSO 107
As stated in Section2.2, a transmitted data symbol is correctly detected if both the pulse position and the TX index are correctly detected. Thus, the symbol error probability of SPPM is given by:
Pe,sym =1− Pc,tx×Pc,ppm, (8)
wherePc,ppmis the probability of correctly detecting the PPM pulse position andPc,txis the probability 108
of correctly detecting the index of the activated TX given that pulse position has been correctly detected. 109
3.1. Probability of Correct Transmitter Detection 111
Consider that the transmitted data symbol is sent by activating TXj. For a correctly detected pulse position, the pairwise error probability (PEP) that the receiver decides in favour of TXiinstead ofj, is given by [17]:
PEPjm→i= 1 2erfc
√
γs
2 Nr
∑
k=1
ωihik−ωjhjk !
, (9)
where erfc(·) denotes the complementary error function. The scalarshik and hjk for 1≤i,j≤Nt, 112
are the channel fading coefficients of the link between thekth PD and the TXsiandjrespectively. 113
The signal-to-noise ratio (SNR) per symbol,γs=Es/N0, and the average energy per symbol,Es = 114
(RPt)2Tc. 115
To simplify the analyses that will follow, we define the following random variables (RV):
Uk=ωihik, Vk=ωjhjk, and Xk=Uk−Vk. Also, we define Yk=|Xk|, Zk =Yk2γs, and ψ=∑ Nr
k=1Zk. Therefore, equation (9) becomes:
PEPjm→i= 1 2erfc
√ ψ 2
. (10)
Furthermore, the expression in (10) represents the instantaneous PEP conditioned on the random variableψ. Therefore, by averaging over the PDF ofψ, the average PEP is obtained as:
APEPmj→i = 1 2
Z ∞
0 erfc √
ψ 2
fψ(ψ)dψ. (11)
The PDF ofψ, as well as the APEPjm→i, is obtained as follows.
116
The random variable, Xk, is a function of two independent, identically distributed and non-negative GG random variables,hikandhjk, whose PDF is given by (7). By the transformation of RV, the PDF ofXkis obtained as:
fXk(xk) =
Z ∞
−xk
fUk(xk+vk)fVk(vk)dvk; forxk <0 Z ∞
0 fUk
(xk+vk)fVk(vk)dvk; forxk ≥0.
(12)
Considering the first case in (12), i.e.,xk <0, by using the variable substitution:τ=vk+xk, we obtain:
fXk(xk) =
Z ∞
0 fUk(τ)fVk(τ−xk)dτ for xk<0. (13)
The PDFs fUkand fVkof the RVsUkandVkrespectively, are derived from (7), and they are applied in (13) to express the PDF of the RVXkas:
fXk(xk) =
(αβ)2
ωiωj(Γ(α)Γ(β))2 Z ∞
0 G 2,0 0,2
αβτ
ωi
−
α−1,β−1
G0,22,0
αβ(τ−xk)
ωj
−
α−1,β−1
dτ. (14)
Also, the transformation in [21, (2.24.1.3)] is employed to solve the integral of the product of two Meijer-G terms, and thus, (14) reduces to:
fXk(xk) =
αβ
ωi(Γ(α)Γ(β))2 ∞
∑
λ=0
(xk)λ
λ! G 2,3 3,3
ω
j
ωi
0,1+λ−α,1+λ−β α−1,β−1,λ
. (15)
Similarly, for the second case in (12), i.e., xk ≥ 0, by using (7) and [21, (2.24.1.3)], the expression
117
obtained for fXk(xk)is the same as that given in (15).
Now, the PDF ofYkis given by:
fYk(yk) = fXk(yk) + fXk(−yk) for yk >0. (16)
SinceYk is an absolute value function, thenyk > 0∀k. Thus, fXk(yk) = fXk(xk) for xk ≥ 0 and fXk(−yk) = fXk(xk)forxk<0 as defined by (12). Hence, from (16), the PDF ofYkis given by:
fYk(yk) =2 fXk(yk)
= 2αβ
ωi(Γ(α)Γ(β))2 ∞
∑
λ=0
(yk)λ
λ! G 2,3 3,3 ωj ωi
0,1+λ−α,1+λ−β α−1,β−1,λ
. (17)
Using RV transformation between variablesYkandZk, the PDF ofZkcan be expressed as:
fZk(zk) =
1 2√zkγsfYk
p zk/γs
= αβ
ωi(Γ(α)Γ(β))2 ∞
∑
λ=0
(zk) λ−1
2
λ!(√γs)λ+1
×G3,32,3 ω j ωi
0,1+λ−α,1+λ−β α−1,β−1,λ
. (18)
As defined above, the random variableψis a sum ofNri.i.d realizations of variableZk. Therefore, to obtain the PDF ofψ, we first derive the moment generating function (MGF) ofZk. Using the the asymptotic PDF ofZk, which is obtained by substitutingλ=0 in (18), the MGF ofZkis obtained as:
MZk(s) = Z ∞
0 e
−szkhf
Zk(zk)
λ=0
i dzk
= αβ
ωi(Γ(α)Γ(β))2√γsG 2,3 3,3 ωj ωi
0,1−α,1−β α−1,β−1,0
×
Z ∞
0 e−szk p
(zk) dzk
= αβ
√
π
ωi(Γ(α)Γ(β))2√sγsG 2,3 3,3 ω j ωi
0, 1−α, 1−β α−1,β−1, 0
. (19)
From (19), the MGF of theψis given by:
Mψ(s) = Nr
∏
k=1 MZk(s)
=
αβ
√
πs ωi(Γ(α)Γ(β))2√γs
G3,32,3 ωj ωi
0,1−α,1−β α−1,β−1,0
Nr
. (20)
The PDF of the random variableψis obtained from the inverse Laplace transform ofMψ(s)as:
fψ(ψ) =
ψ( Nr
2−1)
Γ(Nr 2 )
αβ
√
π(γs)− 1 2
ωi(Γ(α)Γ(β))2 G3,32,3
ω j ωi
0,1−α,1−β α−1,β−1,0
!Nr
. (21)
By substituting (21) in (11), and applying the integral relation [23, (4.1.18)]:
Z ∞
0 erfc(ax)x
pdx= 1
(p+1)ap+1√πΓ p
2 +1
, (22)
for|arg{a}|<π/4,p<−1, the asymptotic PEP of detecting the index of the activated TX is given by:
APEPmj→i =
2NrΓ(Nr+1 2 ) NrΓ(N2r)
αβ
ωi(Γ(α)Γ(β))2√γs G3,32,3
ωj ωi
0,1−α,1−β α−1,β−1,0
!Nr
ForNtequiprobable TXs, using the union bound technique [24] the probability of correctly detecting
the TX index conditioned on a correctly detected pulse position is:
Pc,tx≤1− 1 Nt
Nt
∑
j=1
Nt
∑
i=1
i6=j
APEPmj→i
=1− 1
Nt
Nt
∑
j=1
Nt
∑
i=1
i6=j
2NrΓ(Nr+1 2 ) NrΓ(N2r)
αβ
ωi(Γ(α)Γ(β))2√γs G3,32,3
ωj ωi
0,1−α,1−β α−1,β−1,0
!Nr
. (24)
3.2. Probability of Correct Pulse Position Detection 119
Considering that the transmitted symbol is sent by activating TXjto transmit a pulse in slotmof theL-PPM signal, the average PEP of detecting slot`instead of slotm, is [17]:
APEPjm→`= 1 2 Z hj erfc Nr
∑
k=1 r
γs
2 (ωjhjk)
2 !
fH(hj)dhj, (25)
where fH(hj)is the joint PDF of theNr×1 vector of channel coefficients:hj = [hj1, ...,hjNr]. The integral in (25) requiresNr-dimensional integration over the PDF of the channel coefficients, given in (7). To
obtain a closed form evaluation, we utilize the approximation [25, (14)]:
erfc(x) ' 1
6e −x2
+1 2e
−4x2/3
. (26)
By employing (26), the expression in (25) yields:
APEPjm→`'
Z
hj
1 12e
−∑Nr k=1
γs
2(ωjhjk)2 f
H(hj)dhj +
Z hj 1 4e −4 3∑ Nr k=1 γs
2(ωjhjk)2 f
H(hj)dhj. (27)
Since the channel coefficients{hjk}Nk=r1are independent, then (27) can be expressed as:
APEPjm→`' 1
12 Nr
∏
k=1 Z ∞
0 e
−γs
2 (ωjhjk)2f
H(hjk)dhjk + 1 4
Nr
∏
k=1 Z ∞
0 e
−2γs
3 (ωjhjk)2f
H(hjk)dhjk. (28)
By applying (7) in (28), and expressing the exponential function in terms of the Meijer G-function [21, (8.4.3.1)]:
e−x=G0,11,0 x − 0 , (29)
the expression in (28) becomes:
APEPmj →`' 1
12 Nr
∏
k=1 αβ Γ(α)Γ(β) Z ∞ 0 G 1,0 0,1
−γs(ωjhjk)
2 2 − 0
G0,22,0αβhjk
−
α−1,β−1
dhjk
+1 4
Nr
∏
k=1 αβ Γ(α)Γ(β) Z ∞ 0 G 1,0 0,1
−2γs(ωjhjk)
2 3 − 0
G0,22,0αβhjk
−
α−1,β−1
The relation in [21, (2.24.1.1)] is then used to evaluate the integration of the product of two Meijer-G terms in (30), and the solution which results is expressed as:
APEPjm→`' 1
12 "
2(α+β)
(4π)Γ(α)Γ(β)G 1,4 4,1
−8(ωj)
2 γs
(αβ)2
1−α 2 ,1−α2,
1−β 2 ,1−
β 2, 0
#Nr
+ 1 4
"
2(α+β)
(4π)Γ(α)Γ(β)G 1,4 4,1
−32(ωj)
2γ s
3(αβ)2
1−α 2 ,1−α2,
1−β 2 ,1−
β 2, 0
#Nr . (31)
Using the union bound technique, the probability of correctly detecting the pulse position is given by:
Pc,ppm≤ 1 Nt
Nt
∑
j=1
1−
(L−1)×APEPjm→`
. (32)
Finally, the expressions (24) and (32) are substituted into (8) to obtain the upper bound on the 120
asymptotic symbol error probability of SPPM transmission in atmospheric turbulence channels. 121
4. Results and Discussions 122
The results of the performance evaluation of the SPPM technique over FSO channels are presented 123
in this section. In all cases, except where otherwise stated, equal weights, i.e.,{ωj}Nj=t1=1, are used. 124
The values ofαandβused for each turbulence regime are given in Table1. 125
Without any loss of generality, considering the SPPM configuration withNt=2, Nr =4 and 126
L= [2, 8], the plots of the SER versus SNR per bit,γb, under weak and strong AT conditions are shown 127
in Figure2. Similar error performance plots for the case ofNt=4 are depicted in Figure3. It can be 128
observed from Figure2and Figure3that the derived upper bound on the asymptotic SER of SPPM in 129
AT is closely matched by the simulation results. The error performance plot for moderate AT conditions 130
is similar to that of the strong AT, and hence for clarity, the plot for moderate AT is not included. The 131
reason for the SER values being greater than 1, as well as the slight deviations observed between the 132
theoretical and simulation results for SER>10−2, is due to the union bound technique used in the 133
analysis. Indeed, the closed form expression obtained in Section3can be used to study the performance 134
of SPPM in outdoor Gamma-Gamma fading channels without performing computationally intensive 135
Monte-Carlo simulations. In addition, using the PDF of the difference between two weighted GG RVs 136
in Section3, the framework can be extended to explore the performance of other variants the OSM 137
technique, such as spatial pulse amplitude modulation (SPAM) and generalised SPPM (GSPPM), in 138
FSO channels. For instance, to extend the framework to study the SPAM scheme, pulse amplitude 139
modulation (PAM) is used instead of the PPM scheme, and the transmit power weights,ω, designed 140
for creating power imbalance in this paper, will then represent the different intensity levels of the PAM 141
0 5 10 15 20 25 30 35
SNR per bit,γb(dB) 10-6
10-5 10-4 10-3 10-2 10-1 100
S
E
R
WT,L= 2 (Sim.) WT,L= 2 (Theory)
WT,L= 8 (Sim.) WT,L= 8 (Theory) ST, L= 2 (Sim.) ST, L= 2 (Theory)
ST, L= 8 (Sim.) ST, L= 8 (Theory)
Figure 2.Error performance of SPPM in weak and strong AT conditions.Nt=2,Nr=4 andL= [2, 8].
ST: Strong AT and WT: Weak AT.
0 5 10 15 20 25 30 35
SNR per bit,γb (dB) 10-6
10-5 10-4 10-3 10-2 10-1 100
S
E
R
WT,L= 2 (Sim.) WT,L= 2 (Theory) WT,L= 8 (Sim.) WT,L= 8 (Theory) ST, L= 2 (Sim.) ST, L= 2 (Theory) ST, L= 8 (Sim.)
ST, L= 8 (Theory)
Figure 3.Error performance of SPPM in weak and strong AT conditions.Nt=4,Nr=4 andL= [2, 8].
ST: Strong AT and WT: Weak AT.
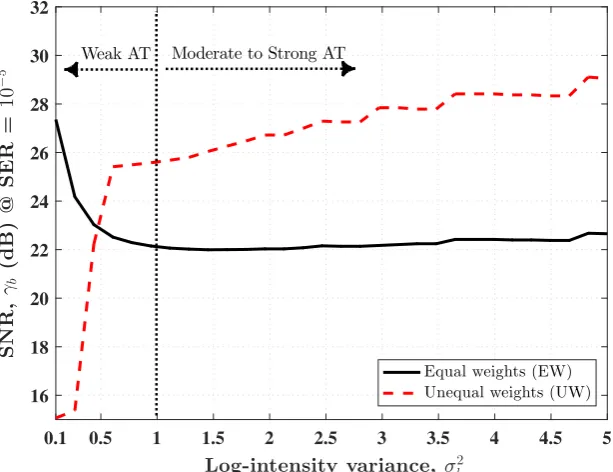
Using Nt=4, Nr=4 and L = 8, the SNR required to achieve a representative SER of 10−5 143
under different AT regimes is depicted in Figure4. For the case of equal transmit power weights, 144
i.e., {ωj}Nj=t1=1, it is observed that the SNR required under moderate to strong AT conditions is
145
smaller compared to weak AT cases. As an example, under weak (σl2=0.2), moderate (σl2=1.6) and 146
strong (σl2=3.5) AT regimes, the required SNR is about 24.5 dB, 22 dB and 22.3 dB respectively. This 147
observation can be attributed to the fact that as the AT strength increases from the weak to strong, 148
the distribution of the fading coefficients spreads out more, and the range of possible values of the 149
coefficients, then a better performance is expected under moderate to strong AT compared to weak 151
AT. However, we also note that as the AT strength increases, the effective SNR of the received signal 152
also decreases due to fading. This explains the slight increase in SNR requirements (albeit, less than 153
0.7 dB) observed under strong AT compared to moderate AT. Typically, the error performance of OSM 154
schemes is dependent on both the individual values of the channel coefficients as well as the difference 155
between them [17,26], as expressed by (25) and (9) respectively. 156
0.1 0.5 1 1.5 2 2.5 3 3.5 4 4.5 5
Log-intensity variance, σl2
16 18 20 22 24 26 28 30 32
S
N
R
,
γ
b
(d
B
)
@
S
E
R
=
1
0
−
5
Equal weights (EW) Unequal weights (UW)
Weak AT Moderate to Strong AT
Figure 4. Performance under varying AT regime. SNR required to achieve SER of 10−5for SPPM configuration:Nt=4,L=8.
Furthermore, the system performance under weak AT conditions can be improved by applying unequal power allocation (PA) to make the TXs more distinguishable at the receiver. That is, the optical sources transmit at different peak powers. To keep the the average optical power constant, total emitted power is re-distributed by reducing the power of some TXs and assigning the surplus optical power to the other TXs. The optical PA factorρ, 0<ρ≤1, is used to generate the transmit power weights as [27]:
ωj= Nt ρ
j−1
∑Nt
j=1ρj−1
for j=1, . . . ,Nt. (32)
When the TXs are arranged in ascending order of their weights,ρis the ratio of the smaller to the 157
bigger weights assigned to a pair of consecutive TXs. The higher the value ofρ, the bigger the 158
relative difference in the transmit power weights assigned to each TX. The value ofρthat is applied is 159
dependent on the severity of the channel gain similarity as well as the received SNR of the transmitted 160
digital signal modulation. As an example, forNt=4 by settingρ=1,ρ=0.5 andρ=0.25, we obtain the 161
weights as {ωj}Nj=t1= [1, 1, 1, 1], {ωj}Nj=t1= [2.13, 1.07, 0.53, 0.27] and{ωj}Nj=t1= [3.01, 0.75, 0.19, 0.05] 162
respectively. Considering the case ofρ=0.5, Figure4shows that under weak AT (σl2≤0.5), by using 163
unequal weights, a reduction in the SNR requirement is achieved compared to using equal weights. 164
However, since the total transmit power is kept constant, by applying the PA technique, the SNR 165
values of signals with the smaller weights are further reduced in addition to the attenuation caused 166
by AT. This effect can be seen in the performance deterioration observed forσl2>0.5 in Figure4. The 167
unequal PA technique is largely effective when the channel coefficients are less distinct, as in weak 168
by considering the impact of PA technique on the detection of transmitter index and the transmitted 170
digital signal modulation. 171
The SPPM scheme, as for OSM techniques in general, utilize multiple optical sources at the 172
transmitter to convey additional information bits, thereby providing increased throughput. Therefore, 173
to achieve diversity gain, particularly in the dynamic FSO channels, multiple PDs can be employed 174
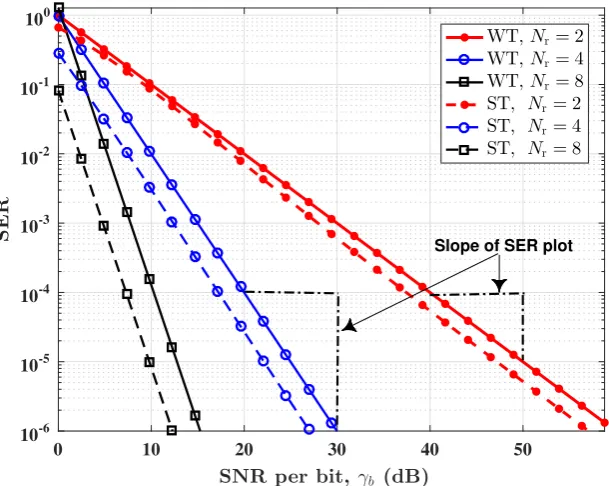
at the receiver. Considering an SPPM configuration withNt=4 andL=8, the plots of SER against 175
γbwith multiple PD, under weak and strong AT conditions, are provided in Figure5. As observed 176
in the Figure5, as the number of PDs increases, the SNR required to attain a specified SER reduces 177
across all the turbulence regimes. For example, under strong AT conditions, the SNR required to attain 178
an SER of 10−5is reduced by a factor of about 24 dB (from 46 dB to 22 dB) when number of PDs is 179
increased from 2 to 4. In fact, the diversity order, obtained from the asymptotic slope of the SER curve 180
(in log-log scale) in the high SNR regime [28], isdo=Nr/2, under all AT conditions. For instance, 181
in Figure5, under weak AT conditions, forNr=2, the SER at SNR of 40 dB and 50 dB is 10−4and 182
10−5respectively. Thus,do=−log(10−5/10−4)/log(105/104) =1. Also, forNr=4, the SER at SNR 183
of 20 dB and 30 dB is 10−4and 10−6respectively, anddo=−log(10−6/10−4)/log(103/102) =2. Note
184
that in computing the values ofdo, the SNR values have been converted from the decibel scale to the
185
linear scale. Similar results can be obtained from the other error performance plots in Figure5. Using 186
multiple PDs improves the robustness of the SPPM system to turbulence-induced channel fading. 187
0 10 20 30 40 50
SNR per bit, γb (dB)
10-6 10-5 10-4 10-3 10-2 10-1 100
S
E
R
WT,Nr= 2
WT,Nr= 4
WT,Nr= 8
ST, Nr= 2
ST, Nr= 4
ST, Nr= 8
Slope of SER plot
Figure 5.SNR required to achieve SER=10−5, using varying number of PDs. SPPM configuration:
Nt=4,L=8.
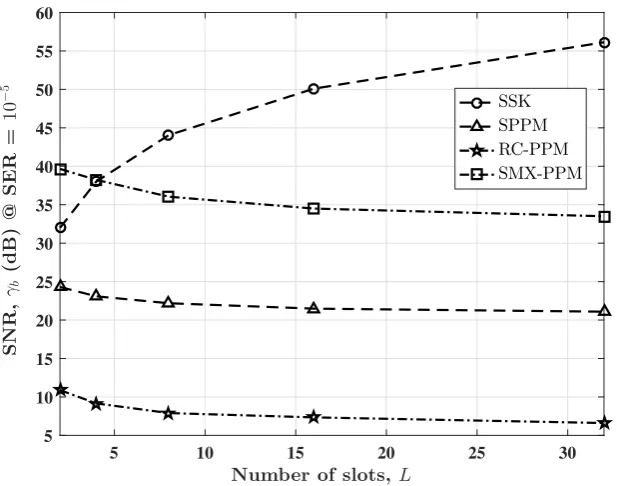
The performance comparison of SPPM with other MIMO schemes in terms of energy and spectral 188
efficiencies is illustrated in Figure7and Figure6respectively. The SPPM is compared with SSK, 189
repetition coded PPM (RC-PPM) and spatial multiplexed PPM (SMX-PPM) schemes. For an energy 190
efficiency comparison, we estimate the SNR required to achieve an SER of 10−5. We considerNt=4, 191
and the same average transmitted optical power is used for all techniques. Figure6shows that the 192
maximum spectral efficiency,ηspec, of SPPM (usingL=2) exceeds that of RC-PPM by 1 bits/s/Hz. The 193
value ofηspecis higher for SSK compared to SPPM because the pulse duration in SSK isLtimes longer 194
than that of SPPM, though SPPM transmits more bits/symbol. As expected, due to the multiplexing 195
gains of SMX-PPM, itsηspecis higher than that of SPPM. However, as shown in Figure7, the SPPM 196
SPPM, only one TX is activated in a given symbol duration, whereas, for SMX-PPM all the TXs are 198
activated concurrently and their emitted intensities are divided by a factor ofNtin order to achieve 199
equal average transmitted optical power. Moreover, the single-transmitter activation in SPPM prevents 200
interchannel interference which reduces the complexity of the detection algorithms. Compared to SSK, 201
the SPPM schemes achieves up 35 dB savings in SNR due to use of PPM which gives a shorter pulse 202
duration. AsLincreases, the energy saving by SPPM, in terms of SNR, increases. This highlights how 203
the power efficiency benefits of PPM is harnessed in SPPM. 204
5 10 15 20 25 30
Number of time slots,L
0 0.5 1 1.5 2
S
p
ec
tr
al
E
ffi
ci
en
cy
,
ηsp
ec
(b
it
/
s/Hz
)
SSK SPPM RC-PPM SMX-PPM
Figure 6. Spectral efficiency comparison of SPPM with SSK, RC-PPM and SMX-PPM for different values ofL, usingNt=4, and under strong AT condition.
5 10 15 20 25 30
Number of slots, L
5 10 15 20 25 30 35 40 45 50 55 60
S
N
R
,
γ
b
(d
B
)
@
S
E
R
=
1
0
−
5
SSK
SPPM
RC-PPM
SMX-PPM
5. Conclusion 205
The theoretical upper bound on the asymptotic SER for SPPM based FSO system has been 206
presented in different atmospheric turbulence regimes from weak to strong. The turbulence-induced 207
fading in the FSO channel is modelled by the widely adopted Gamma-Gamma distribution. Our 208
analytical framework provides a closed-form expression for the SER, and it can be extended to explore 209
the performance of other OSM schemes in FSO channels. As the AT strength increases from weak 210
to strong, the channel fading coefficients become more dispersed and differentiable. Thus, a better 211
error performance is observed under moderate-to-strong AT compared to weak AT. The performance 212
in weak AT can however be improved by applying unequal transmit power allocation to make the 213
FSO links more identifiable at the receiver. Spatial diversity has been considered at the receiver to 214
mitigate irradiance fluctuation and improve the robustness of the SPPM-FSO system to channel fading. 215
The diversity order is obtained as half of the number of detectors employed at the receiver. In terms 216
of energy and spectral efficiencies, the performance of SPPM is compared with conventional MIMO 217
techniques such as repetition coding and spatial multiplexing. 218
Author Contributions:“conceptualization, H.O, and W.P; formal analysis, H.O. and W.P.; investigation, H.O, J.T.,
219
and W.P; software, H.O.; writing—original draft preparation, H.O; writing—review and editing, J.T. and W.P;
220
supervision, J.T. and W.P;”
221
Funding: This work is supported by the Petroleum Technology Development Fund (PTDF) of the Federal
222
government of Nigeria.
223
Conflicts of Interest:“The authors declare no conflict of interest.”
224
References 225
1. Ghassemlooy, Z.; Popoola, W.; Rajbhandari, S. Optical Wireless Communications: System and Channel 226
Modelling with MatlabR; CRC Press, 2012.
227
2. Khalighi, M.A.; Uysal, M. Survey on Free Space Optical Communication: A Communication Theory
228
Perspective.IEEE Communications Surveys & Tutorials2014,16, 2231–2258.
229
3. Gappmair, W.; Hranilovic, S.; Leitgeb, E. Performance of PPM on Terrestrial FSO Links with Turbulence
230
and Pointing Errors.IEEE Communications Letters2010,14.
231
4. Bayaki, E.; Schober, R.; Mallik, R.K. Performance Analysis of MIMO Free-space Optical Systems in
232
Gamma-Gamma Fading.IEEE Transactions on Communications2009,57, 3415–3424.
233
5. Popoola, W.O.; Ghassemlooy, Z. BPSK Subcarrier Intensity Modulated Free-space Optical Communications
234
in Atmospheric Turbulence.Journal of Lightwave technology2009,27, 967–973.
235
6. Bhatnagar, M.R.; Ghassemlooy, Z. Performance Analysis of Gamma–gamma Fading FSO MIMO Links
236
With Pointing Errors. Journal of Lightwave Technology2016,34, 2158–2169.
237
7. Song, X.; Cheng, J. Subcarrier Intensity Modulated MIMO Optical Communications in Atmospheric
238
Turbulence.Journal of Optical Communications and Networking2013,5, 1001–1009.
239
8. Mesleh, R.Y.; Haas, H.; Sinanovic, S.; Ahn, C.W.; Yun, S. Spatial Modulation.IEEE Transactions on Vehicular 240
Technology2008,57, 2228–2241.
241
9. Mesleh, R.; Elgala, H.; Haas, H. Optical Spatial Modulation.IEEE/OSA Journal of Optical Communications 242
and Networking2011,3, 234–244. doi:10.1364/JOCN.3.000234.
243
10. Jaiswal, A.; Bhatnagar, M.R.; Jain, V.K. Performance Evaluation of Space Shift Keying in Free-space Optical
244
Communication. IEEE/OSA Journal of Optical Communications and Networking2017,9, 149–160.
245
11. Abaza, M.; Mesleh, R.; Mansour, A.; others. Performance Analysis of Space-Shift Keying over
246
Negative-Exponential and Log-normal FSO Channels. Chinese Optics Letters2015,13, 051001–051001.
247
12. Jaiswal, A.; Bhatnagar, M.R.; Jain, V.K. BER Analysis of Optical Space Shift Keying in Atmospheric
248
Turbulence Environment. Communication Systems, Networks and Digital Signal Processing (CSNDSP),
249
2016 10th International Symposium on. IEEE, 2016, pp. 1–6.
250
13. Özbilgin, T.; Koca, M. Optical Spatial Modulation Over Atmospheric Turbulence Channels. Journal of 251
Lightwave Technology2015,33, 2313–2323.
14. Peppas, K.P.; Mathiopoulos, P.T. Free-Space Optical Communication With Spatial Modulation and Coherent
253
Detection Over H-K Atmospheric Turbulence Channels. Journal of Lightwave Technology2015,33, 4221–4232.
254
15. Jaiswal, A.; Bhatnagar, M.R.; Jain, V.K. Performance of Optical Space Shift Keying Over Gamma–Gamma
255
Fading With Pointing Error. IEEE Photonics Journal2017,9, 1–16.
256
16. Odeyemi, K.O.; Owolawi, P.A.; Srivastava, V.M. Optical Spatial Modulation over Gamma–Gamma
257
Turbulence and Pointing Error Induced Fading Channels. Optik-International Journal for Light and Electron 258
Optics2017,147, 214–223.
259
17. Popoola, W.O.; Poves, E.; Haas, H. Spatial Pulse Position Modulation for Optical Communications. Journal 260
of Lightwave Technology2012,30, 2948–2954.
261
18. Andrews, L.C.; Phillips, R.L.Laser Beam Propagation Through Random Media; Vol. 152, SPIE press Bellingham,
262
WA, 2005.
263
19. Kahn, J.M.; Barry, J.R. Wireless Infrared Communications.Proceedings of the IEEE1997,85, 265–298.
264
20. Andrews, L.C.; Phillips, R.L.; Hopen, C.Y. Laser Beam Scintillation with Applications; Vol. 99, SPIE press,
265
2001.
266
21. Prudnikov, A.P.; Brychkov, Y.A.; Marichev, O.I.Integrals and Series, Volume 3: More special functions; Gordon
267
and Breach, 1990.
268
22. Osche, G.R.Optical Detection Theory for Laser Applications; Wiley Hoboken, NJ, 2002.
269
23. Ng, E.W.; Geller, M. A Table of Integrals of the Error Function. J. Research Natl. Bureau of Standards1968,
270
73B, 149–163.
271
24. Proakis, J.; Salehi, M.Digital Communications, 5 ed.; McGraw-Hill, 2008.
272
25. Chiani, M.; Dardari, D.; Simon, M.K. New Exponential Bounds and Approximations for the Computation
273
of Error Probability in Fading Channels. IEEE Transactions on Wireless Communications2003,2, 840–845.
274
26. Zhang, X.; Dimitrov, S.; Sinanovic, S.; Haas, H. Optimal Power Allocation in Spatial Modulation OFDM for
275
Visible Light Communications. Vehicular Technology Conference (VTC Spring), 2012 IEEE 75th. IEEE,
276
2012, pp. 1–5.
277
27. Fath, T.; Haas, H. Performance Comparison of MIMO techniques for Optical Wireless Communications in
278
Indoor Environments. IEEE Transactions on Communications2013,61, 733–742.
279
28. Lozano, A.; Jindal, N. Transmit Diversity vs. Spatial Multiplexing in Modern MIMO Systems. IEEE 280
Transactions on Wireless Communications2010,9.
![Table 1. Atmospheric turbulence parameters [1].](https://thumb-us.123doks.com/thumbv2/123dok_us/8034411.1337169/4.595.217.381.186.242/table-atmospheric-turbulence-parameters.webp)
![Figure 2. Error performance of SPPM in weak and strong AT conditions. Nt =2, Nr =4 and L=[2, 8].ST: Strong AT and WT: Weak AT.](https://thumb-us.123doks.com/thumbv2/123dok_us/8034411.1337169/9.595.143.452.383.616/figure-error-performance-sppm-strong-conditions-strong-weak.webp)