IJEDR1503123
International Journal of Engineering Development and Research (www.ijedr.org)1
Image Processing for Oil Spill Detection and its
Classification using Neural Networks
1Amarpal Singh Walia, 2Rekha Garg, 3Preetinder Kaur 1M.Tech, ECE Department, GGSCMT, Kharar, Punjab, India 2Assistant Professor, ECE Department, GGSCMT, Kharar, Punjab, India 3Assistant Professor, CSE Department, BBSBEC, Fatehgarh Sahib, Punjab, India
________________________________________________________________________________________________________ Abstract -Oil Spills in ocean is an increasing threat to our ecosystem. Oil Spills happen due to either leakage of oil from ships due to accidents or due to illegal release of oil in the sea by some big companies. In both cases detecting oil spill is an important because oil spills causes environmental problems and endanger the marine life. Many fishes and marine birds die due to oil spill every year. With advent of computing technology and advanced image processing techniques, automatic detection of oil spills using SAR images has become an important area of research. The many challenges in accurately classifying an oil spill from that of look-alikes are a major area of research interest. In this thesis, we have proposed a method for detecting oil spills from that of look-alikes with very high accuracy is proposed. The proposed work has implemented various image processing techniques like thresholding and image segmentation to extract oil spill from the background, and then implemented a pattern recognition system using Artificial neural network which uses a set of features extracted from SAR image of oil spill or look alike and is trained to classify oil spill more accurately than that of look-alikes.
Index Terms -Synthetic aperture radar (SAR), Oil spill detection, marine pollution, feature extraction, image segmentation, Artificial neural network (ANN).
________________________________________________________________________________________________________
I.INTRODUCTION
Oil spill is one of the worrisome causes of marine pollution. There are many adverse effects of oil spill that can be environmental, economical etc. The aquatic animals are the one most affected by the oil spills. In most cases, the layers of oil on the water surface simply choke the animals to death. Others that live face a number of other problems. The oil finds its way into the fur and plumage of the animals. As a result, both birds and mammals find it harder to float in the water or regulate their body temperatures. Economic loss results in case of oil spills due to accidents and also in the process of cleaning the oil spill, which is indeed a very difficult task.
Synthetic-aperture radar (SAR) is radar used to create images of objects, such as landscapes which can be either 2-D or 3-D representations of the object. SAR uses the motion of the radar antenna over a targeted region to provide finer spatial resolution than is possible with conventional beam-scanning radars. Processing of successive radar echoes is used to create SAR images by using Synthetic antenna aperture and thus allowing higher resolution images than possible with a physical antenna. Image processing techniques on these SAR images can be very much helpful in detecting these oil spills and thus enabling cleaning or treatment of affected parts of the water bodies.
The most prominent cause of problem in research of oil spill detection is to differentiate oil spills from look-alikes. Various weather or oceanographic phenomena can produce in the images same patterns like oil spills. These are called look-alikes and they make the detection of oil spills difficult. In this paper a method for oil spill detection using various image processing techniques and artificial neural network is proposed. The method is capable of differentiating oil spills and lookalike with a good accuracy rate using a learning ANN.
II.RELATED WORK
In the paper entitled “Oil Spills detection in SAR images using mathematical morphology”, a new method for marine oil spills detection is presented. It is shown that morphological images analysis techniques are powerful tools to extract accurately dark spots in SAR images, which are candidates to be oil spills. The main goal is that this segmentation can be carried out with no prior knowledge about ocean conditions during the image acquisition process. Moreover, these techniques can also be useful to extract some features used in the decision process of the candidates. Due to the homogeneity of the proposed algorithm it is suitable to be implemented in a quite efficient way. This work is focused to detect oil spills produced for cleaning the tanks of the oil tankers. An accurate extraction of possible oil slicks is performed. Although the algorithm requires more steps than classical approaches, the computational load is low [1].
IJEDR1503123
International Journal of Engineering Development and Research (www.ijedr.org)2
performance of the system is tested using oil spill SAR images. The system restores images corrupted with speckle noises of different levels. High impulse noise is effectively eliminated without significant loss in the sharpness of the image features [2].In the paper entitled “Detection of Oil Spills and Underwater Natural Oil Outflow Using Multispectral Satellite Imagery”, the capabilities of multispectral remote sensing images on detecting oil spills and underwater natural oil outflows in oil potential areas are demonstrated. An object based method for oil spill detection using high or very high multispectral images has been developed. The method exploits the knowledge provided by the systematic photo‐interpretation of the temporal, spectral and spatial features of the high or very high resolution multispectral datasets. The developed method has been proved to work well in very high resolution satellite images such as IKONOS, QuickBird, RapidEye, and WorldView2, as well as high resolution satellite images (Landsat TM). When repeatedly applied on sequential multispectral imagery, the developed method can reveal potential natural underwater oil outflows. Research showed that the systematic application of the developed oil spill detection method on a sequence of high and very high resolution multispectral images can reveal natural oil outflows on the seawater surface [3].
K. Topouzelis presented another approach of NN use in oil spill detection. The Radial Basis Function (RBF) neural network is investigated in order to be compared with the Multilayer Perceptron. For both networks, several topologies are examined and their performance is evaluated. MLPs appear to be superior to RBFs in detecting oil spills on SAR images. The method was tested on SAR image windows, containing oil spills and lookalikes. RBF networks work faster than LMP. RBF almost guarantee convergence while MLP sometimes stick in local minima. The use of a hybrid algorithm of back propagation and conjugate gradient seems to solve this problem. Moreover, MLP has smaller memory requirements for the classification and has better generalization than the RBF [4].
The paper titled “Feature extraction and classification of oil spills In SAR imagery” discusses about the different feature extraction and classification method for oil spill detection and their preliminary results. SAR is the most promising sensor for oil spill detection, as they are not affected by weather conditions. A hybrid method is applied to enhance the image quality. A fusion technique of GMAC with FCM with thresholding is used to detect the dark spots. The features of dark area are extracted. Then they are classified either as oil spill or lookalike. To improve the accuracies more number of features can be considered. The comparison of different classification methods is desirable with same set of data and features [5].
Li Zhang presented a paper in which an automated method is proposed to segment and quantify the volume of cystoid macular edema (CME) for the abnormal retina with macular hole (MH) in 3D OCT images. The proposed framework consists of three parts: (1) preprocessing, which includes denoising, intraretinal layers segmentation and flattening, MH and vessel silhouettes exclusion; (2) coarse segmentation, in which an AdaBoost classifier is used to get the seeds and constrained regions for Graph Cut; (3) fine segmentation, in which a graph cut algorithm is used to get the refine segmentation result. The proposed method was evaluated in 3D OCT images from 18 typical patients with CMEs and MH. The true positive volume fraction (TPVF), false positive volume fraction (FPVF) and accuracy rate (ACC) for CME volume segmentation are 84.6%, 1.7% and 99.7%, respectively [6].
In a paper presented on image segmentation, De Oliveira has described that inn a first stage a cancer promotes an intense process of vascularization at the affected area increasing blood flow and modifying the local temperature of the body. Using a thermal camera, the infrared radiation emitted by the human body can be captured and then used in the measuring of body temperature, turning the results into an image. Moreover, thermography can detect suspicious regions in patients of any age, even in cases of dense breasts, where the detection of an abnormality cannot be accomplished by others exams. A fundamental step in the use of thermal images is the development of computer aided diagnosis (CAD) systems. These could allow the execution of exams by technicians, following well established routines and protocols, as already occurs in mammography exams, allowing doctors to have a greater possibility of dedication in the analysis and in the meaning of the exams. In this work, an automat ic detection of the regions of interest (ROI) is proposed and compared with segmentations performed manually. This work presents a methodology for the automatic segmentation of lateral breast thermal images. For the evaluation of the results, different groups of ground truth are generated, which are available on the internet, in order to allow the verification of the results' correctness. Finally, the obtained results by the proposed methodology for the 328 images used in this work are demonstrated. The results showed average values of accuracy [7].
Tachioka, Y suggested that a recurrent neural network language model (RNN-LM) can use a long word context more than can an n-gram language model, and its effective has recently been shown in its accomplishment of automatic speech recognition (ASR) tasks. However, the training criteria of RNN-LM are based on cross entropy (CE) between predicted and reference words. In addition, unlike the discriminative training of acoustic models and discriminative language models (DLM), these criteria do not explicitly consider discriminative criteria calculated from ASR hypotheses and references. This paper proposes a discriminative training method for RNN-LM by additionally considering a discriminative criterion to CE. We use the log-likelihood ratio of the ASR hypotheses and references as a discriminative criterion. The proposed training criterion emphasizes the effect of improperly recognized words relatively compared to the effect of correct words, which are discounted in training. Experiments on a large vocabulary continuous speech recognition task show that our proposed method improves the RNN-LM baseline. In addition, combining the proposed discriminative RNN-LM and DLM further shows its effectiveness [8].
IJEDR1503123
International Journal of Engineering Development and Research (www.ijedr.org)3
sensors to detect oil spills over the sea surface is well known and proven. The possibility of using space radar imagery for long term monitoring of operational oil pollution at basin scale has also been demonstrated [9].III.METHODOLOGY
In the current methodology of oil spill detection, few steps are done in a sequence to completely make the experiment and formulate the findings. Different SAR images are acquired and then each image is applied few image segmentation steps like image histogram equalization, image thresholding, cleaning the binary image to extract a blob. This blob is the region of interest that will be used in our work. Many features of this region of interest are collected to make the final feature set. Using a whole set of images, a feature dataset with pre-labeled class information was formed. This information or feature matrix is then divided into two sets, a training set and a testing set. The training set was then used to train the designed neural network. The test set was used to test the trained network to plot the overall result. The methodology block diagram is shown in Fig.1.
Figure 1: Methodology Block Diagram Step-1: Image Processing and Image Segmentation
Image Segmentation is the primary step to extract the region of interest (ROI) from the image. There are different methods for image segmentation which can be used to extract the region of interest from an image. In our case, we have followed a method which is modified version of adaptive thresholding. We performed a few steps in sequence to extract the ROI from a SAR image. Histogram Equalization
When an image is loaded, the first step performed on it is histogram equalization. Histogram equalization is an important step to balance the overall pixel gray scale distribution. With histogram equalization, the overall pixel distribution from pitch black (0) to white (255) is equalized. This helped a lot in the next step to decide the primary and secondary thresholding levels.
Figure 2: An image of a Lookalike sample Primary Thresholding
IJEDR1503123
International Journal of Engineering Development and Research (www.ijedr.org)4
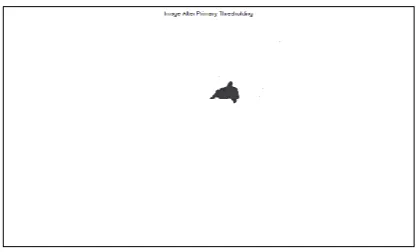
Figure 3: Image after Primary ThresholdingFigure 4: Inverted Image after Primary Thresholding (It’s not binary) Secondary Thresholding
Secondary thresholding is done on complemented image to extract exactly two regions, background and spot. The image is a binary image and has white spot and some noise and black background represented in binary form as 0 for black and 1 for white and is shown in Fig.5.
Figure 5: The Binary Image with lots of small white spots can be seen Erosion
Erosion is a morphological operation. It is performed to remove all those small noises that the image has, which makes the spot stand out and leave only white region of interest in whole binary image.
Contour Fill
IJEDR1503123
International Journal of Engineering Development and Research (www.ijedr.org)5
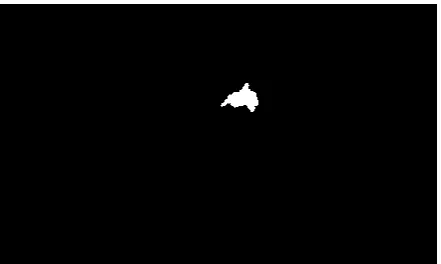
Figure 6: Isolated Spot from the image after performing morphological fill operation and erosion operation. Step-2: Image Feature ExtractionThere are different features that were extracted in order to form a dataset of the image which can be used to train our neural network. The features that were extracted from the binary image can be divided into four categories.
Shape Features: 1. Area: ROI
Area is simply the total number of pixels in a given region, in our case, the extracted spot. 𝐴𝑟𝑒𝑎 = ∑ ∑ 𝑟𝑜𝑖_𝑥(𝑖, 𝑗)
𝑚
𝑗=0 𝑛
𝑖=0 2. Perimeter: ROI
Perimeter is the length of the closed contour of the spot. It is calculated by summation and has a unit of pixel. 𝑃𝑒𝑟𝑖𝑚𝑒𝑡𝑒𝑟 = ∑ ∑ 𝑏𝑜𝑢𝑛𝑑𝑎𝑟𝑦(𝑟𝑜𝑖_𝑥)(𝑖, 𝑗)
𝑚
𝑗=0 𝑛
𝑖=0 3. Shape Complexity: ROI
Shape complexity parameter of a shape or geometry is a measure of how complex a shape is. It is like how many simple geometry it has to form the shape. All real world objects have a complex shape, so a high value of complexity.
𝑆ℎ𝑎𝑝𝑒 𝐶𝑜𝑚𝑝𝑙𝑒𝑥𝑖𝑡𝑦 = 𝑃𝑒𝑟𝑖𝑚𝑒𝑡𝑒𝑟
2 × √𝜋 × 𝐴𝑟𝑒𝑎 Backscatter Features:
4. Mean: ROI
Average Region of Interest is simply the mean pixel value of that region. It is a gray scale value parameter and it defines the average gray scale level of the region of interest.
𝑀𝑒𝑎𝑛 𝑅𝑂𝐼 = ∑
∑𝑚𝑗=0𝑟𝑜𝑖_𝑥(𝑖,𝑗)
𝑚 𝑛
𝑖=0 𝑛 5. Mean: Non-ROI
Mean Non-ROI is again the mean gray scale level of the background.
𝑀𝑒𝑎𝑛 𝑁𝑜𝑛𝑅𝑂𝐼 = ∑
∑𝑚𝑗=0𝑛𝑜𝑛_𝑟𝑜𝑖_𝑥(𝑖,𝑗)
𝑚 𝑛
𝑖=0 𝑛 6. Standard Deviation: ROI
This parameter defines the standard deviation of the gray scale level from its mean value.
𝑆𝑡𝑎𝑛𝑑𝑎𝑟𝑑 𝐷𝑒𝑣. 𝑅𝑂𝐼 = √∑
∑𝑚 (𝑀𝑒𝑎𝑛 𝑅𝑂𝐼−𝑟𝑜𝑖𝑥(𝑖,𝑗))2 𝑗=0
𝑚 𝑛
𝑖=0
𝑛 7. Standard Deviation: Non-ROI
This parameter defines the standard deviation of the gray scale level from its mean value.
𝑆𝑡𝑎𝑛𝑑𝑎𝑟𝑑 𝐷𝑒𝑣. 𝑁𝑜𝑛𝑅𝑂𝐼 = √∑
∑𝑚 (𝑀𝑒𝑎𝑛 𝑁𝑜𝑛𝑅𝑂𝐼−𝑛𝑜𝑛_𝑟𝑜𝑖𝑥(𝑖,𝑗))2 𝑗=0
𝑚 𝑛
𝑖=0
𝑛 8. Power to Mean Ratio: ROI
𝑃𝑜𝑤𝑒𝑟 𝑡𝑜 𝑀𝑒𝑎𝑛 𝑅𝑎𝑡𝑖𝑜 𝑅𝑂𝐼 = 𝑆𝑡𝑎𝑛𝑑𝑎𝑟𝑑 𝐷𝑒𝑣. 𝑅𝑂𝐼
𝑀𝑒𝑎𝑛 𝑅𝑂𝐼 9. Power to Mean Ratio: Non-ROI
𝑃𝑜𝑤𝑒𝑟 𝑡𝑜 𝑀𝑒𝑎𝑛 𝑅𝑎𝑡𝑖𝑜 𝑁𝑜𝑛𝑅𝑂𝐼 = 𝑆𝑡𝑎𝑛𝑑𝑎𝑟𝑑 𝐷𝑒𝑣. 𝑁𝑜𝑛𝑅𝑂𝐼
IJEDR1503123
International Journal of Engineering Development and Research (www.ijedr.org)6
Gradient Features:10. Gradient Mean: ROI
𝐺𝑟𝑎𝑑. 𝑀𝑒𝑎𝑛 = ∑
∑mj=0(∇ val_roi(i,j))
m n
i=0 n 11. Gradient Standard Deviation: ROI
𝐺𝑟𝑎𝑑. 𝑆𝑡𝑎𝑛𝑑𝑎𝑟𝑑 𝐷𝑒𝑣 = √∑
∑m (Grad.Mean− ∇ val_roi(i,j))2 j=0
m n
i=0
n 12. Gradient Maxima: ROI
𝐺𝑟𝑎𝑑. 𝑀𝑎𝑥𝑖𝑚𝑎 = max ((∇ 𝑣𝑎𝑙_𝑟𝑜𝑖)) 13. Gradient Minima: ROI
𝐺𝑟𝑎𝑑. 𝑀𝑖𝑛𝑖𝑚𝑎 = min ((∇ 𝑣𝑎𝑙_𝑟𝑜𝑖)) 14. Gradient Power to Mean Ratio: ROI
𝐺𝑟𝑎𝑑. 𝑃𝑜𝑤𝑒𝑟 𝑡𝑜 𝑀𝑒𝑎𝑛 𝑅𝑎𝑡𝑖𝑜 = 𝐺𝑟𝑎𝑑. 𝑆𝑡𝑎𝑛𝑑𝑎𝑟𝑑 𝐷𝑒𝑣
𝐺𝑟𝑎𝑑. 𝑀𝑒𝑎𝑛 Geometry Features:
15. Convex Area: ROI
𝐶𝑜𝑛𝑣𝑒𝑥 𝐴𝑟𝑒𝑎 = 𝑑𝑥 × 𝑑𝑦 16. Normalized Area: ROI
𝑁𝑜𝑟𝑚. 𝐴𝑟𝑒𝑎 = 𝐴𝑟𝑒𝑎
𝐶𝑜𝑛𝑣𝑒𝑥 𝐴𝑟𝑒𝑎 17. Aspect Ratio: ROI
𝐴𝑠𝑝𝑒𝑐𝑡 𝑅𝑎𝑡𝑖𝑜 = 𝑑𝑚𝑖𝑛
𝑑𝑚𝑎𝑥 18. Circularity: ROI
𝐶𝑖𝑟𝑐𝑢𝑙𝑎𝑟𝑖𝑡𝑦 = 4 × 𝜋 × 𝐴𝑟𝑒𝑎
𝑃𝑒𝑟𝑖𝑚𝑒𝑡𝑒𝑟2
19. Convex Perimeter: ROI
𝐶𝑜𝑛𝑣𝑒𝑥 𝑃𝑒𝑟𝑖𝑚𝑒𝑡𝑒𝑟 = 2 × (𝑑𝑥 + 𝑑𝑦) 20. Waviness: ROI
𝑊𝑎𝑣𝑖𝑛𝑒𝑠𝑠 = 𝐶𝑜𝑛𝑣𝑒𝑥 𝑃𝑒𝑟𝑖𝑚𝑒𝑡𝑒𝑟
𝑃𝑒𝑟𝑖𝑚𝑒𝑡𝑒𝑟 21. Contrast: ROI
𝐶𝑜𝑛𝑡𝑟𝑎𝑠𝑡 = 𝑀𝑒𝑎𝑛 𝑁𝑜𝑛𝑅𝑂𝐼 − 𝑀𝑒𝑎𝑛 𝑅𝑂𝐼
These features extracted from the images composed a feature set. Step-3: Training ANN
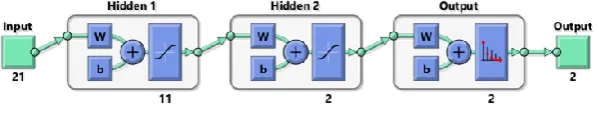
The images are then divided into training and testing set. The training set is then passed to an artificial neural network for training the network .We have simulated the whole system in MATLAB using its Neural Network Toolbox. The network we created for the experiment has two hidden layers with 11 nodes and 2 nodes for 1st and 2nd hidden layer, respectively as shown in Fig.7. The input layer has 21 nodes as we have extracted 21 features from our image dataset.
Figure 7: The neural network schema for our experiment
The Artificial Neutral is a feed forward network. We used a training function called Scaled Conjugate Gradient for training of the network.
Scaled Conjugate Gradient
IJEDR1503123
International Journal of Engineering Development and Research (www.ijedr.org)7
fully automated including no user dependent parameters and avoids a time consuming line-search, which CBG and BFGS use in each iteration in order to determine an appropriate step size [12].After the training step is performed, the network is ready to be tested with the testing data set. The tests were performed and the results were analyzed and summarized.
IV.RESULTS AND DISCUSSIONS
Image Segmentation and Feature Extraction
As experiment we performed to automatically detect oil-spills required SAR images, so we collected 30 images from multiple sources to build our dataset. We then performed image processing and image segmentation techniques which includes Histogram Equalization, Primary Thresholding, Image Complement and Secondary Thresholding to extract the oil-spill or look-alike spot from the image. Further morphological techniques like Erosion and Contour Fill were used to remove small pixels and a thick spot was extracted as a result. After the extraction of spot, we calculated different features like area, moment, aspect ratio etc. of the given spot. This led to a feature set of 21 features. These features were used by an artificial neural network for training and classification of an image as oil-spill or lookalike.
Artificial Neural Network – Training Stage
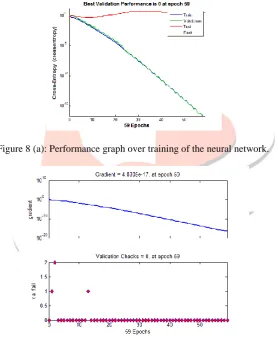
We divided the available dataset of images into training and testing sets. Training dataset consisted of 12 images. During the training state the gradient and validation values are plotted in Fig.8 (a) and Fig.8 (b) respectively.
Figure 8 (a): Performance graph over training of the neural network.
Figure 8 (b): Training State of the neural network Artificial Neural Network Testing Stage
IJEDR1503123
International Journal of Engineering Development and Research (www.ijedr.org)8
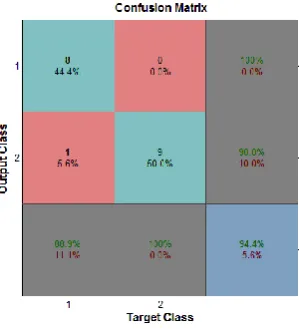
Figure 9: The confusion matrix of the testing (Generated by MATLAB)Table 1 represents the performance level of our proposed methodology in form of an error matrix. It was possible to achieve an overall accuracy rate of 94.4% using a test set of 18 SAR images with 17 true classifications and 1 false classification.
Table 1 Performance Error Matrix
Actual Oil Spill Actual Look-alike
Predicted Oil Spill 8 0
Predicted Look-alike 1 9
V.CONCLUSION
We have studied oil-spill detection as an important field for environment protection. We have studied that oil-spill detection is very necessary for protecting marine life which is affected adversely due to these oil-spills which can be cause by natural incidents like accidents or sometimes oil is released in the sea by many companies illegally. We have studied the current development in automatic oil-spill detection using artificial neural networks. We then developed an improved oil-spill detection system with high accuracy of 94.4%. The system used artificial neural network as pattern recognizer and classifier.
The future scope of this work is to test with other configurations of ANN and features. We can also test the system with DNN (Deep Neural Networks) which are also known as multilayer convolution neural networks for detection and predication of high level of accuracy. The convolution neural networks learn in a very different manner and use another technique for shape, pattern and other important feature extraction and recognition. So, they can yield more ideal results.
REFERENCES
[1] Gasull A, Fábregas FX, Jiménez J, Marqués F, Moreno V, Herrero M., “Oil spills detection in SAR Images using Mathematical Morphology” , 11th European Signal Processing Conference (EUSIPCO 2002). 2002, pp.25–28.
[2] P.Alli, P.Ramasubramanian and V. Sureshkumar ,“Oil spills detection In SAR Images using Nonlinear Fuzzy Filter”, International Journal of Advanced Science and Technology Vol. 25, December, 2010, pp.7-16
[3] Kolokoussis Polychronis, Karathanassi Vassilia, “Detection of oil spills and underwater natural oil outflow using Multispectral Satellite Imagery”, International Journal of Remote Sensing Applications Volume 3 Issue 3, September 2013, pp.145-154
[4] K. Topouzelis , V. Karathanassi , P. Pavlakis , D. Rokos, “Oil spill detection using RBF neural networks and SAR data”, XXth ISPRS Congress Technical Commission Proceedings VII July 2004, pp.724
[5] Radhika Viswanathanand Padmavathi Ganapathi, “Feature extraction and classification of oil spills In SAR imagery”, IJCSI International Journal of Computer Science Issues, Vol. 8, Issue 5, No 2, September 2011 ISSN (Online): 1694-0814 , pp.244-248
IJEDR1503123
International Journal of Engineering Development and Research (www.ijedr.org)9
[7] De Oliveira, J.P.S. ; Conci, A. ; Perez, M.G. ; Andaluz, V.H., “Segmentation of infrared images: A new technology for earlydetection of breast diseases”, Industrial Technology (ICIT), 2015 IEEE International Conference, pp.1765 – 1771
[8] Tachioka, Y. ; Watanabe, S., “Discriminative method for recurrent neural network language models”, Acoustics, Speech and Signal Processing (ICASSP), 2015 IEEE International Conference, pp.5386 - 5390
[9] Konstantinos N. Topouzelis, “Oil spill detection by SAR images: Dark Formation Detection, Feature Extraction and Classification Algorithms”, Sensors2008, pp.6642-6659
[10]Ayas, S. ; Dogan, H. ; Gedikli, E. ; Ekinci, M., “Microscopic image segmentation based on firefly algorithm for detection of tuberculosis bacteria”, Signal Processing and Communications Applications Conference (SIU), 2015, pp.851 - 854
[11]Farouk, Khaled A. ; Younes, Mohammad ; Nashat Fors, M., “An Artificial Neural Network meta model for availability of systems in series with buffers under imperfect repair”, Industrial Engineering and Operations Management (IEOM), 2015 International Conference, pp.1 – 7