A Monthly Double-Blind Peer Reviewed Refereed Open Access International e-Journal - Included in the International Serial Directories
International Journal in Management and Social Science
http://www.ijmr.net.in email id- [email protected]
Page 273 CONSTRUCTION OF SINGLE SAMPLING PLAN INDEXED THROUGH LIMITING QUALITY LEVEL USINGTRUNCATED BINOMIAL DISTRIBUTION
S. Pratheeba1 and R. Radhakrishnan2 1
Assistant Professor 2
Associate Professor
Department of Statistics,
PSG College of Arts and Science,
Coimbatore – 641014, India.
ABSTRACT
Among the probability distributions that are used to describe the chance whose observational apparatus becomes active only when at least one event occurs is Zero Truncated Poisson Distribution (ZTPD). Shanmugam (1985) has shown that a Zero Truncated Poisson distribution (ZTPD) can be used to model such second quality lots which have the possibility of at least one defective in the sample information. In this paper the procedure for the construction of Single Sampling Plan indexed through Limiting Quality Level (LQL) using Truncated Binomial Distribution (TBD) as the base line distribution is presented and a table is also provided using Excel packages for the easy selection of the plans.
Keywords
Limiting Quality Level, Operating Characteristic Curve, Single Sampling Plan, Truncated Binomial Distribution.
Introduction
Peach and Littauer (1946) has given a table for determining the single sampling plan for a fixed
= 0.05. Burguess (1948) provided graphical method to obtain single sampling plan for a specified (p1, 1-
) and (p2, β). Grubs (1949) have given a table, which can be used for selecting asingle sampling plan at AQL (Average Quality Level) and LQL (Limiting Quality Level). Cameron (1952) made extension on the work of Peach and Littauer (1946).
Guenther (1969) developed a procedure for constructing a single sampling plan for a specified p1, p2 and α based on Binomial, hyper geometric and Poisson Models. Golub Abraham
A Monthly Double-Blind Peer Reviewed Refereed Open Access International e-Journal - Included in the International Serial Directories
International Journal in Management and Social Science
http://www.ijmr.net.in email id- [email protected]
Page 274Quality). Radhakrishnan (2002) continued the work of Suresh and RamKumar (1996) and constructed the various sampling plans including continuous sampling plan.
Govindaraju (1989) using a sampling plan with a given Limiting Quality Level (LQL), and the consumer’s risk of 10% or less of the production will be accepted in the long run during the periods of sampling. LQL helps one to plan the manpower requirements for 100 % inspection depending on the level of process quality maintained and the production shift. Stephens (1981) advocated the use of LQL index for consumer’s protection. Shankar and Sahu (2002) studied process control plans using AQL, LQL and Average Outgoing deterioration Limit (AODL).
In this Paper a single sampling plan is constructed by assuming the probability of acceptance of a lot as 0.10, the proportion defective corresponding to this probability of acceptance in the OC (Operating Characteristic) curve is termed as Limiting Quality Level using Truncated Binomial distribution as the base line distribution.
Conditions for Application
Production is Continuous, so that results of the past, present and future lots are broadly the indicative of a continuous process.
Lots are submitted sequentially.
Inspection is by attributes, with the lot quality is the level defined as the proportion defective.
Glossary of Symbols
p - Proportion Defective / Lot Quality
q - 1 – p
n - Sample Size
β - Consumer’s Risk
Pa (p) - Probability of acceptance of the lot quality p
Operating Characteristic Function
A Monthly Double-Blind Peer Reviewed Refereed Open Access International e-Journal - Included in the International Serial Directories
International Journal in Management and Social Science
http://www.ijmr.net.in email id- [email protected]
Page 275
1
( )
,
1, 2,... ;
(1)
1
x n x
c a n x
n
p q
x
P p
x
c
q
Construction of single sampling plan indexed through LQL
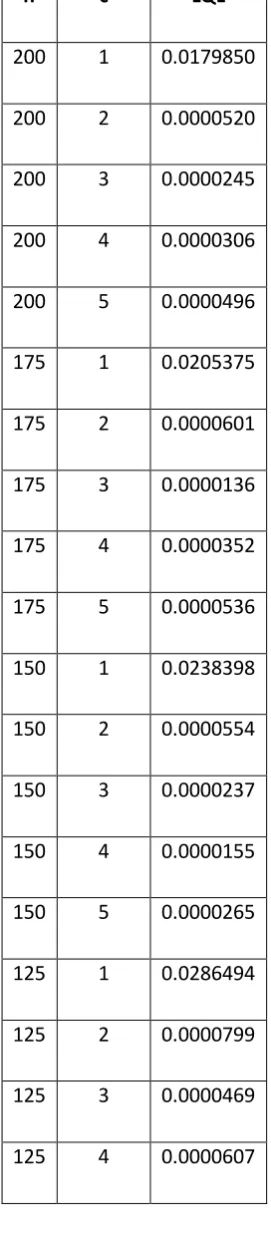
By fixing the probability of acceptance of the lot, Pa (p) as 0.10 with Truncated Binomial Distribution as the basic distribution and from equation (1), the values of the LQL are obtained for the various combinations of ‘n’ and ‘c’ using a Excel package and are presented in Table 1. The parameters of the Single sampling plan, n and c are recorded for various combinations of LQL.
Example
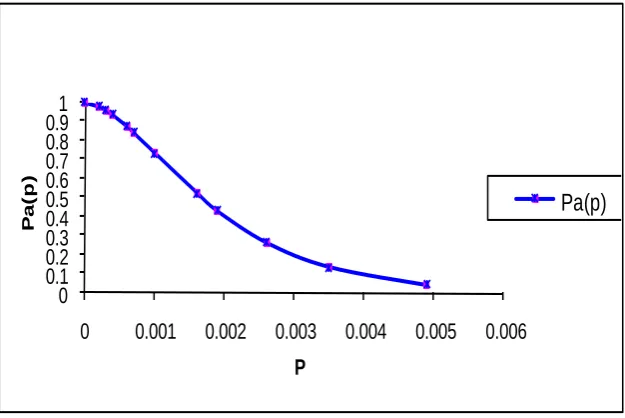
For a given LQL = 0.00003, the value of n and c are obtained from table 1 as n = 175 and c = 4. Hence the parameters of Single Sampling Plan are n = 175 and c = 4 with the specified LQL = 0.00003. The OC curve for this plan is presented in figure 1.
Practical Application
Suppose a food processing company fixes LQL as 0.00003 (3 Non – confirming units out of 100000 items) then inspect a random sample of 175 units taken from a lot of units produced in a given period (hour or day) and count the number of non – confirming units (d). If d
4, accept the lot of units processed during the period, otherwise reject the lot of units and inform themanagement for corrective action
Figure 1: OC curve for the plan n = 175 and c = 4
0 0.1 0.2 0.3 0.4 0.5 0.6 0.7 0.8 0.91
0 0.001 0.002 0.003 0.004 0.005 0.006
A Monthly Double-Blind Peer Reviewed Refereed Open Access International e-Journal - Included in the International Serial Directories
International Journal in Management and Social Science
http://www.ijmr.net.in email id- [email protected]
Page 276 ConclusionIn this paper a procedure is given for constructing a Single Sampling Plan indexed through LQL using Truncated Binomial Distribution, Truncated at x = 0 and a table is also provided for the easy selection of the plans. These plans are very useful for the companies which has at least one defective unit in their lot and also useful to the companies which are using second quality lots.
References
[1].
Burguess, A. R., 1948, “A graphical method for determining Single Sampling Plan,” Industrial Quality Control., pp.25 - 27.[2].
Cameron, J. M., 1952, “Tables for constructing and computing the Operating Characteristics of Single Sampling Plans,”Industrial Quality Control., Vol.11,pp.37 - 39.
[3].
Grubs, F. E., 1949, “On designing Single Sampling inspection plan Annals of Mathematical Statistics,” Vol. 20, pp. 42 – 256.[4].
Golub Abraham, 1953, “Designing Single Sampling Inspection Plansample size is fixed,” Journal of the American Statistician Association, Vol.48,
pp.278 - 288.
[5].
Guenther, W. C., 1969, “Use of the Binomial, Hyper geometric and Poisson tables to obtain Sampling Plans,” Journal of Quality Technology, 1(2), pp. 105 - 109.[6].
Govindaraju, K., 1989, “Procedures and Tables for the Selection of CSP – 1 Plans,” Journal of Quality Technology, Vol.21, No. 1, pp. 46 - 50.[7].
Peach, P., and Littauer, S. B., 1946, “A note on Sampling Inspection, Annals of Mathematical Statistics,” Vol.17, pp.81 - 84.[8].
Radhakrishnan, R., 2002, “Contribution to the study on selection of certain Acceptance Sampling Plans,” Ph.D. Dissertation, Bharathiar University,Coimbatore, India.
[9].
Soundararajan, V., and Govindaraju, K., 1983, “A note on Designing Sampling Plans,” IAPQR Transactions, Vol.8, No.1, pp.37 - 41.[10].
Suresh, K. K., and RamKumar, T. B., 1996, “Selection of a Sampling Plan indexed with Maximum Allowable Average Outgoing Quality,” Journal ofApplied Statistics, 23(6), pp. 645 - 654.
[11].
Shankar, G., and Sahu, A. K., 2002, “A process control plan with two-phase inspection,” Economic Quality Control, Vol.17, No.1, pp. 63 - 73.[12].
Shanmugam, R., 1985, “An intervened Poisson Distribution and its medical Applications,” Biometrics, Vol. 41, pp. 1025 - 1029.A Monthly Double-Blind Peer Reviewed Refereed Open Access International e-Journal - Included in the International Serial Directories
International Journal in Management and Social Science
http://www.ijmr.net.in email id- [email protected]
Page 277 Table 3.2: Parameters of SSP for a specified LQLn c LQL
200 1 0.0179850
200 2 0.0000520
200 3 0.0000245
200 4 0.0000306
200 5 0.0000496
175 1 0.0205375
175 2 0.0000601
175 3 0.0000136
175 4 0.0000352
175 5 0.0000536
150 1 0.0238398
150 2 0.0000554
150 3 0.0000237
150 4 0.0000155
150 5 0.0000265
125 1 0.0286494
125 2 0.0000799
125 3 0.0000469
A Monthly Double-Blind Peer Reviewed Refereed Open Access International e-Journal - Included in the International Serial Directories
International Journal in Management and Social Science
http://www.ijmr.net.in email id- [email protected]
Page 278125 5 0.0000725
100 1 0.0357459
100 2 0.0001020
100 3 0.0001510
100 4 0.0000847
100 5 0.0000873
75 1 0.0475226
75 2 0.0001440
75 3 0.0001310
75 4 0.0001440