A computer model for the simulation of nanoparticle deposition in
the alveolar structures of the human lungs
Robert Sturm
Division of Physics and Biophysics, Department of Material Science and Physics, University of Salzburg, A-5020 Salzburg, Austria
Correspondence to: Dr. Robert Sturm. Division of Physics and Biophysics, Department of Material Science and Physics, University of Salzburg, Hellbrunnerstrasse 34, A-5020 Salzburg, Austria. Email: [email protected].
Background: According to epidemiological and experimental studies, inhalation of nanoparticles is commonly believed as a main trigger for several pulmonary dysfunctions and lung diseases. Concerning the transport and deposition of such nano-scale particles in the different structures of the human lungs, some essential questions are still in need of a clarification. Therefore, main objective of the study was the simulation of nanoparticle deposition in the alveolar region of the human respiratory tract (HRT).
Methods: Respective factors describing the aerodynamic behavior of spherical and non-spherical particles in the inhaled air stream (i.e., Cunningham slip correction factors, dynamic shape factors, equivalent-volume diameters, aerodynamic diameters) were computed. Alveolar deposition of diverse nanomaterials according to several known mechanisms, among which Brownian diffusion and sedimentation play a superior role, was approximated by the use of empirical and analytical formulae. Deposition calculations were conducted with a currently developed program, termed NANODEP, which allows the variation of numerous input parameters with regard to particle geometry, lung morphometry, and aerosol inhalation.
Results: Generally, alveolar deposition of nanoparticles concerned for this study varies between 0.1% and 12.4% during sitting breathing and between 2.0% and 20.1% during heavy-exercise breathing. Prolate particles (e.g., nanotubes) exhibit a significant increase in deposition, when their aspect ratio is enhanced. In contrast, deposition of oblate particles (e.g., nanoplatelets) is remarkably declined with any reduction of the aspect ratio.
Conclusions: The study clearly demonstrates that alveolar deposition of nanoparticles represents a topic certainly being of superior interest for physicists and respiratory physicians in future.
Keywords: Nanoparticles; deposition; alveolar region; computer model; stochastic lung; human respiratory tract (HRT)
Submitted Oct 01, 2015. Accepted for publication Oct 26, 2015. doi: 10.3978/j.issn.2305-5839.2015.11.01
View this article at: http://dx.doi.org/10.3978/j.issn.2305-5839.2015.11.01
Introduction
By definition, nanoparticles are characterized by one particle dimension not exceeding 100 nm (1-3). Nanoparticles form a subcategory of ultrafine particles (UFP), which are contained in the ambient air together with particulate matter (PM) of both intermediate (≤2.5 µm) and large (≤10 µm) size. Sources of nanoparticles found in the atmosphere include incomplete combustion that takes place during industrial production processes and, even more important, in diesel engines. Carbonaceous aerosols of nano-scale size resulting from incomplete combustion
and large-scale synthesis (6-8). As found by epidemiological studies, exposure to both primary nanoparticles and secondary ones formed by agglomeration represents a serious topic in occupational hygiene, whereby particle uptake may take place by inhalation, ingestion or via dermal paths (2).
Medically speaking, nanoparticles exhibit some physical properties that make them different from other aerosol particles. Due to their small size they adopt the ability to penetrate the lung epithelium and enter the blood circulation within a rather short time span (9). The large surface area reported for nanoparticles (10) makes them highly susceptible to the adsorption of hazardous elements and substances. Finally, clearance of nanoparticles deposited in the bronchial airways and alveoli partly takes place via transepithelial routes, along which inflammatory reactions may be triggered by these particles (11,12). As outlined by Sturm (5) health effects resulting from the deposition of inhaled nanoparticles and UFP include epithelial cell damage, pulmonary edema, and fibrosis. Other clinical outcomes in association with nanomaterial exposure are an increased viscosity of the blood plasma due to enhanced sulfur dioxide and particulate levels (13) as well as a decline of peak expiratory flow in asthmatics (14). In patients suffering from cardiovascular disease, overloads of nanoparticles may cause disproportionate inflammatory response and a subsequent increase in blood coagulability (15). As found by clinical studies (16) nanoparticles play a specific role in provoking malignant transformations which finally result in the formation of lung carcinomas. Particularly soot particles being attached by carcinogens such as benzopyrenes are proven to act as potential triggers of cancer.
Due to several ethical reasons experimental deposition of nanoparticles in healthy probands has been outlined in a limited number of scientific studies hitherto (17-19). As argued by Oberdörster (20), maximal alveolar deposition rates of nanoparticles may be on the order of 50%, whereas tracheobronchial deposition may reach peak values of 35% and extrathoracic deposition peak values of 50%. In patients with chronic obstructive pulmonary disease alveolar deposition is decreased, whilst extrathoracic and tracheobronchial deposition are subject to an increase. Theoretical investigations on nanoparticle deposition in the human respiratory tract (HRT) are based on the use of a close-to-realistic lung model and latest discoveries regarding the behavior of nanoparticles in bronchial and alveolar structures (5,21-24). Most current questions
deal with nanoparticle agglomeration in the airways (25), intrapulmonary changes of particle cluster sizes due to increased hygroscopicity and an improved modeling approach to extrathoracic nanoparticle deposition.
In the study presented here, the main focus is set on the theoretical deposition of nanoparticles in the alveoli of the HRT, since this lung compartment is most susceptible for nanoparticle-induced insufficiencies. Besides the influence of inhalation flow (expressed by different breathing conditions) also the role of particle geometry and density with regard to alveolar deposition is subjected to a detailed investigation.
Methodology
Theoretical approximation of the particle shape
Due to their different sources and mechanisms of formation nanoparticles generally exhibit significant variations regarding their geometries. Besides particles with spherical or close-to-spherical shape there are also ones adopting the shapes of cylinders and platelets or disks (25-27). According to numerous experimental and theoretical studies transport of non-spherical particles within the inspired air stream may significantly differ from that performed by particles with ideal, spherical geometry. This specific circumstance is considered by the aerodynamic diameter concept, which was introduced in the 1960s (28). The aerodynamic diameter may be understood as the diameter of unit-density sphere that has exactly the same aerodynamic properties as any non-spherical particle of interest (29-31). The mathematical
formulation of this essential parameter, termed dae, is as
follows:
( )
( )
0 1 p c ve ae ve
c ae C d d d
C d
ρ χ ρ
= ⋅ ⋅ ⋅ [1]
In the equation noted above, dve represents the
volume-equivalent diameter, which corresponds to the diameter of a sphere with exactly the same volume as the non-spherical
particle of interest. Further, χ denotes the dynamic shape
factor, ρp the density of the particle, ρ0 unit-density (1 g/cm³),
Cc(dae) the Cunningham slip correction factor related to
dae, and Cc(dve) the Cunningham slip correction factor
related to dve. As already clarified in earlier contributions,
particles by a continuous sequence of collisions (32-34). For an appropriate mathematical expression of the dynamic shape factor, non-spherical particle shapes have to be subdivided into three subcategories, i.e., fibrous or prolate geometries, disk-like or oblate geometries, and shapes resulting from the agglomeration of small particulate components. Within the last category chain-shaped aggregates may be distinguished from clusters, where spherical components are combined in a more three-dimensional fashion (26,32,35).
Starting with prolate particle geometries, χ may be
defined by the formulae
(
)
(
)
2 1/3 2 2 2 8 1 32 3 ln 1
1
β β
χ
β β β β
β − ⊥ − = − + − + − [2] and
(
)
(
)
2 1/3 // 2 2 2 4 1 32 1 ln 1
1
β β
χ
β β β β
β − − = − + − − − [3]
with χ⊥, χ//, and β, respectively, denoting the dynamic shape
factor for particle orientations perpendicular and parallel to the direction of the air stream as well as the so-called aspect ratio (32). The latter parameter simply describes the ratio
of particle length to particle diameter, being>> 1 for long
fibers but << 1 for extremely thin disks.
In the case of oblate particle geometries, the following
equations are commonly used for the computation of χ (32):
(
2)
1/32
2
8 1
3
2 3 arccos 1
β β
χ
β β β
β − ⊥ − = − + − [4] and
(
2)
1/3// 2
2
4 1
3
2 1 arccos 1
β β
χ
β β β
β − − = − − − [5]
As demonstrated above, Eqs. [4] and [5] only differ
fromEqs. [2] and [3]insofar as the natural logarithm is
substituted by an arcus-cosinus function. In order to express random orientation of non-spherical particles during their transport through the cylindrical and spherical structures
of the HRT, χ⊥ and χ// are combined to χr according to the
equation (32,36)
//
1 2 1
3 3
r
χ = χ⊥+ χ [6]
In the free-molecular flow regime, the definition of Cunningham slip correction factors represents an unavoidable task. By application of these factors, particle deposition formulae originally determined for the continuum flow regime can be also applied to particles of ultrafine size (Knudsen number >10) (32-34,37). Mathematically, the Cunningham slip correction factors may be obtained from the general formula
1 2.514 0.800 exp 0.55
C d C d λ λ = + ⋅ + ⋅ − ⋅
[7]
with λ denoting the free path length of air molecules
(0.066 µm at 20 °C) and d representing one of the two
particle diameters introduced in Eq. [1].
Dynamic shape factors and aerodynamic diameters strongly depend on the geometry of the studied particles. Whilst in the case of spheres, dynamic shape factors adopt a value of 1, resulting in an equality of geometric, volume-equivalent and aerodynamic diameter, dynamic shape factors of irregularly shaped particles and aggregates commonly adopt values >1, resulting in aerodynamic diameters that are significantly smaller than the corresponding volume-equivalent diameters.
Modeling particle deposition in the human respiratory tract (HRT)
In general, calculations of nanoparticle transport and deposition were conducted by assuming a stochastic lung structure, exhibiting significant geometric variations of the bronchial tubes between two neighbouring airway generations and also within a given airway generation (38). With regard to alveolar deposition of nanoparticles Brownian diffusion and sedimentation were believed as the main deposition mechanisms exerting on the particulate substances. Inertial impaction and interception were also considered as mechanisms influencing particle transport in the tracheo-bronchial tree, but, for the sake of brevity, they will not be subjected to a detailed description in this contribution. The probability of alveolar nanoparticle
deposition (39,40), pD, by diffusive processes may be
expressed by the general formula
1 2
1 6
1 ( 1)i ( , ) ( , )
D i i
i
p i f R r g r t
π
∞ + −
=
with
2
1 1
( , ) sin cos
i i r r i r
f R r
i R R R
π π
π π
= − [9]
and
2 2 ( , ) exp
i Di t
g r t
R
π
= −
[10]
In Eqs. [8]-[10], R, r, and D, respectively, denote the radius of the alveolus, where deposition due to diffusion takes place, the radius of an inner sphere filled with inhaled, particle-loaded air, and the diffusion coefficient obtained from the Einstein-Bose-equation. As indicated by the variable r, alveolar deposition processes commonly require a model of mixing between the inhaled aerosolized air and the residual air stored in the alveoli. If no mixing of the two air volumes is assumed, the particle-loaded inhaled air enters the alveolar sphere and forms a sharply demarcated sphere (radius r) surrounded by the residual air. The intensity of any exchange processes between both air volumes chiefly depends on the residence time of the particle-loaded air in the alveoli, which is defined for large parts by the duration of breath-hold. If total air mixing is assumed, particle-loaded air and residual air fill the alveolar space in homogeneous fashion (r = R) and, thus, deposition efficiency due to diffusive processes is noticeably enhanced. In the model used for this study an intermediate stage between total air mixing on the one side and non-mixing on the other is hypothesized and expressed by a respective mixing factor ranging from 0 (no mixing at all) to 1 (total mixing).
For alveolar deposition of nanoparticles due to sedimentation, two extreme cases have to be distinguished: If total alveolar mixing is assumed, respective deposition
probability, pS, may be computed according to the formula
2
1 3
2 2 2
s s
S v t v t
p
R R
= −
[11]
with vs, t, and R, respectively, representing the terminal
settling velocity of the particle (m/s), the time of the particle residing in the alveolar space, and the alveolar radius (m). By definition, Eq. [11] provides values <1 for t <2R/vs, but, on
the other hand, adopts a constant value of 1 for t ≥2R/vs (39).
If alveolar mixing between inhaled and residual air volume is completely excluded (39,40), probability of nanoparticle deposition by sedimentation is given by the equation
2 2
3
(3 ) (3 )
1
4
S a r a A R A p
r
− + −
= − [12]
with
2 2 ( )2
2 s s
s R r v t
a r v t
v t − +
= + − [13]
and
2 2 ( )2 R r v t A R
v t − +
= − [14]
In Eq. [12], pS adopts the value 0 for t ≤ (R − r)/vs and the
value 1 for t ≥ (R + r)/vs. If, on the other hand, (R − r)/vs < t
< (R + r)/vs, deposition probability plots within the interval
]0, 1[.
In the model used for this contribution, computations of deposition probabilities are based on the aerodynamic diameter concept introduced above. In Eqs. [8]-[14], information on particle size is hidden in the diffusion coefficient as well as the terminal settling velocity. If diffusion and sedimentation exert on a nanoparticle with given aerodynamic diameter at the same time, total
deposition probability, pT, is simply calculated by summing
up the individual deposition probabilities (i.e., pT = pD + pS).
The computer program NANODEP for nanoparticle deposition calculations
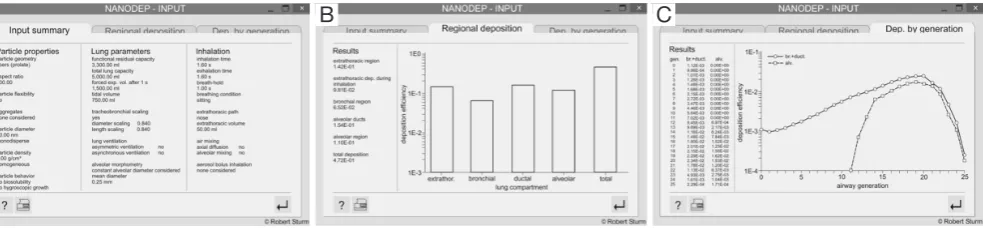
Simulation of nanoparticle deposition in the human alveoli was conducted by using a computer software that was specifically developed for particles of the nano-scale. In general, the program consists of an information and input
part (Figure 1) and an output part (Figure 2). In the input
forms, numerous particle characteristics may be selected. Additionally, an individual scaling of the lungs as well as a setup of specific inhalation parameters may be carried out. In the output forms, all input data used for deposition simulation are summarized. The user may select between numerical output data, being situated on the left parts of the forms, and their graphical presentation covering the remaining area of the forms. Besides a computation of regional deposition data, where particle fractions accumulated in the extrathoracic airways, the bronchial region, the alveolar ducts, and the alveoli themselves are presented, also airway generation-specific deposition data are provided. These data give a more detailed insight into the local deposition behavior of single nanoparticles.
of 0.1, 0.01, 0.005, and 0.001 were used. In addition, two different breathing conditions were selected: beside sitting breathing with a tidal volume of 750 mL, a breath-cycle length of 4.2 s (breath-hold: 1 s) and nasal inhalation, also heavy-exercise breathing with a tidal volume of 1,900 mL, a breath-cycle time of 2 s, and oral inhalation was applied. All calculations were conducted for a male standard lung with a functional residual capacity of 3,300 mL (41).
Results
Model validation
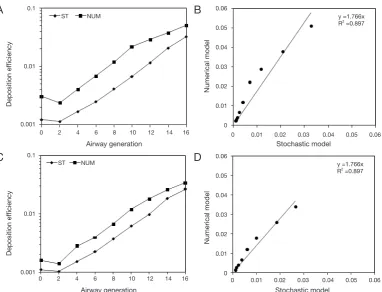
For checking the predictive accuracy of the model, output data produced by NANODEP were compared with respective results generated with a numerical model of carbon nanotube (CNT) deposition (3). Concretely speaking, deposition behavior of two specific CNT
A
B
C
A
B
[image:5.595.105.490.85.340.2]C
D
Figure 1 Entrance and input window of the computer program NANODEP, which was used for the theoretical calculations presented in this study. (A) Entrance window offering additional information on nanoparticles; (B) input of particle properties used for modeling; (C)
input of specific lung parameters; (D) input of selected inhalation parameters.
Figure 2 Output generated by the computer program NANODEP. (A) Summary of the selected input data; (B) numerical and graphic presentation of regional deposition data, thereby distinguishing between extrathoracic, bronchial, ductal, and alveolar compartment; (C)
numerical and graphic presentation of airway generation-specific deposition data, thereby distinguishing between bronchial and alveolar
[image:5.595.57.549.410.524.2](diameter of 10 nm, β =100; diameter of 10 nm, β =1,000) in the airway generations 0 (= trachea) to 16 (= terminal/ respiratory bronchioles) was simulated under assumption of light activity breathing conditions (tidal volume: 1,250 mL, breath-cycle time: 3 s). Concerning the shorter CNT
(β =100), deposition trends predicted by both models are
quite similar. Therefore, CNT deposition is increased
from central to peripheral airway generations (Figure 3A).
Values of the stochastic model steadily plot below the values of the numeric model, resulting in a correlation of the
model values with R2=0.897 (Figure 3B). With regard to the
long CNT (β =1,000) a rather similar picture is obtained,
whereby discrepancies between the models become smaller (Figure 3C). This circumstance results in a good correlation
of the model data with R²=0.962 (Figure 3D).
Alveolar deposition of different nanoparticles
Under sitting breathing conditions, deposition efficiency
of variously shaped nanoparticles in the alveoli ranges from
1.01×10⁻³ (one of 1,000 particles is deposited) to 1.24×10⁻¹
(124 of 1,000 particles are deposited; Figure 4). Alveolar
deposition of 10-nm spheres adopts a value of 8.42×10⁻²
and is excelled by the deposition of prolate particles (d =10 nm) with different aspect ratios by a factor of about 50%. As an interesting observation, alveolar deposition does not exhibit a positive correlation with the aspect ratio, but remains nearly constant for nanotubes with
β =10 and nanotubes with β =1,000. Concerning the
alveolar deposition of prolate nanomaterials taken up during sitting breathing, more remarkable trends may be observed insofar as deposition significantly declines with decreasing aspect ratio. With respect to 10-nm spheres, round platelets with a diameter of 10 nm and an aspect ratio of 0.1 exhibit a decrease in deposition of about 20%, whereas platelets with identical diameter and an aspect ratio of 0.001 show a respective decrease in deposition of
[image:6.595.109.492.81.373.2]98.5% (Figure 4).
Figure 3 Comparison between the stochastic model (ST) and a numerical model (NUM) of CNT deposition (3). (A) Generation specific
deposition of CNT with a diameter of 10 nm and β =100 under assumption of light activity breathing conditions; (B) correlation of model data presented in graph (A); (C) deposition of CNT with a diameter of 10 nm and β =1,000 under assumption of light activity breathing conditions; (D) correlation of model data presented in graph (C).
Deposition ef
ficiency
Deposition ef
ficiency
Numerical model
Numerical model
Airway generation
Airway generation
Stochastic model
Stochastic model
A
B
D
C
0.06 0.05 0.04 0.03 0.02 0.01 0 0.1
0.01
0.001
0.1
0.01
0.001
0.06 0.05 0.04 0.03 0.02 0.01 0
0 2 4 6 8 10 12 14 16 0 0.01 0.02 0.03 0.04 0.05 0.06
0 0.01 0.02 0.03 0.04 0.05 0.06 0 2 4 6 8 10 12 14 16
ST
ST
NUM
NUM
y =1.766x R2 =0.897
By changing the breathing conditions from sitting inhalation to heavy-exercise inhalation several changes regarding nanoparticle deposition in the alveoli may be recognized. In principle, deposition is subject to a
noticeable increase, thereby ranging from 1.96×10⁻² in the
case of extremely oblate particles to 2.01×10⁻¹
in the case
of nanotubes with β =10 (Figure 5). Among the prolate
nanoparticles, a slight decrease of alveolar deposition with increasing aspect ratio may be attested, whilst oblate particles exhibit a significant decrease in deposition with declining aspect ratio. Alveolar deposition of nanotubes with an aspect ratio of 1,000 amount to 80% with respect to the deposition value computed for nanotubes with an aspect ratio of 10. Alveolar deposition of nanodisks with an aspect ratio of 0.001, on the other hand, amounts to 12% compared to the deposition value obtained for nanodisks
with an aspect ratio of 0.1 (Figure 5).
Nanoparticle deposition in single alveolar lung generations
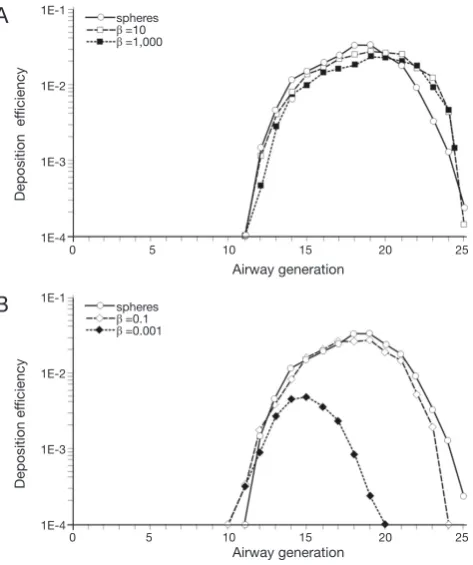
In order to get a more detailed insight into the deposition of nanoparticles in the alveolar lung region, generation-specific deposition graphs have been generated with the
help of the computer program (Figures 6,7). In order to
reduce the complexity of the graphs, only two anisometric particles were plotted together with 10-nm spheres: Among
the nanotubes, particles with β =10 and β =1,000 were
selected, whereas among the nanodisks, particles with β =0.1
and β =0.001 were used for graphical presentation. Under
sitting breathing conditions, alveolar deposition of 10-nm
spheres commonly adopts values >1.00×10⁻⁴ from airway
generation 11 to generation 23. The maximum of the bell-shaped deposition curve is located in airway generations
16-18 and reaches a value of 1.40×10⁻² (
Figure 6). Deposition of nanotubes is characterized by (I) higher intensity and (II) a translocation to more distal airway
Deposition ef
ficiency
Deposition ef
ficiency
A
B
Nanoparticle type
spheres
spheres 1E0
1E-1
1E-2
1E-3 1E0
1E-1
1E-2
1E-3
β =10
β =0.1
β =1,000
β =0.001
β =100
β =0.01
β =500
β =0.005
[image:7.595.315.550.82.369.2]Nanoparticle type
Figure 4 Total alveolar deposition of variously shaped nanoparticles under the assumption of sitting breathing conditions. (A) Deposition data for 10-nm spheres and nanotubes with a cylindrical diameter of 10 nm and different aspect ratios; (B) deposition data for 10-nm spheres and nanodisks with a cylindrical diameter of 10 nm and different aspect ratios.
Figure 5 Total alveolar deposition of variously shaped nanoparticles under the assumption of heavy-exercise breathing conditions. (A) Deposition data for 10-nm spheres and nanotubes with a cylindrical diameter of 10 nm and different aspect ratios; (B) deposition data for 10-nm spheres and nanodisks with a cylindrical diameter of 10 nm and different aspect ratios.
spheres spheres 1E0
1E-1
1E-2
1E-3
1E0
1E-1
1E-2
1E-3
β =0.1
β =10
β =0.001
β =1,000
β =0.01
β =100
β =0.005
β =500
Deposition ef
ficiency
Deposition ef
ficiency
A
B
Nanoparticle type
[image:7.595.49.287.83.374.2]generations with respect to the deposition of nanospheres.
Both nanotubes depicted in the graph of Figure 6A
exhibit a valuable deposition from airway generation 12 to generation 24. The deposition maximumof short tubes
(β =10) is located in generation 19 (1.98×10⁻²), whereas the
deposition maximum of extremely long tubes (β =1,000)
occurs in generation 20 and adopts a value of 1.70×10⁻².
Deposition of nanodisks is marked by (I) lower intensity and (II) limitation to a smaller range of airway generations.
Nanodisks with β =0.1 deposit in the alveoli from generation
12 to generation 23, with maximal deposition occurring in
generation 17 (1.21×10⁻²). Extremely thin nanodisks, on
the other hand, exhibit alveolar deposition from generation 13 to generation 17, with the respective maximum being
located in generation 15 (2.45×10⁻⁴; Figure 6B).
An increase of the inhalation flow rate, as it is produced by the switch from sitting breathing to heavy-exercise breathing, has two main consequences for the alveolar
deposition of variously shaped nanoparticles: Firstly, the overall intensity of deposition is noticeably increased and, secondly, the range of airway generations covered by particle deposition is subject to an enhancement. Regarding 10-nm spheres the alveolar deposition pattern runs from generation 11 to generation 25, with maximal
deposition being located in generation 19 (3.13×10⁻²).
This corresponds to an increase of 130 % with respect to sitting breathing. Deposition of short and extremely long nanotubes covers the same range of airway generations as does the deposition of nanospheres. Deposition maxima are located in airway generation 19 and 20, thereby
adopting values of 2.91×10⁻² (β =10) and 2.22×10⁻²
(β =1,000; Figure 7A). In the case of nanodisks
heavy-exercise breathing has a much stronger effect on alveolar deposition than documented for nanotubes. Deposition
of nanodisks with β =0.1 ranges from airway generation
[image:8.595.49.288.76.364.2]10 to generation 24, with the respective maximum being Figure 6 Generation-specific alveolar deposition of variously
shaped nanoparticles under the assumption of sitting breathing conditions. (A) Deposition data for 10-nm spheres and nanotubes with a diameter of 10 nm and aspect ratios of 10 and 1,000; (B) deposition data for 10-nm spheres and nanodisks with a diameter of 10 nm and aspect ratios of 0.1 and 0.001.
Figure 7 Generation-specific alveolar deposition of variously shaped nanoparticles under the assumption of heavy-exercise breathing conditions. (A) Deposition data for 10-nm spheres and nanotubes with a diameter of 10 nm and aspect ratios of 10 and 1,000; (B) deposition data for 10-nm spheres and nanodisks with a diameter of 10 nm and aspect ratios of 0.1 and 0.001.
Deposition ef
ficiency
Deposition ef
ficiency
A
B
1E-1
1E-2
1E-3
1E-4
1E-1
1E-2
1E-3
1E-4
0 5 10 15 20 25
0 5 10 15 20 25
Airway generation
Airway generation
spheres
β =10
β =1,000
spheres
β =0.1
β =0.001
Deposition ef
ficiency
Deposition ef
ficiency
A
B
1E-1
1E-2
1E-3
1E-4
1E-1
1E-2
1E-3
1E-4
0 5 10 15 20 25
0 5 10 15 20 25
Airway generation
Airway generation
spheres
β =10
β =1,000
spheres
β =0.1
[image:8.595.314.551.83.366.2]situated in generations 19 and 20 (2.70×10⁻²). With regard
to extremely thin disks (β =0.001) alveoli of generations
10-20 are characterized by respective particle deposition. The deposition maximum is situated in airway generation
15 and adopts a value of 4.82×10⁻³. In this specific case,
maximal deposition is subject to a 20-fold increase with
respect to sitting breathing (Figure 7B).
Discussion
In the past two decades nanotechnology became a broad interdisciplinary area of research, development, and industrial activity. The main objective of nanotechnology consists in the production of nanoparticles by a wide variety of physical, chemical, and biological processes. Some of these processes are highly innovative, whereas others are commonplace. As reported by Aitken and co-workers (6), only gas-phase production processes bear the potential to cause exposure to primary nanoparticles by inhalation during the synthesis stage. All production processes may give rise to exposure to agglomerated nanoparticles by inhalation, dermal uptake, and ingestion during recovery, powder handling, and product processing. Although artificial nanoparticles are not part of the outdoor and indoor environment of most people, many workers may be exposed to such materials via incidental production in processes such as welding and refining. Therefore, comprehensive knowledge on the behavior of nanomaterials in the human body and especially in the respiratory system has become highly essential in the meantime. Besides epidemiological studies, running over long periods of time, and experiments using laboratory animals, theoretical models significantly contribute to the acquisition of this knowledge.
In the present study alveolar deposition of nanoparticles with different geometries (spheres, cylinders, disks) was simulated by using a computer program that was specifically developed for this purpose. As clearly demonstrated by the results generated with this program, alveolar deposition of nanoparticles depends on both particle shape and breathing conditions. Under sitting breathing conditions, where one breath-cycle has a duration of 4.2 s and 750 mL of air are inhaled, prolate nanoparticles deposit with highest numbers in the alveoli, followed by 10-nm spheres and oblate nanoparticles. Whilst alveolar deposition of prolate nanoparticles does not exhibit a noticeable dependence on the particle’s aspect ratio, a completely contrary situation is given for oblate nanoparticles, where deposition intensity
declines with decreasing thickness of the disks. According to the concept of the aerodynamic diameter thin disks generate much lower equivalent-volume diameters than long cylinders with identical equatorial diameter. Since the dynamic shape factors of both particle types are similar, aerodynamic diameters of long cylinders exceed those of thin disks by one or two orders of magnitude (29-31). As a consequence of these results, the motion of disks within the inhaled air stream is much more controlled by diffusive processes (diffusive force and diffusive torque) than the motion of cylinders, for which gravitational settling represents an alternative deposition mechanism (36,40,41). As confirmed by numerous theoretical (21-25) and experimental studies (17-19), inhalation of nano-scale particles with low flow rates commonly results in a diffusive deposition of high particle fractions in the airways of the extrathoracic region. If inhalation is carried out through the nose, this filtering of nanoparticles is subject to a further intensification (24,41).
Increase of the inhalation flow rate bears the interesting phenomenon of alveolar deposition intensification of most particles used in this study or, with other words, the dose of nanoparticles attaining to the alveolar region increases with the intensity (i.e., tidal volume and breathing frequency) of inhalation. This essential finding is underlined by both theoretical and experimental investigations (17,20,21) dealing with UFP and is founded on the circumstance that any increase of the intrapulmonary flow velocity enhances the axial transport distance of the inhaled nanomaterials, before they deposit on the bronchial and alveolar walls due to lateral diffusion (24,25). Hence, extrathoracic filtering is subject to a partly significant decline, if the inhalation uptake of nanoparticle-loaded air is intensified.
processes (42). In principle, like all other substances deposited in the alveoli also nanoparticles undergo a clearance process, within which particle removal from the alveolar surface due to phagocytosis and endocytosis plays a superior role (42-45). These clearance mechanisms become remarkably limited or even prohibited, if particle length exceeds a certain threshold value (15 µm) and particles are not characterized by any biosolubility (24,46). In this case, nanoparticles and especially nanotubes may remain on the alveolar surface or, after being encapsulated by fibrocytes, in the interstitium for a period of several years (41).
At last, main hygienic consequences resulting from the long-term storage of nanoparticles in the alveolar compartment have to subjected to a brief discussion. As already mentioned in the introduction, possible health effects induced by nanoparticles are manifold but not completely understood hitherto. Long and biopersistent particles are commonly thought to behave similar to asbestos fibers. Therefore, the may provoke a comprehensive remodeling of the subepithelial connective tissue due to the activation of fibroblasts, monocytes, and neutrophils, finally resulting in an alveolar fibrosis (13,20). On a more cellular level nanomaterials may trigger the enhanced production of reactive oxygen species (ROS) and reactive nitrogen species (RNS), which have the ability of influencing DNA transcription and DNA replication and, thus, may induce malignant transformations. Since our current knowledge on nanoparticle exposure has to be evaluated as insufficient, respective risk assessments for this particle group are still under construction and depend on the establishment of appropriate health databases and other information resources (1,2,5,6).
Based on the results of this study, it may be concluded that deposition of nanoparticles in the alveolar zone of the respiratory tract may advance to a key topic of nanomedicine, as particle doses attaining to the alveoli can reach significant extents. These doses being accumulated in the alveolar structures are mainly controlled by particle geometry and the mode of breathing. These findings, however, should be considered in future risk assessments.
Acknowledgements
None.
Footnote
Conflicts of Interest: The author has no conflicts of interest to declare.
References
1. Maynard AD, Aitken RJ, Butz T, et al. Safe handling of nanotechnology. Nature 2006;444:267-9.
2. Donaldson K, Aitken R, Tran L, et al. Carbon nanotubes: a review of their properties in relation to pulmonary toxicology and workplace safety. Toxicol Sci 2006;92:5-22.
3. Högberg SM. Modeling nanofiber transport and
deposition in human airways. PhD dissertation, Dept Appl Phys Mech Eng, Tech Univ Lulea, Lulea, Sweden, 2010. 4. Long CM, Suh HH, Koutrakis P. Characterization of
indoor particle sources using continuous mass and size monitors. J Air Waste Manag Assoc 2000;50:1236-50. 5. Sturm R. Theoretical and experimental approaches to the
deposition and clearance of ultrafine carcinogens in the
human respiratory tract. Thoracic Cancer 2011;2:61-8. 6. Aitken RJ, Creely KS, Tran CL. Nanoparticles: An
occupational hygiene review, Research Report 274. Available online: http://www.hse.gov.uk/research/rrpdf/rr274.pdf 7. Maynard AD. Nanotechnology: the next big thing, or
much ado about nothing? Ann Occup Hyg 2007;51:1-12.
8. Poland CA, Duffin R, Kinloch I, et al. Carbon
nanotubes introduced into the abdominal cavity of mice show asbestos-like pathogenicity in a pilot study. Nat Nanotechnol 2008;3:423-8.
9. Geiser M, Rothen-Rutishauser B, Kapp N, et al. Ultrafine
particles cross cellular membranes by nonphagocytic mechanisms in lungs and in cultured cells. Environ Health Perspect 2005;113:1555-60.
10. Duffin MR, Tran CL, Clouter A, et al. The importance of surface area and specific reactivity in the acute pulmonary inflammatory response to particles. Ann Occup Hyg
2002;46:242-5.
11. Donaldson K, Tran CL. Inflammation caused by particles and fibers. Inhal Toxicol 2002;14:5-27.
12. Schins RP, Lightbody JH, Borm PJ, et al. Inflammatory effects of coarse and fine particulate matter in relation
to chemical and biological constituents. Toxicol Appl Pharmacol 2004;195:1-11.
13. Seaton A, MacNee W, Donaldson K, et al. Particulate air pollution and acute health effects. Lancet 1995;345:176-8. 14. Peters A, Döring A, Wichmann HE, et al. Increased
plasma viscosity during an air pollution episode: a link to mortality? Lancet 1997;349:1582-7.
15. Peters A, Wichmann HE, Tuch T, et al. Respiratory effects
are associated with the number of ultrafine particles. Am J
Respir Crit Care Med 1997;155:1376-83.
by benzo[a]pyrene 7,8-diol-9,10-epoxide in bronchial epithelial cells from patients with lung cancer: comparison with lung parenchyma. Cancer Lett 2004;207:157-63. 17. Schiller CF, Gebhart J, Heyder J, et al. Deposition of
monodisperse insoluble aerosol particles in the 0.005 to 0.2 µm size range within the human respiratory tract. Ann Occup Hyg 1988;32:41-9.
18. Jaques PA, Kim CS. Measurement of total lung deposition
of inhaled ultrafine particles in healthy men and women.
Inhal Toxicol 2000;12:715-31.
19. Kim CS, Jaques PA. Respiratory dose of inhaled ultrafine
particles in healthy adults. Phil Trans Royal Soc Lond A 2000;358:2693-05.
20. Oberdörster G. Pulmonary effects of inhaled ultrafine
particles. Int Arch Occup Environ Health 2001;74:1-8. 21. Hofmann W, Sturm R, Winkler-Heil R, et al. Stochastic model
of ultrafine particle deposition and clearance in the human
respiratory tract. Radiat Prot Dosimetry 2003;105:77-80. 22. Sturm R, Hofmann W. A theoretical approach to the
deposition and clearance of fibers with variable size in the
human respiratory tract. J Hazard Mater 2009;170:210-8. 23. Sturm R. Theoretical models of carcinogenic particle
deposition and clearance in children's lungs. J Thorac Dis 2012;4:368-76.
24. Sturm R. Nanotubes in the human respiratory tract - Deposition modeling. Z Med Phys 2015;25:135-45. 25. Sturm R. Theoretical models for dynamic shape factors
and lung deposition of small particle aggregates originating from combustion processes. Z Med Phys 2010;20:226-34. 26. Sturm R, Hofmann W. A computer program for the
simulation of fiber deposition in the human respiratory
tract. Comput Biol Med 2006;36:1252-67.
27. Sturm R. Deposition and cellular interaction of cancer-inducing particles in the human respiratory tract: Theoretical approaches and experimental data. Thoracic Cancer 2010;4:141-52.
28. Fuchs NA. The Mechanics of Aerosols. New York: Pergamon Press, 1964.
29. Stöber W. Dynamic shape factors of nonspherical aerosol particles. In: Mercer TT, ed. Assessment of Airborne Particles.
Springfield: Charles C Thomas Publisher, 1972:249-89.
30. Willeke K. Baron PA. Aerosol measurement. New York: John Wiley, 1993.
31. Hinds WC. Aerosol Technology: Properties, Behavior, and Measurement of Airborne Particles. New York: John Wiley, 1999.
32. Kasper G. Dynamics and measurement of smokes. I Size characterization of nonspherical particles. Aerosol Sci
Technol 1982;1:187-99.
33. Dahneke B. Slip correction factors for nonspherical
bodies–I Introduction and continuum flow. J Aerosol Sci
1973;4:139-45.
34. Dahneke B. Slip correction factors for nonspherical bodies–
II Free molecular flow. J Aerosol Sci 1973:4;147-61.
35. DeCarlo PF, Slowik JG, Worsnop DR, et al. Particle morphology and density characterization by combined mobility and aerodynamic diameter measurements. Aerosol Sci Technol 2004;38:1185-1205.
36. Su WC, Cheng YS. Fiber deposition pattern in two human respiratory tract replicas. Inhal Toxicol 2006;18:749-60. 37. Baron PA, Willeke K. Gas particle motion. In: Baron PA,
Willeke K. eds. Aerosol mea-surement: Principles, Techniques, and Applications. New York: John Wiley, 2001:61-97.
38. Koblinger L, Hofmann W. Analysis of human lung morphometric data for stochastic aerosol deposition calculations. Phys Med Biol 1985;30:541-56.
39. Yeh HC, Schum GM. Models of human lung airways and their application to inhaled particle deposition. Bull Math Biol 1980;42:461-80.
40. Koblinger L, Hofmann W. Monte Carlo modeling of aerosol deposition in human lungs. Part I: Simulation of particle transport in a stochastic lung structure. J Aerosol Sci 1990;21:661-74.
41. International Commission on Radiological Protection (ICRP). Human respiratory tract model for radiological protection, Publication 66. Oxford: Pergamon Press, 1994.
42. Sturm R. A computer model for the simulation of
fiber-cell interaction in the alveolar region of the respiratory tract. Comput Biol Med 2011;41:565-73.
43. Sturm R, Hofmann W. Mechanistic interpretation of the slow bronchial clearance phase. Radiat Prot Dosimetry 2003;105:101-4.
44. Hofmann W, Sturm R. Stochastic model of particle clearance in human bronchial airways. J Aerosol Med 2004;17:73-89. 45. Sturm R. A computer model for the clearance of insoluble
particles from the tracheobronchial tree of the human lung. Comput Biol Med 2007;37:680-90.
46. Warheit DB, Laurence BR, Reed KL, et al. Comparative pulmonary toxicity assessment of single-wall carbon nanotubes in rats. Toxicol Sci 2004;77:117-25.