John Anthony Hirdt1 1
Department of Mathematics and Computer Science, St. Joseph’s College, Patchogue, NY 11772, USA
(Dated: April 15, 2014)
The EXFOR database contains the largest collection of experimental nuclear reaction data avail-able as well as the data’s bibliographic information and experimental details. We created an undi-rected graph from the EXFOR datasets with graph nodes representing single observables and graph links representing the various types of connections between these observables. This graph is an abstract representation of the connections in EXFOR, similar to graphs of social networks, author-ship networks, etc. By analyzing this abstract graph, we are able to address very specific questions such as 1) what observables are being used as reference measurements by the experimental nuclear science community? 2) are these observables given the attention needed by various nuclear data evaluation projects? 3) are there classes of observables that are not connected to these reference measurements? In addressing these questions, we propose several (mostly cross section) observables that should be evaluated and made into reaction reference standards.
I. PROBLEM AND MOTIVATION
In the early 1950’s, the Department of Energy’s Brookhaven National Laboratory began compiling and archiving nuclear reaction experimental data in the SCISRS database [1]. Over the years, this project has grown and evolved into the EXFOR project [2]. EXFOR is an international experimental nuclear data collection and dissemination project now led by the IAEA nuclear data section, coordinating the experimental nuclear data compilation and archival work of several nations.
The EXFOR nuclear experimental database provides the data which underpins nearly all evaluated neutron and charged particle evaluations in ENDF-formatted nu-clear data libraries (e.g. ENDF/B, JEFF, JENDL, ...). Therefore, EXFOR is in many ways the “mother li-brary” which leads to the nuclear data used in all ap-plications in nuclear power, security, nuclear medicine, etc. The EXFOR database includes a complete compi-lation of experimental neutron-induced, a selected com-pilation of charged-particle-induced, a selected compila-tion of photon-induced, and assorted high-energy and heavy-ion reaction data. The EXFOR library is the most comprehensive collection of experimental nuclear data available. Therefore, it is the best place to look for an overview of what the applied and basic experimental nu-clear science communities feel are valuable experimental reactions and quantities [1, 2]. In this work, we take an abstract view of the EXFOR database and generate an undirected graph describing all the connections between reactions/quantities in the EXFOR database. From just these connections, we can infer what reactions/quantities the nuclear science community collectively (and some-what unconsciously) views as important.
The basic unit of EXFOR is anENTRY. AnENTRY cor-responds to one experiment and contains the numerical data, the related bibliographic information and a brief description of the experimental method. What an EX-FOR ENTRYreally represents is the results of work that was performed at a given laboratory at a given time. An
ENTRYdoes not necessarily correspond to one particular publication, but very often corresponds to several publi-cations. The EXFOR compiler takes the essential infor-mation from all available sources, and if needed, contacts the author for more information.
Our goal is to be able to view the EXFOR database in a way previously unseen. We wish to take the data, compiled by experimental physicists and analyzed by the-oretical physicists and draw mathematical connections between the two groups. We will utilize Python to trans-form the database into our graph and run data analysis using our network theory metrics. We intend to compare our graph to other real life networks and look for simi-larities and differences that may be able to help us draw upon patterns and graph motifs in our analysis. It is our hope that we will be able to either verify existing nuclear data measurements or draw conclusions for future data measurements.
II. BACKGROUND AND RELATED WORK
An entry is typically divided in several SUBENTs con-taining the data tables resulting from the experiment. Each SUBENT contains a REACTION field which encodes what reaction was studied (e.g. 1H(n,el)) and what quan-tity was measured (e.g. cross-section or angular distribu-tion). ASUBENTmay also contain aMONITORfield which encodes one or more well characterized reactions and quantities used to reduce or eliminate systematic experi-mental errors. Thus, reaction monitors are an important part of experimental data reduction. Often the measured data encoded in theREACTIONfield is measured relative to the reaction/quantity encoded in the MONITOR field. There is usually a straightforward mapping between the reactions/quantities measured in EXFOR and the evalu-ated reactions/quantities stored in the ENDF libraries.
Several specific reaction/quantities are important enough, usually because of one or more specific applica-tions, that the nuclear data community has elevated them
to the level of an international reference standard. Many experimenters use these reaction/quantities as monitors in their experiments. References [3–6] provide details of well known neutron-induced, charged-particle and pho-tonuclear standard reaction/quantities. We divided these references into two different classes. We define Tier 1 observables as the product of sustained evaluation ef-forts, with periodic refinement. Our Tier 1 standards include the evaluations from the ENDF/B Neutron Stan-dards [3] project and theAtlas of Neutron Resonances[4]. Our second tier encompasses standards that are of very high quality but are not performed as part of a sustained project. There may be follow ups or limited refinements. This second tier includes medical and dosimitry evalua-tions in Ref. [5] and the results of the IRDFF project [6]. There is also a new Tier 1 standards-level effort just beginning known as CIELO pilot project [7]. CIELO promises to generate entire standards-level evaluations including all reactions/quantities needed for the ENDF-formatted libraries for neutron-induced reactions on 1H, 16O,56Fe,235U,238U and239Pu.
When undertaking this project we specifically set out with the goal of answering some important questions.
• What are the most connected targets? What are the most connected reactions/quantities?
• Are there reactions/quantities that are so con-nected that they should be a standard?
• What is the connection number distribution for tar-gets and reactions? What is the link number dis-tribution between any two targets?
• Can we use this information to inform new mea-surements that decrease the distance between im-portant targets and standards?
• Are there “bottlenecks” along the pathways from a given reaction to reaction standards that are not well measured?
• What elements and isotopes of reactions are not linked? Are any of them important for specific ap-plications?
In order to attempt to resolve these questions we uti-lized graph theory as a tool to examine the connections between measurements in EXFOR.
Although we take an abstract view of the EXFOR database, from just the connections in our undirected graph we can infer what reactions/quantities the nu-clear science community collectively (and somewhat un-consciously) views as important. This set of reac-tions/quantities does not exactly match our previous ex-pectations. We will provide a series of recommendations for reactions/quantities that should be considered for el-evation to the level of the standards in references [3–6] or possibly included in a follow-on CIELO project. We also find that our graph is disconnected, implying there are large numbers of reactions/quantities that are not
pinned to any monitor. In many cases, this is due to poor coding of the EXFORENTRYs. Although this is a serious problem in our study, there is no easy fix. Even if additional information is given, it is often given in one of the free text fields in EXFOR which are difficult, if not impossible, to parse. Finally, we use phenomenology from other model graphs (i.e. “scale free”, “small world” and “random” graphs) to inform our discussion.
III. APPROACH AND UNIQUENESS
The goal of this project was to take the EXFOR database, transform the entries into a graph, and ap-ply graph theory metrics to said graph, in order to draw conclusions about the database. Entries in the EXFOR data base as stated earlier, date back to the Manhat-tan Project and contain all pertinent information from the experiment including a free text field, in which ex-perimental physicists can add any additional informa-tion they please about their experiment. Each EXFOR
SUBENT corresponds to one or more measured datasets and each dataset in theSUBENTis associated with exactly one reaction/quantity in theREACTIONfield. Multiple re-action/quantities and datasets are denoted with EXFOR pointers. EachSUBENTmay also contain aMONITORfield which we also note. BothREACTION andMONITOR fields have essentially the same format and contain much the same information [9]. TheMONITOR field may also con-tain other free-text information detailing how the moni-tor was used and we ignore this information. An example of a simple measurement is
(1-H-1(N,TOT),,SIG,,MXW)
This REACTION field tells us that the 1H(n,tot) Maxwellian (MXW) averaged cross-section (SIG) was mea-sured in the associatedSUBENT. In our graph, we assign each of these elementary reaction/quantities inREACTION
orMONITORfields to a node.
While building our graph, we associate the number of occurrences of each elementary reaction/quantity with the corresponding node. In our graph we did not make any distinction between variations in observerables. For example, “PAR,SIG” coding for partial cross sections, “SIG” for integrated cross sections and “CN,SIG” for compound nuclear cross sections are all treated as “SIG”. We make two notes on double counting of nodes. First, when the EXFOR compiler flags a reaction/quantity in theMONITORfield and also compiles the reaction/quantity as a ratio we count both the occurrences of the moni-tor reaction/quantity separately. This is straightforward to fix and will be done in future incarnations of this project. Second, it often happens that an experimenter who makes a ratio measurement will publish both the ra-tio values and the unfolded absolute value of a measured reaction/quantity. An EXFOR compiler will then com-pile both values as if they are independent datasets and provide an explanation of the sets in one of the EXFOR
free text fields. As one must parse the free text descrip-tions of the experiment in order to discern this, we have no simple workaround.
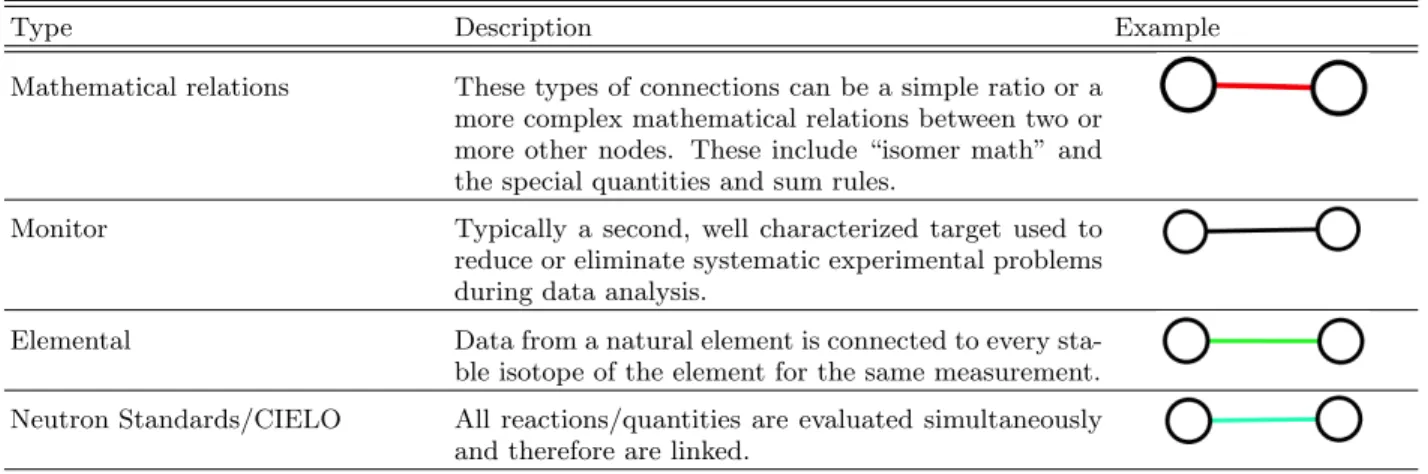
The nodes in our graph are connected by edges. The types of edges we consider are listed in Table I. By far the most common type of edge in our graph is the
MONITOR–REACTION connection. However, the EXFOR format provides several other connections between ele-mentary nodes. REACTIONand MONITOR fields may also contain mathematical relations, e.g.
((94-PU-239(N,F),,NU,,MXW)/ (92-U-235(N,F),,NU,,MXW))
In this example, the measurement was the ratio of Maxwellian averagedνp’s from239Pu(n,f) and235U(n,f).
Any relation using +,-,*,/, //, and= are allowed in the
REACTIONandMONITORfields (here//means double ra-tio). EXFOR also allows what we call “isomer math”:
(72-HF-177(N,G)72-HF-178-M/T,,SIG/RAT)
Here, what was measured was the ratio of 177Hf(n, γ)178mHf cross section to the total of
177Hf(n, γ)178mHf and177Hf(n, γ)178gHf cross sections.
We link all of the Neutron Standards [3] reac-tions/quantities together because they are evaluated si-multaneously. We also consider all reactions/quantities covered by one isotope in the CIELO pilot project [7] to be linked together since they to are evaluated together.
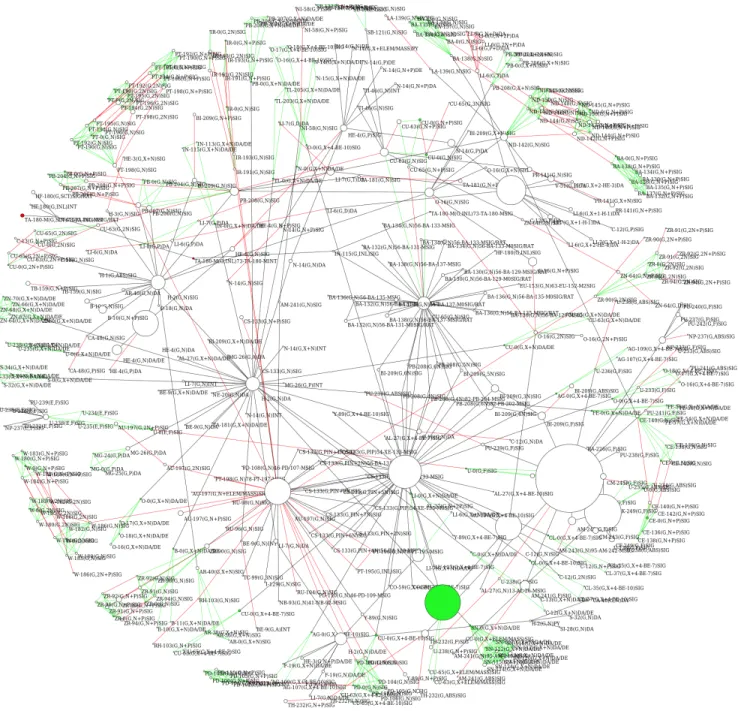
Although we are not the first to take a database, and transform it into a graph, and analyze its properties in new ways, we are the first to do this in the field of Nu-clear data to the extent of looking at an entire database. We generated our graph using x4i[8] and saved the re-sults as a GraphML [10] file. A preliminary versions of this graph were presented in Ref. [11]. The full graph has 87,925 nodes and 276,852 edges. We then studied this graph with thenetworkx [12] andgraph-tool [13] Python packages. With graph-tool, we were able to visualize portions of the graph. Examples are shown in Figures 1. We utilizednetworkx [12] for our analysis of the graph, as well as for testing purposes throughout our experimentation.
IV. RESULTS AND CONTRIBUTIONS
The final graph is too large and fully connected to vi-sualize with the tools we currently have available. Un-fortunately, we were not able to visualize the portion of the graph that contains the majority of the Tier 1 and 2 standards and CIELO nodes.
We summarize the graph’s properties here: • Number of nodes: 87,925
• Number of edges: 276,852
• Number of isolated nodes (“isolates”): 23,196
• Number of clusters with 40 or more nodes: 7 • Average degreehki: 6.2975
• Variance of degree distributionk2: 39.6584 • Probability two nodes are connectedp: 7.162e-5 • Average cluster coefficienthCi: 0.5958
In November, at the annual meeting of the United States Nuclear Data Program, a part of National Nuclear Data Week, we had the privilege to present our results in a conference style setting. Having placed mathemat-ical significance behind our choices(found below in the Conclusion) this will be the first time, since EXFOR’s origin’s, that mathematics will be used in the decision making process of future Nuclear Data Evaluation’s. It is our hope, that this project will be able to save the nations involved in the EXFOR project, millions if not billions of dollars, by allowing evaluator’s to make better decisions and choices then ever before.
V. CONCLUSION
In this project, we created an undirected graph from theREACTIONand MONITORstrings from datasets in the EXFOR database. This graph is a large, nearly scale-free network composed of disconnected clusters. The largest clusters have a “small-world” character. Our graph is in many ways typical for real world graphs.
With our graph, we identify what reactions and quan-tities the nuclear science community views as important enough to directly measure or measure relative to. We do this in a relatively objective fashion. Clearly the vari-ous standards projects in Refs. [3–6] have a good handle on what is important. Also, the clustering coefficients allowed us the ability to demonstrate how connected the CIELO nodes actually are. Verifying, choices made for the CIELO project. However, it is clear from the anal-ysis of our graph that the following reaction/quantities have out-sized importance and are not considered in any standards effort:
• Aluminum reaction/quantities:
– n+27Al: the (n, p+27Mg) cross section
– p+27Al: the (p, n+ 3p) cross section and the 22Na and24Na production cross sections
– 12C+27Al: the24Na production cross section • Molybdinum also a very important structural
ma-terial:
– p+natMo: the96Tc production cross section
TABLE I. Types of edges in our graph.
Type Description Example
Mathematical relations These types of connections can be a simple ratio or a more complex mathematical relations between two or more other nodes. These include “isomer math” and the special quantities and sum rules.
Monitor Typically a second, well characterized target used to reduce or eliminate systematic experimental problems during data analysis.
Elemental Data from a natural element is connected to every sta-ble isotope of the element for the same measurement. Neutron Standards/CIELO All reactions/quantities are evaluated simultaneously
and therefore are linked.
We recommend that at the very least that27Al and all of the Mo isotopes be considered as a target material in ei-ther a follow-on CIELO or IRDFF project. In addition, a standards level study of fission product yields of the ma-jor actinides as suggested in the discussions at the recent Working Party on Evaluation Cooperation Subgroup 37 meeting [14] would improve the connectivity of all fission product yield data.
The results of our project have yielded numerous re-sults with direct implications on the future. First, nu-clear data is a field of extreme importance. Without this data, we cannot run devices such as Linear Accelerators, the Large Hadron Collider or Nuclear Reactors all over the world. The major results of this project include the first definitive, logical proof based reasoning behind the choice of possible standards. With our proposed stan-dards, there are possibilities down the road for improve-ments in Nuclear Reactors/Nuclear Technologies. This includes but is not limited to improving Medical Dosime-try Reactions, material analysis for Nuclear Reactors and improved decision making tools now available to the
Un-tied States Nuclear Data Program.
Further information and a full paper can be found at
http://arxiv.org/abs/1312.6200
ACKNOWLEDGMENTS
Many Thanks go out to M. Herman (BNL) and J. Fritz (St. Joseph’s College) for their support of this project and acknowledge the useful discussions with N. Otsuka (IAEA), A. Carlson (NIST), A. Plompen (IRMM) and R. Capote (IAEA). The work at Brookhaven National Lab-oratory was sponsored by the Office of Nuclear Physics, Office of Science of the U.S. Department of Energy under Contract No. DE-AC02-98CH10886 with Brookhaven Science Associates, LLC. This project was supported in part by the U.S. Department of Energy, Office of Science, Office of Workforce Development for Teachers and Scien-tists (WDTS) under the Science Undergraduate Labora-tory Internships Program (SULI).
[1] Holden, Norman. “A short history of CSISRS”, National Nuclear Data Center, Brookhaven National Laboratory, BNL Report BNL-75288-2005-IR (2005).
[2] International Network of Nuclear Reaction Data Centres (NRDC), “Compilation of experimental nuclear reaction data (EXFOR/CSISRS)”, http://www-nds.iaea.org/ exfor/andhttp://www.nndc.bnl.gov/exfor/(2012). [3] A.D. Carlson, et al. “International Evaluation of
Neu-tron Cross Section Standards”, Nucl. Data Sheets, 110.12 (2009) 3215-3324.
[4] S.F. Mughabghab,Atlas of Neutron Resonances, Elsevier Science, (2006).
[5] P.Oblozinsky, “Charged-particle cross section database for medical radioisotope production; Diagnostic radioiso-topes and monitor reactions”, International Atomic Energy Agency IAEA, IAEA-TECDOC-1211 http:// www-nds.iaea.org/medical/(2003).
[6] E.M. Zsolnay, R. Capote Noy, H.J. Nolthenius, A. Trkov, “Summary description of the new International Reactor Dosimetry and Fusion File (IRDFF release 1.0)” Interna-tional Atomic Energy Agency IAEA, INDC(NDS)-0616, https://www-nds.iaea.org/IRDFF/(2012).
[7] M. Chadwick, et al. “CIELO: A Future Collaborative International Evaluated Library”, Proceedings of the In-ternational Conference of Nuclear Data for Science and Technology (ND2013) (2013).
[8] D.A. Brown, x4i: the EXFOR interface, version 1.0, https://ndclx4.bnl.gov/gf/project/x4i/(2011). [9] O. Schwerer, “EXFOR Formats Description for Users
(EXFOR Basics)”, Documentation Series for the IAEA Nuclear Data Section, Vienna (2008).
[10] GraphML File Format,graphml.graphdrawing.org [11] D.A. Brown, “Visualizing the Connections in the EXFOR
Database”, Proceedings of the International Conference of Nuclear Data for Science and Technology (ND2013)
FIG. 1. The second largest cluster in the graph. This cluster is mainly composed of photonuclear data. The size of the nodes is proportional to the number of occurrences of each reaction/quantity in the EXFOR database.
(2013); D.A. Brown, J. Hirdt, M. Herman “Data min-ing the EXFOR database,” NEMEA-7 Workshop, Geel, Belgium, BNL Report BNL-103473-2013-IR (2013). [12] A. Hagberg, D. Schult, P. Swart,Networkx Version 1.8.1
(2012)
[13] T.P. Peixoto, graph-tool version 2.2.27, http:// graph-tool.skewed.de/(2013).
[14] WPEC-SG37 Meeting, “Improved fission product yield evaluation methodologies”, NEA Headquarters, Paris, France 22 May (2013); https://www.oecd-nea.org/ science/wpec/sg37/Meetings/2013_May/.