Best Practices In Quality Control
And Assurance In Design
NCHRP Project 20-68A
Scan 09-01
Supported by the
National Cooperative Highway Research Program July 2011
The information contained in this report was prepared as part of NCHRP Project 20 68A U.S. Domestic Scan, National Cooperative Highway Research Program.
SPECIAL NOTE: This report IS NOT an official publication of the National Cooperative Highway Research Program, Transportation Research Board, National Research Council, or The National Academies.
B E ST P R AC T I C E S I N Q UA L I T Y CO N T R O L A N D ASS U R A N C E I N D E S I G N
Acknowledgments
The work described in this document was conducted as part of NCHRP Project 20-68A, the U.S. Domestic Scan program. This program was requested by the American Association of State Highway and Transportation Officials (AASHTO), with funding provided through the National Cooperative Highway Research Program (NCHRP). The NCHRP is supported by annual voluntary contributions from the state departments of transportation. Additional support for selected scans is provided by the U.S. Federal Highway Administration and other agencies.
The purpose of each scan and of Project 20-68A as a whole is to accelerate beneficial innovation by facilitating information sharing and technology exchange among the states and other
transportation agencies, and identifying actionable items of common interest. Experience has shown that personal contact with new ideas and their application is a particularly valuable means for such sharing and exchange. A scan entails peer-to-peer discussions between practitioners who have implemented new practices and others who are able to disseminate knowledge of these new practices and their possible benefits to a broad audience of other users. Each scan addresses a single technical topic selected by AASHTO and the NCHRP 20-68A Project Panel. Further information on the NCHRP 20-68A U.S. Domestic Scan program is available at
http://144.171.11.40/cmsfeed/TRBNetProjectDisplay.asp?ProjectID=1570.
This report was prepared by the scan team for Scan 09-01, Best Practices in Quality Control
and Assurance in Design, whose members are listed below. Scan planning and logistics are
managed by Arora and Associates, P. C.; Harry Capers PE is the Principal Investigator.
Hossein Ghara, PE,Louisiana DOT, AASHTO Co-Chair
Kelley C. Rehm, PE, Kelley Rehm Consulting, Principal Author
Nancy Boyd, Washington State DOT
Tim Swanson, Minnesota DOT
Carmen Swanwick, Utah DOT
Robert J. Healy, PE, Maryland DOT
Richard W. Dunne, PE, New Jersey DOT
Disclaimer
The information in this document was taken directly from the submission of the authors. The opinions and conclusions expressed or implied are those of the scan team and are not necessarily those of the Transportation Research Board, the National Research Council, or the program sponsors. This document has not been edited by the Transportation Research Board.
6
B E ST P R AC T I C E S I N Q UA L I T Y CO N T R O L A N D ASS U R A N C E I N D E S I G N
Scan 09-01
Best Practices In Quality Control And
Assurance In Design
P R E PA R E D B Y R E Q U E S T E D B Y T H E
American Association of State Highway and Transportation Officials
Hossein Ghara, P.E.,
Louisiana DOT, AASHTO Co-Chair
Kelley C. Rehm, P.E.,
Kelley Rehm Consulting, Principal Author
Nancy Boyd,
Washington State DOT
Tim Swanson,
Minnesota DOT
Carmen Swanwick,
Utah DOT
Robert J. Healy, P.E.,
Maryland DOT
Richard W. Dunne,
New Jersey DOT
Robert S. Watral, P.E.,
Pennsylvania DOT
Arora and Associates, P.C. Lawrenceville, NJ
July 2011
S C A N M A N A G E M E N T
The information contained in this report was prepared as part of NCHRP Project 20 68A U.S. Domestic Scan, National Cooperative Highway Research Program.
SPECIAL NOTE: This report IS NOT an official publication of the National Cooperative Highway Research Program, Transportation Research Board, National Research Council, or The National Academies.
I
B E ST P R AC T I C E S I N Q UA L I T Y CO N T R O L A N D ASS U R A N C E I N D E S I G N
Table of Contents
Abbreviations and Acronyms
...VII
Executive Summary
...ES-1
Overview... ES-1Common Practices ... ES-2 Training and Well-Developed Communication Channel ...ES-3 Drivers to Document QC/QA Processes ... ES-3 Common Review and Approval Practices... ES-4 Summary of Initial Findings and Recommendations... ES-4 Overall Successful Strategies... ES-4 Checklists, Manuals and Standards...ES-5 Scoping and Environmental... ES-5 Value Engineering Feedback... ES-5 Consultant Selection and Communication... ES-6 Construction Reviews and Feedback... ES-6 Quality in Existing Processes... ES-6 Future Research... ES-6 Planned Implementation Activities... ES-6
1.0 Overview and Background
...1-1
Study Objectives...1-2 Focus Areas... 1-2 Study Organization and Approach... 1-2 Scan Team Composition... 1-4 Implementation... 1-4
2.0 Findings and Observations
...2-1
Quality Definitions...2-2 Host States’ Organization Structures...2-3 Host States’ Bridge Office and Highway Design Office Structure... 2-3 California... 2-3 Georgia ... 2-4 Illinois... 2-4 Kentucky... 2-4 Minnesota... 2-5 New York... 2-5
II T A B L E O F C O N T E N T S Ohio... 2-5 Oregon... 2-6 Pennsylvania... 2-6 Washington State... 2-6 Host State Program Size... 2-6 Percentage of Designs Completed In-House or by Consultants... 2-7
3.0 Successful Solutions
... 3-1 Introduction... 3-1 What Is a Successful State?... 3-1 Common Elements Among Host States... 3-1 Training and Communication Channels...3-2 Training Rotations and Staff Training... 3-3 New York... 3-3 Kentucky... 3-3 Ohio... 3-4 California... 3-4 Reporting and Feedback... 3-5 Georgia ... 3-5 California... 3-5 New York...3-7 Regularly Scheduled Meetings Across Disciplines... 3-8 Relationships Between Consultants and the Departments... 3-9 Pennsylvania... 3-9 Kentucky... 3-11 Oregon... 3-11 Review and Approval Processes...3-11 Value Engineering...3-12 Kentucky... 3-12 Third Party Reviews...3-13 Ohio... 3-13 Plan Review and Signoffs...3-15 Pennsylvania... 3-15 California... 3-15 Georgia ... 3-16 New York... 3-16 Single-Point Data Systems... 3-17III
B E ST P R AC T I C E S I N Q UA L I T Y CO N T R O L A N D ASS U R A N C E I N D E S I G N Pennsylvania... 3-17
Kentucky... 3-17 Checklists, Manuals, and Standards... 3-18 Documentation... 3-18 Separate Divisions for QA... 3-20 Kentucky... 3-20 Pennsylvania...3-21 New York... 3-21 Special Contracting...3-22 Design-Build: Minnesota...3-22 Unique Delivery Methods: Oregon... 3-23 Scoping and Environmental Quality... 3-24 Early Involvement of All Players... 3-25 Funded Positions at Regulatory Agencies... 3-26 Environmental Commitment Assurance... 3-27 Consultant Selection and Communication...3-28 Consultant QC/QA Plans...3-28 Construction Reviews and Feedback...3-31 Construction Feedback and Post-Construction Reviews... 3-31 New York... 3-31 Kentucky... 3-32 Quality in Existing Processes... 3-35 Effectiveness and Efficiency in Existing Processes... 3-35 Oregon...3-35 Illinois...3-37
4.0 Conclusions
...4-1
Team Conclusions... 4-1 Future Research... . 4-1 Implementation Activities... . 4-1IV
T A B L E O F C O N T E N T S
List of Appendices
Appendix A: Scan Team Biographical Information
...A-1
Appendix B: Scan Team Contact Information
...B-1
Appendix C: Host Agency Contacts
...C-1
Appendix D: Amplifying Questions and Desk Scan Surveys
...D-1
Appendix E: State Forms and Documents
...E-1
List of Figures
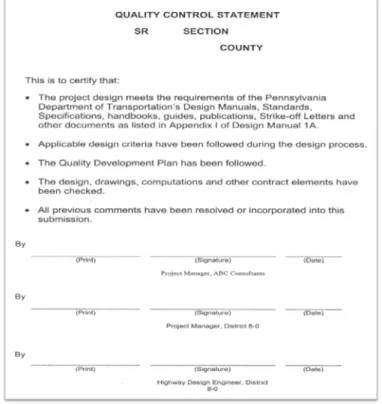
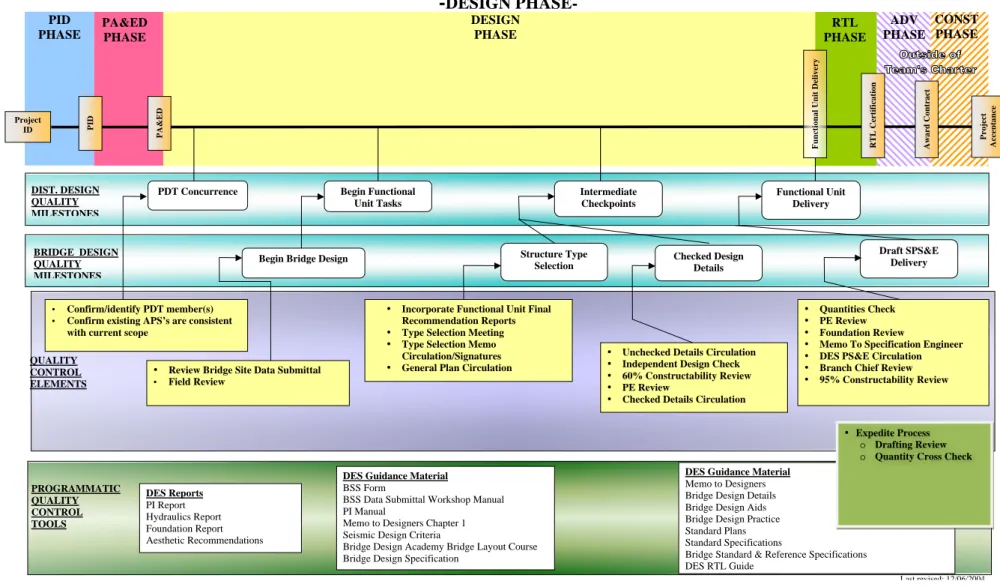
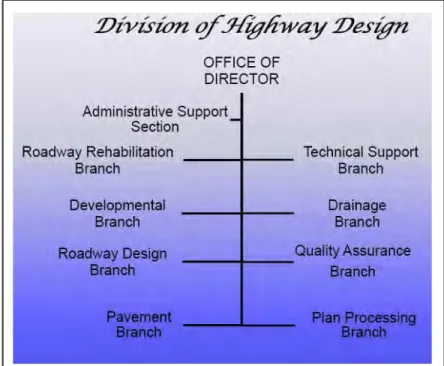
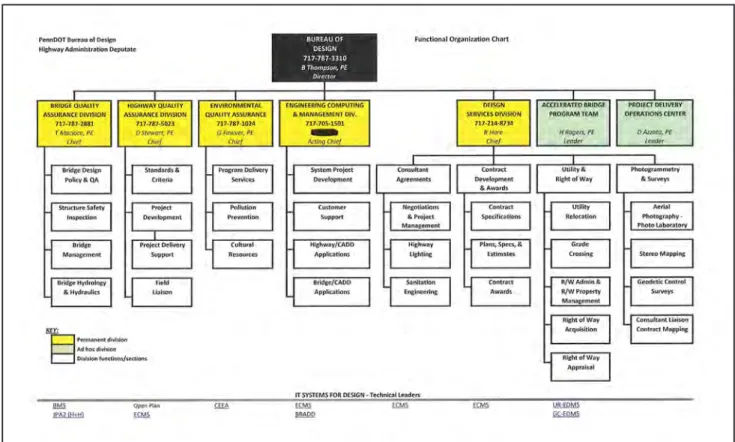
Figure 1.1 States included in the scan... 1-3 Figure 3.1 Caltrans contract quality management flowchart... 3-6 Figure 3.2 KYTC GIS lessons learned database model... 3-12 Figure 3.3 PennDOT QC statement... 3-15 Figure 3.4 Georgia plan title block... 3-16 Figure 3.5 Georgia in-house review stamp... 3-16 Figure 3.6 Quality flowchart for design phase... 3-19 Figure 3.7 KYTC highway design organizational chart... 3-20 Figure 3.8 PennDOT design organizational chart... 3-21 Figure 3.9 NYSDOT Design QA Bureau organizational chart... 3-22 Figure 3.10 GDOT green sheet (actually printed on green paper) example... 3-27 Figure 3.11 GDOT environmental impact table example... 3-28 Figure 3.12 QC/QA requirements of consultants doing bridge design... 3-29 Figure 3.13 Mn/DOT consultant quality plan evaluation criteria... 3-30 Figure 3.14 Average recent responses to NYSDOT’s bid-ability evaluation surveys... 3-31 Figure 3.15 Example KYTC post-construction review fact sheet... 3-32 Figure 3.16 KYTC GIS database screen shot of post-construction reviews... 3-33 Figure 3.17 KYTC GIS database screen shot of post-construction review... 3-34 Figure 3.18 Example analysis from KYTC GIS post-construction review database... 3-34
V
B E ST P R AC T I C E S I N Q UA L I T Y CO N T R O L A N D ASS U R A N C E I N D E S I G N
List of Tables
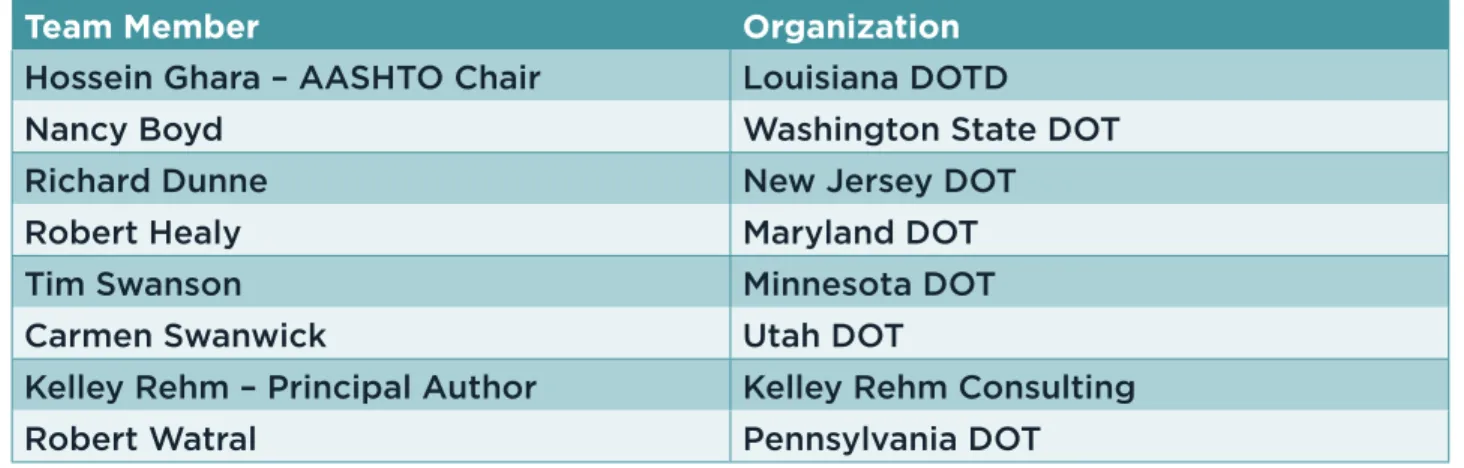
Table 1.1 Scan team members... 1-4 Table 2.1 SAFETEA-LU estimated highway apportionments from 2005–2009... 2-7 Table 2.2 Bridges and highways designed either in-house or by consultants... 2-7 Table 3.1 Caltrans projects selected for IA evaluation... 3-6 Table 3.2 Oregon’s 12-step quality process assessment... 3-36
VII
B E ST P R AC T I C E S I N Q UA L I T Y CO N T R O L A N D ASS U R A N C E I N D E S I G N AASHTO American Association of State Highway and Transportation Officials ACEC American Council of Engineering Companies
AGC American General Contractors
Caltrans California Department of Transportation DOT Department of Transportation
FHWA Federal Highway Administration
GDOT Georgia Department of Transportation GIS Geographic Information System
IA Independent Quality Assurance (Caltrans) IDOT Illinois Department of Transportation
ISO International Organization for Standardization KYTC Kentucky Transportation Cabinet
Mn/DOT Minnesota Department of Transportation
NCHRP National Cooperative Highway Research Program NTSB National Transportation Safety Board
NYSDOT New York State Department of Transportation OBDP Oregon Bridge Delivery Partners
ODOT Oregon Department of Transportation or Ohio Department of Transportation
OTIA III Oregon Transportation Investment Act III State Bridge Delivery Program
PE Professional Engineer
PennDOT Pennsylvania Department of Transportation PM Project Manager
PQAR Project Quality Assurance Report (NYSDOT) PS&E Plans, Specifications, and Estimates
QC/QA Quality Control/Quality Assurance
VIII
A B B R E V I A T I O N S A N D A C R O N Y M S
TRB Transportation Research Board VE Value Engineering
VECP Value Engineering Change Proposals
ES-1
B E ST P R AC T I C E S I N A D D R E SS I N G N P D E S A N D OT H E R WAT E R Q UA L I T Y I SS U E S I N H I G H WAY SYST E M M A N AG E M E N T
Executive Summary
Overview
O
n Wednesday, August 1, 2007, at approximately 6:00 p.m., the I-35W highway bridge over the Mississippi River in Minneapolis, Minnesota, experienced a catastrophic failure. As a result, 1,000 feet of the deck truss collapsed. The National Transportation Safety Board (NTSB) immediately began an investigation into the cause of the collapse. The investigation eventually determined that the collapse of the I-35W bridge initiated with the failure of the gusset plates at the U10 nodes on the truss..The following safety issue, among others, was identified in the investigation:
Insufficient bridge design firm quality control procedures for designing bridges, and insufficient Federal and State procedures for reviewing and approving bridge design plans and calculations. (NTSB, Nov. 2008).
This finding lead the NTSB to recommend to the Federal Highway Administration (FHWA) and the American Association of State Highway and Transportation Officials (AASHTO) that the two organizations work together to develop a more adequate program of quality control and assurance (QC/QA or QA/QC) in bridge design to be used by the states and other bridge owners. The NTSB recommended that this quality program include procedures to detect and correct bridge design errors before the design plans are made final. In response to this recommendation, AASHTO initiated a study to provide a synthesis of current state department of transportation (DOT) practices for QC/QA in the area of bridge design and plan review. This domestic scan was initiated following the NTSB recommendation to build on the initial AASHTO studies. The scope of this scan was expanded to incorporate aspects of quality programs in highway design, bridge design, overall project delivery, and QC/QA for special contract projects, such as design-build. The scan team believes that it is important to look at overall project quality, rather than just focus on bridge design, since there are farther-reaching quality issues, such as higher numbers and greater costs of change orders. Finally, the scan team also investigated the QC/QA practices encompassing project programming and planning stages, environmental permitting, and highway and bridge design. The team also examined lessons-learned feedback loops through construction.
A preliminary analysis conducted through a desk scan refined the list of states based on the size of their programs, the region of the country, the nature of their organization (e.g., decentralized, centralized, and percent of work done by consultants) and innovative practices in QC/QA. The team chose the following states for visits because of innovative or standout QC/ QA programs:
ES-2 E X E C U T I V E S U M M A R Y n New York n Pennsylvania n Kentucky n Minnesota n Georgia n Oregon n California
In addition, the team held separate meetings and teleconferences with the following states to discuss specific components of their QC/QA programs:
n Ohio
n Washington State n Illinois
The scan team developed amplifying questions and sent them to the selected agencies before the visit to allow the host agencies to center their preparations on the specific areas of interest to this scan topic. The team’s amplifying questions fell under the following headings:
n How do you define a successful QC/QA program? n How do you measure the success of your program? n How was your QC/QA process developed?
n What are the documentation and administration procedures for your QC/QA process in design?
n What reviews should be done across disciplines?
n What specific qualifications and education practices can you elaborate on?
n What should QC/QA programs do differently for specialized processes, such as design-build projects or value engineering processes?
n How are QC/QA processes involved in standards, drawings, submissions, and software? n How does your QC/QA design program extend into the construction phase?
Biographical and contact information for the scan team members is provided in Appendix A and Appendix B, respectively. Key contact information for host agencies is provided in Appendix C.
Common Practices
The scan team discovered that many successful QC/QA programs have common practices in place. These common practices are discussed here.
ES-3
B E ST P R AC T I C E S I N Q UA L I T Y CO N T R O L A N D ASS U R A N C E I N D E S I G N Training and Well-Developed Communication Channels
Overall, the visited states agree that quality includes adequate tools, core competency of staff, and good standards. It is important to note the states believe that while documented quality processes are important, it is also important to have experienced, competent staff and good relationships across disciplines. Quality is also affected by political constraints and funding fluctuations. In the present economy, states are all working with less staff, increasing numbers of projects, and tighter schedules. Plan quality is often affected when the staff is less experienced and schedules leave less time for in-depth quality checks. These issues must be taken into consideration when adopting new quality processes or adapting existing ones. A number of states with successful QC/QA programs have developed procedures and training classes specifically focused on QC/QA. One way these states are ensuring quality from their designers is by incorporating training rotations for new staff into their programs. New staff often works designing projects and then gains experience in the field building those projects before taking permanent assignments as designers. The experience earned in the field helps to ensure that future projects will be buildable and biddable.
States with well-developed QA programs also have regularly scheduled meetings with all disciplines involved in the projects, involving construction earlier in the process to ensure con-structability. These set meetings not only help to develop relationships across disciplines, but also help to contribute to lessons learned feedback loops.
Lastly, good communication between consultants and department staff is important in states with successful QC/QA programs. Many of these states hold lessons-learned conferences with their consultants each year or partner with organizations such as the American General Contractors (AGC) or the American Council of Engineering Consultants (ACEC) to hold joint training or information-sharing sessions.
Drivers to Document QC/QA Processes
Documentation of quality processes and procedures and the use of checklists are also common among states with successful QC/QA programs. Several drivers contributing to the need to provide documentation of quality processes were mentioned.
n Higher percentage of designs done by consultant
To maintain consistency, quality processes need to be documented and easily referenced by consultants.
n High rates of retirement and staff turnover
Processes need to be well documented to counter the loss of institutional knowledge when long-tenured staff retires and when newer staff quickly rises to management positions. n Decentralized organizations
More guidance is needed to keep processes standardized and communication channels open when designs are completed in regional or district offices instead of in a central location. n Use of specialty contracting such as design-build
ES-4
E X E C U T I V E S U M M A R Y
More attention is given to QC/QA processes when design-build agreements are used, and this often leads states to look into similar quality processes for traditional design-bid-build projects
Common Review and Approval Practices
Successful states have a few review and approval practices in common in their QC/QA programs, including:
n Checklists outlining processes for designers, reviewers, and contract document compilation are used for each phase of project development.
n Consultants are rated or graded (although not all states use these ratings extensively for consultant selection).
n Decisions about the amount and type of review are made on a risk-based scale, taking into consideration the type and size of the project to determine the depth of the review.
n Although value engineering is done in all states, successful states evaluate the outcomes of these processes and use it as lessons learned feedback for future designs.
n Third-party consultant reviews are done for specialty projects or where DOTs do not have expertise or enough staff to meet deadlines.
n Plan signoffs or PE stampings are done at many different levels, including signoffs on original design, review, and even for design changes that are done in construction.
n States are moving to single-point data systems where multiple users and disciplines can look at and analyze documents to determine problem areas and make improvements in processes.
Summary of Initial Findings and Recommendations
The scan team noted that in successful states, it is important to have upper management support in the development, documentation, and use of a QC/QA program. Again, it is clear that adequate tools and documentation can lead to quality plans, but only with high-quality people and expertise behind the designs.
One of the biggest challenges each of the visited states faced was showing the benefit of time spent on QA processes. They asked, “How can we convey or market to decision makers that these quality programs are worth time and funding?” Overall, a successful quality program should be able to show that better quality in plans equals longer life and cost savings on projects. Many states recognize that a quality set of plans does not always equal a quality design, and that sustainability, constructability, and other considerations should be taken into account to really instill quality into a project.
Overall Successful Strategies
The following sections describe what the scan team determined to be successful strategies utilized by the visited states to ensure quality in their design plans. The scan team recognizes
ES-5
B E ST P R AC T I C E S I N Q UA L I T Y CO N T R O L A N D ASS U R A N C E I N D E S I G N
that QC/QA programs that work well for one state may not work well for others, since there are large variations in organizational structure, political constraints, and funding availability throughout the states. For this reason, the team did not identify best practices, instead
choosing to identify strategies that were successful in the given circumstances of each state.
Checklists, Manuals and Standards
All state DOTs, not just those with successful QC/QA programs, use checklists, process manuals, and standard details and drawings. However, successful states use these tools for communication, training, and regular re-evaluation of the processes. One state described the practice of “review training” for engineers who are performing QC reviews on plans. This training concentrates on teaching reviewers the best ways to identify errors or omissions, how to use manuals and checklists, and how to successfully convey comments back to the designer. Some states have instituted separate divisions or bureaus specifically for QA. These divisions provide centralized points of contact on quality and provide a group of experienced individuals that can maintain and re-evaluate quality processes that are documented within manuals. One other practice found in several successful states is the use of title blocks on plan sheets that clearly define the designer and the reviewers, as well as include sign-offs for when reviews are completed. This easily implemented, simple method ensures that designers and reviewers take responsibility for the quality of the plans.
Scoping and Environmental
Successful states include all parties involved in design and construction early on in the process. Several of the states the team visited include environmental, right-of-way, utilities, designers, any other relevant agencies, and even construction, in the scoping process.
Continued involvement throughout the full design phase of all players involved is important and includes scheduled meetings at key points in the design, during construction, and for post-construction feedback.
Successful states also found that it was helpful to have state-funded positions located at regulatory agencies to help expedite scheduling and reduce external agency bottlenecks in the design process.
Another successful strategy found during the scan was the practice of including “green sheets” or environmental tables within actual plan sets. These sheets (which one state actually prints on green paper) or tables serve as a checklist for the contractor and resident engineer to ensure that all environmental commitments are met on each project.
Value Engineering Feedback
Value engineering (VE) is common and mandated for some projects in all states. However, many successful states are using feedback from their VE processes to analyze trends and make changes to their design processes. Some states have been able to involve contractors in their
ES-6
E X E C U T I V E S U M M A R Y
processes, although legal issues make this a bit more complicated. Again, the VE process is not necessarily a best or unique practice; however, what is done with the information and feedback can help to ensure improved quality in future designs.
Consultant Selection and Communication
Successful states ensure the quality of their consultants’ projects through thorough selection processes and good communication channels. Successful states often require submittal of consultant quality plans before they can be prequalified to perform work for the states, and many require project-specific quality plans to be submitted with proposals.
Construction Reviews and Feedback
Involving key players from construction early on in the design process is a successful strategy in many states. Early involvement is important to avoid comments on constructability at the end of product production when it is not practical to make changes. It is also important to look at feedback during the construction process and information provided during post-construction reviews. Several states survey construction administration staff and contractors to solicit feedback on design and plan quality. This information can show trends, such as the causes of the most change orders, and outline needed changes to standard drawings and manuals.
Quality in Existing Processes
Successful states look at improving quality in existing processes, not necessarily adding more processes. Examining existing processes and formalizing them through documentation can help identify unneeded steps and highlight areas where the process can be improved. After improvements are made, performance measures are developed. One state has looked at all of its checklists to determine the optimal amount of items that should be included, while another state has developed a series of steps for each discipline to go through to help them document all their processes. These actions help to add focus and efficiency to quality programs.
Future Research
The scan team found that in many cases it is hard to quantify the benefit of QC/QA
procedures. In the future, it would be useful to identify the marginal benefit of more QC. For example, if another hour is spent reviewing a set of plans, how much quality does that add to the overall project? This also requires determination of how to measure that incremental increase in quality and identification of useful performance measures.
Planned Implementation Activities
The scan team recognizes the importance of implementing the findings of its review. Many important successful solutions and strategies were identified and would be of benefit to other state and local transportation agencies. Included in the team’s proposed implementation plan are the following:
B E ST P R AC T I C E S I N Q UA L I T Y CO N T R O L A N D ASS U R A N C E I N D E S I G N
ES-7
1. Develop a webinar – The team intends to present successful solutions to a large audience through webinar training sessions.
2. Develop and make presentations to AASHTO and Transportation Research Board
(TRB) committees – These more in-depth presentations can be tailored to specific groups.
3. Implement findings locally – Ideas and successful solutions can be brought directly into the team members’ states and host states.
4. Identify future research – The scan identified findings and issues that could be
further investigated. Research proposals for these needs will be written and presented to supporting organizations, such as AASHTO or TRB committees.
5. Draft a letter to the FHWA to inform it of scan findings – The scan team will outline the scan findings in a letter to the FHWA’s Bridge Technology Office to assist in the
development of the Technical Advisory for QC/QA in Bridge Design that will be developed in response to recommendations by NTSB.
6. Develop a Web site – A Web site dedicated to QC/QA processes will make information more readily available.
7. Identify places to submit journal articles or post links to the final report – The team intends to submit articles to academic journals as well as to trade magazines and newsletters.
1-1
B E ST P R AC T I C E S I N Q UA L I T Y CO N T R O L A N D ASS U R A N C E I N D E S I G N
Study Objectives
T
ransportation agencies are constantly under pressure to do more with less whendelivering projects. Influences such as the rising levels of congestion on U.S. roadways, shortfalls in funding, and loss of long-time employees to retirement without replacement are contributing to this trend.
The impact of these trends on the quality of projects has not gone unnoticed. The Wednesday, August 1, 2007, collapse of the I-35W highway bridge over the Mississippi River in
Minneapolis, Minnesota, only brought more concern. The quality of design processes were questioned when the National Transportation Safety Board (NTSB) began an investigation that eventually lead to the discovery that the collapse of the I-35W bridge initiated with the failure of the gusset plates at the U10 nodes on the truss.
The following safety issue, among others, was identified in the investigation:
Insufficient bridge design firm quality control procedures for designing bridges, and insufficient Federal and State procedures for reviewing and approving bridge design plans and calculations. (NTSB, Nov. 2008)
This finding lead the NTSB to recommend to the Federal Highway Administration (FHWA) and the American Association of State Highway and Transportation Officials (AASHTO) that the two organizations work together to develop a more adequate program of quality control and assurance (QC/QA or QA/QC) in bridge design to be used by the states and other bridge owners. The NTSB recommended that this quality program include procedures to detect and correct bridge design errors before the design plans are made final. In response to this recommendation, AASHTO initiated a study to provide a synthesis of current state department of transportation (DOT) practices for QC/QA in the area of bridge design and plan review. This domestic scan was initiated following the NTSB recommendation to build on the initial AASHTO studies. The scope of this scan was expanded to incorporate aspects of quality programs in highway design, bridge design, overall project delivery, and QC/QA for special contract projects, such as design-build. The team believes that it is important to look at overall project quality, rather than just focus on bridge design, since there are farther-reaching
quality issues, such as higher numbers and greater costs of change orders. Finally, the scan team also investigated the QC/QA practices encompassing project programming, planning stages, environmental permitting, and highway and bridge design. The team also examined lessons-learned feedback loops through construction.
C H A P T E R 1
1-2
C H A P T E R 1 : O V E R V I E W A N D B A C K G R O U N D
Focus Areas
The scan team felt that while all states are delivering quality projects, some states are doing this more effectively and efficiently. It was determined that states that are showing more developed quality programs would have common successful solutions to share. These successful solutions fall into the following subject areas:
1. Training and Communication Channels – Communication between all parties involved in a project, as well as well-trained staff, make for better overall quality.
2. Review and Approval Processes – Review processes that delineate who performs the review, what types of review are performed, and how reviews are documented, contribute to overall quality of projects.
3. Checklists, Manuals, and Standards – The team was interested in states that had well-documented practices that were easy to follow and not cumbersome to overall production. Many examples of useful tools were presented during the scan.
4. Scoping and Environmental Quality – The quality process starts early in the scoping, and then continues during the environmental phases and through the final design. States visited showed innovative QC/QA processes within these early phases.
5. Consultant Selection and Communication – QC/QA for consultant designs were also discussed with host states to determine successful solutions for ensuring consistency and high quality from consultants.
6. Construction Reviews and Feedback – Although the scan team’s focus was on quality in design processes, the team found that overall quality designs took into account feedback from construction processes and involved construction personnel early on in the design. 7. Quality in Existing Processes – Many states with successful quality programs look for
ways to improve and enhance existing processes instead of adding additional steps to the design progression.
This report discusses each of these subject areas.
Study Organization and Approach
A detailed desk scan was prepared to help the team efficiently find and access agencies with successful solutions and processes in QC/QA. For the purpose of the desk scan, two separate surveys, one related to bridge design and the other related to highway design, were sent to all 50 states (see Appendix D for these survey questions). From the survey results, team members determined which state DOTs would be candidates for scanning visits and interviews.
The scan team decided to look for states that demonstrated well-documented QC/QA processes and exhibited innovative or standout processes for ensuring quality in their designs. The team also considered the DOT’s organizational type (e.g., centralized or decentralized), the state’s location (i.e., its region of the U.S.), and the size of the transportation funding programs. Team members wanted to make sure that all regions of the U.S. were represented, as well as states with both large and small overall funding programs.
1-3
B E ST P R AC T I C E S I N Q UA L I T Y CO N T R O L A N D ASS U R A N C E I N D E S I G N
The following states were chosen for visits because they were found to have innovative and well-developed QC/QA processes:
Eastern U.S. Western U.S. Georgia New York Pennsylvania California Oregon Washington State Midwest U.S. Web Conferences Kentucky
Minnesota Illinois Ohio
The scan team developed amplifying questions for the selected states to consider and set the stage for the visit. The amplifying questions fell under the following headings:
Figure 1.1 States included in the scan
1-4
C H A P T E R 1 : O V E R V I E W A N D B A C K G R O U N D
n How do you define a successful QC/QA program? n How do you measure the success of your program? n How was your QC/QA process developed?
n What are the documentation and administration procedures for your QC/QA process in design?
n What reviews should be done across disciplines?
n What specific qualifications and education practices can you elaborate on?
n What should QC/QA programs do differently for specialized processes, such as design-build projects or value engineering (VE) processes?
Scan Team Composition
Scan team members (see Table 1.1) were selected to represent diverse knowledge and to represent all areas of the country.
Team Member Organization
Hossein Ghara – AASHTO Chair Louisiana DOTD
Nancy Boyd Washington State DOT
Richard Dunne New Jersey DOT
Robert Healy Maryland DOT
Tim Swanson Minnesota DOT
Carmen Swanwick Utah DOT
Kelley Rehm – Principal Author Kelley Rehm Consulting
Robert Watral Pennsylvania DOT
Implementation
The main objective of the domestic scan program is to advance innovative actions and
publicize successful solutions by sharing the information gained through scan team visits. The team evaluated the information gathered and developed an execution plan that can be used at the federal, state, and local levels. The plan, including implementation details, is included in Planned Implementation Activities
2-1
B E ST P R AC T I C E S I N Q UA L I T Y CO N T R O L A N D ASS U R A N C E I N D E S I G N
T
he scan team was presented with a wealth of information and was impressed with thelevel of each host agency’s efforts to ensure that the best information and practices were highlighted and shared. The scan team gathered, reviewed, and analyzed much information from each state visited.
While many successful solutions were common among the visited states, the differences in organizational makeup of each of the states preclude the team from calling these best practices. What may be best for one state and its organizational structure may not work successfully for all states. For this reason, innovative practices are described as successful solutions, since these practices are successful for their given states and may give other states ideas of how this innovative thinking might work for them. Key contact information for host agencies is provided in Appendix C.
The next several sections present the successful solutions that the scan team identified: n Training and Communication Channels
n Review and Approval Processes n Checklists, Manuals, and Standards n Scoping and Environmental Quality n Consultant Selection and Communication n Construction Reviews and Feedback n Quality in Existing Processes
The following sections of this report discuss each of these successful solutions and the next steps for each. Conclusions discusses the team’s final thoughts and provides information about needed Future Research and planned Implementation Activities. The latter includes a plan the scan team has drafted to ensure that the findings of this scan are disseminated to all interested parties so that they can implement similar successful solutions in their own organizations.
Lastly, a series of appendices contain important reference information relevant to this scan: n Appendix A – Scan Team Biographical Information
n Appendix B – Scan Team Contact Information n Appendix C – Host Agency Contacts
C H A P T E R 2
2-2
C H A P T E R 2 : F I N D I N G S A N D O B S E R VA T I O N S
n Appendix D – Amplifying Questions and Desk Scan Surveys n Appendix E – State Forms and Documents
Quality Definitions
The first question the scan team addressed was, “How do we define quality?” This question can be answered in many different ways, depending on the point of view and the situation. The team agrees that quality programs include adequate tools, core competencies, and good standards; however, political and economical issues often hinder the quality process.
Another question the scan team pondered was, “How do I show the benefit of quality?” The issue of how best to convey or market to the decision makers that quality programs are worth time and funding was considered throughout all the host state visits. How can we positively state that these quality programs equate to longer life of the infrastructure?
The scan team noted that in successful states it is important to have the support of upper management in the development, documentation, and use of a QC/QA program. It is clear that adequate tools and documentation can lead to quality plans, but only with quality people and expertise behind the designs. Overall, a successful quality program should be able to show that better quality in plans equals longer life and cost savings on projects. Many states recognize that a quality set of plans does not always equal a quality design and that sustainability, constructability, and other considerations should be taken into account to instill quality into a project.
New York State DOT (NYSDOT), the first DOT visited on this scan, prompted the team with a few thoughts and questions on quality that summarized what the scan overall was looking to answer. Bob Dennison, the New York State highway engineer, asked, “Does a perfect set of plans equal quality? Can you produce a perfect set? Should you? How much time should we take to generate a set of plans?” All these questions become important when considering the current environment of reduced staff and funding and increased demand.
NYSDOT also challenged the team to determine an adequate measure of quality. Does quality equal the time taken to complete documents, meeting deadlines, or having final estimates match bid pricing? How do we know if the final document is a good design? How much is right and how much is personal preference? The team members posed these questions to each of the host states. Although this scan may not answer all these questions, the host states all gave significant insight to the team. The findings are presented here.
NYSDOT presented these simple, complete definitions of QA/QC:
n Quality Assurance – Actions to prevent defects or make improvements in the policies, procedures, and systematic actions established to ensure quality
n Quality Control – Actions to catch defects; the independent checking of work and use of control points (approvals) to ensure a high level of confidence that each product will meet expectations
2-3
B E ST P R AC T I C E S I N Q UA L I T Y CO N T R O L A N D ASS U R A N C E I N D E S I G N
The team also agreed that Oregon’s QA/QC definitions were notable:
n Quality Assurance – All those planned and systematic actions necessary to provide adequate confidence that a structure, system, or component will perform satisfactorily in service
n Quality Control – Routine operational activities designed to consistently produce a predictable result
Each agency visited had slightly different opinions on the definitions of QC/QA, but all had carefully thought out quality programs.
Host States’ Organization Structures
To understand why practices in host states were successful, it is first important to understand the organizational structures of each agency. The following gives background information on the host states to better put successful solutions into context. Each host state’s organizational makeup for both bridge and highway design offices is described. The funding program size for each state’s transportation programs and the percentage of work performed by consultants for both bridges and highways is also described. It is important to note that all of the visited states have regional or district offices doing some design work, so there are no purely centralized states; however, some visited states do have all bridge design work located in a central office.
Host States’ Bridge Office and Highway Design Office Structure
California
Caltrans (California DOT) is geographically divided into 12 districts. For highway design, Caltrans administers design through five individual districts and two regional offices (North and Central Regions). The regional offices typically centralize the design operations in one of the districts (e.g., North Region has District 1, 2, and 3; design resides in
District 3.) There are seven design offices statewide, and these offices review consultant engineering plans. A map on the Caltrans Web site1 shows the counties represented by
each of the state’s 12 districts.
The Caltrans Bridge Design Offices are for the most part centralized. Bridge design within Caltrans is performed in a subdivision called Structures Design, which is one of eight subdivisions that form the Division of Engineering Services, located in Sacramento. Structures Design comprises approximately 370 staff and includes mostly design engineers and structural design technicians, who do detailing work. Of the six Structures Design offices, five do project direct work and one provides corporate support (i.e., guidance and technical support). Each office consists of between 60 to 80 staff and is made up of four or five branches. Each branch is made of about three-quarters structural design technicians and one-quarter registered engineers.
2-4
C H A P T E R 2 : F I N D I N G S A N D O B S E R VA T I O N S
The main Caltrans bridge design office is located in Sacramento, with two smaller regional design groups located in Los Angeles County and in the city of Oakland. Most of the consul-tant-designed bridge plans are reviewed in the main office in Sacramento.
California has over 50,000 lane miles of roadway, 12,940 structures on the state highway system (and almost as many on the local roads), as well as 26 tunnels and 9 large bay-crossing bridges. Unique to California, in addition to 58 counties and 18 metropolitan planning
organizations, are 21 “self-help” counties. These counties have passed their own sales tax measures to support transportation and collectively contribute billions of dollars toward transportation in California ($3.9 billion in 2009, which was more than the SAFETEA-LU2
estimated highway apportionment). Caltrans does project development oversight on all projects on the state highway system.
Georgia
The Office of Roadway Design, located at the Georgia DOT (GDOT) headquarters in Atlanta, traditionally designs the major arterials and freeway projects. District Design Offices design minor projects (e.g., intersection improvements, turn lanes, passing lanes, and some minor collector and arterial projects).
The Office of Bridge and Structural Design conducts all in-house structural design. All structural plans (in-house or consultant) are reviewed internally by the GDOT state bridge engineer and/or the assistant state bridge engineers. The Bridge Office is centrally located in Atlanta. GDOT has no district bridge offices. The central office reviews all consultant bridge plans.
Illinois
In Illinois, highway design offices are located in each of the nine district offices statewide. The district offices review all plans, and the central office is responsible for finalizing contract documents.
The Bureau of Bridges & Structures, located in the central office, is responsible for overseeing all bridge-related policies and approvals. Consultant bridge plans are reviewed at the central office within the Bureau of Bridges & Structures.
Kentucky
The state’s Division of Highway Design is centrally organized in Frankfort. Liaisons from the Roadway Design Branch are assigned to various districts. Twelve districts comprise the Kentucky Transportation Cabinet (KYTC) across the state, and each district has a Roadway Design Section under the District’s Project Development Branch. Both district and central office personnel review consultant plans.
2 Safe Accountable Flexible Efficient Transportation Equity Act: A Legacy for Users, http://www.fhwa.dot.gov/safetealu/
2-5
B E ST P R AC T I C E S I N Q UA L I T Y CO N T R O L A N D ASS U R A N C E I N D E S I G N
The Bridge Office is centrally located, and this location performs all structure design work and structural consultant work review.
Minnesota
For highway design, Minnesota DOT (Mn/DOT) is decentralized, with district offices doing highway design and plan review. The central office compiles final contract documents and reviews them for completeness.
In Minnesota, bridge design remains a central function. The Bridge Office either prepares the plans or retains a consultant to prepare them. This office directs all bridge designs and reviews all consultant plans.
New York
Like Mn/DOT, NYSDOT is also decentralized. The department includes 11 regional offices, where most production takes place, along with a central office in Albany that provides design policy and production support for the regional offices. Each regional office includes both highway and bridge design functions. NYSDOT’s main office incorporates the Office of Structures, which provides expertise and bridge design services, along with providing structural design standards and related policies. In addition, the main office includes the Design Services Bureau, which functions as an internal highway design consultant to the 11 regional offices. New York’s Project Development
Manual3 identifies the regional and main offices’ roles.
Personnel in the regional office where the project is located review the plans. The Design QA Bureau, Office of Design, and other functional units (i.e., technical experts) in the main office perform additional reviews.
The Office of Structures is centrally located in Albany and is responsible for developing structures-related policies and procedures for the DOT. The Office of Structures comprises four bureaus: Structure Design, Structure Design QA, Structure Evaluation Services, and Structural Engineering Services. There are regional Structures Units in each of the 11 regional offices, each with its own working group for bridge inspection, project development, and design. The Structure Design Bureau, private consultants, and some regional offices perform bridge design. The Structure Design QA Bureau performs most detailed reviews of consultant engineering bridge plans.
Ohio
The scan team chose Ohio solely to discuss its quality process in Bridge Design. The Ohio Bridge Design Office is decentralized. Some District bridge offices have strong technical abilities, while others do not have the same high level. Ohio has 12 district offices that are each responsible for the bridge inspection program and delivering design plans. Consultant
3 NYSDOT Project Development Manual,
2-6
C H A P T E R 1 : I N T R O D U C T I O N
bridge plans are reviewed at the central or district office, depending on their technical capabilities and available resources.
Oregon
For highway design, Oregon DOT (ODOT) has five regional offices, which also include offices for roadway design and reviews. ODOT headquarters is also available for additional consultation and review as needed. Regional engineering staff members are the primary reviewers of consultant engineering plans.
For bridge design, one central ODOT Technical Services Bridge Engineering Section contains the bridge design standards and specialty staff. Five regional field offices are located
throughout the state where most of the bridge design work is performed. Consultant bridge plans receive a first-level review at the regional offices with QA, or second-level, reviews being done by standards and specialty staff at the central Bridge Engineering Section.
Pennsylvania
For highway design, Pennsylvania DOT (PennDOT) is a decentralized organization with 11 engineering districts and a central office. Each district has a Design Unit, and the central office has a Bureau of Design. District Design Units review consultant and in-house plans from a geometric perspective. Then, depending on the plans’ complexity, by the central office’s Bureau of Design. Depending on staffing and urgency, central office design engineers in the district office, at the consultant’s office, or in the central office review consultant and in-house plans for right-of-way and construction from a plans presentation perspective. Minor projects not involving right-of-way are typically delegated to the districts.
Bridge design at PennDOT is decentralized, with 11 engineering districts and a central office. Within the central office Bridge Unit is the Bridge QA Division, which provides policy development and specialized technical assistance to the Engineering districts. The engineering districts review consultant-developed designs for noncomplex bridges. Both the engineering district and the central office review complex bridge designs (e.g., curved girder bridges or other major bridges).
Washington State
Roadway design is decentralized at Washington State DOT (WSDOT). Plans are developed and managed within regional offices around the state. There are nine regional/divisional offices; within each individual region, project offices manage and administer design work. In general, the region itself performs design/plan review, including consultant plans.
The Bridge and Structures Office is centralized. There are no district or regional bridge offices within the state. The central bridge office reviews consultant-prepared bridge plans.
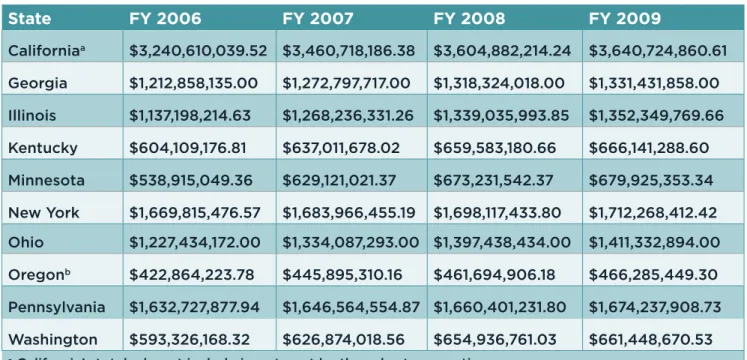
Host State Program Size
The scan team visited states with a wide range of available funding (see Table 2.1). California had the largest program, while Oregon had the smallest.
2-7 B E ST P R AC T I C E S I N Q UA L I T Y CO N T R O L A N D ASS U R A N C E I N D E S I G N State FY 2006 FY 2007 FY 2008 FY 2009 Californiaa $3,240,610,039.52 $3,460,718,186.38 $3,604,882,214.24 $3,640,724,860.61 Georgia $1,212,858,135.00 $1,272,797,717.00 $1,318,324,018.00 $1,331,431,858.00 Illinois $1,137,198,214.63 $1,268,236,331.26 $1,339,035,993.85 $1,352,349,769.66 Kentucky $604,109,176.81 $637,011,678.02 $659,583,180.66 $666,141,288.60 Minnesota $538,915,049.36 $629,121,021.37 $673,231,542.37 $679,925,353.34 New York $1,669,815,476.57 $1,683,966,455.19 $1,698,117,433.80 $1,712,268,412.42 Ohio $1,227,434,172.00 $1,334,087,293.00 $1,397,438,434.00 $1,411,332,894.00 Oregonb $422,864,223.78 $445,895,310.16 $461,694,906.18 $466,285,449.30 Pennsylvania $1,632,727,877.94 $1,646,564,554.87 $1,660,401,231.80 $1,674,237,908.73 Washington $593,326,168.32 $626,874,018.56 $654,936,761.03 $661,448,670.53
a California’s totals do not include investment by the sales tax counties.
b Oregon’s totals do not include Oregon Bridge Delivery Partners’ $1.3 billion investment over 10 years.
Percentage of Designs Completed In-House or by Consultants
The processes each state use for QC/QA is greatly affected by the amount of design work that is done by consultants. The following table shows how much work is done by consultants in each of the host states according to number of projects. These numbers would be different if they were looked at from a total-cost-per-project point of view. Work performed by consultants is often for higher dollar, more complex projects.
State
Bridge design Highway design
In-house design Consultant design In-house design Consultant design
California 70 30 91 9 Georgia 40 60 50 50 Illinois 25 75 30 70 Kentucky 50 50 15 85 Minnesota 50 50 50 50 New York 50 50 90 10 Ohio 10 90 — — Oregon 50 50 — — Pennsylvania 40 60 20 80 Washington State 90 10 — —
Table 2.1 SAFETEA-LU estimated highway apportionments from 2005–2009
3-1
B E ST P R AC T I C E S I N Q UA L I T Y CO N T R O L A N D ASS U R A N C E I N D E S I G N
Introduction
What Is a Successful State?
F
or this domestic scan, successful states were not chosen because of a particular measure of quality plans. The team did not collect specific data on quality measures (e.g., number of change orders, letting dates met, or other measures that may be considered a measure of quality) for the desk scan. As mentioned in the Introduc-tion, all states were surveyed on their QC/QA processes for both highway and bridge design (see Appendix D for the survey questions). These surveys were included in a desk scan report, and the team refined the list of states based on their program size, their region of the country, the nature of their organization (e.g., decentralized, centralized, and percent of work done by consultants), and noted innovative practices in QC/QA.While this scan may not have specific measureable data showing that visited states’ quality processes are “successful,” the scan team believes that these states have innovative ideas; logical, well-defined processes; and well-written guidance documents that lead to successful quality programs.
Common Elements Among Host States
A number of states with successful QC/QA programs have developed procedures and training classes specifically focused on QC/QA. Another common element includes having regularly scheduled meetings with all disciplines involved in the projects, with earlier involvement from construction to ensure constructability. Lastly, good communication between consultants and department staff is important in successful states. Many states hold lessons learned conferences or meetings with their consultants each year.
Documentation of quality processes and procedures and use of checklists are common among successful states. Several drivers contributing to the need to provide documentation of quality processes were mentioned:
n Higher percentage of designs done by consultant
To maintain consistency, quality processes need to be documented and easily referenced by consultants.
n High rates of retirement and staff turnover
Processes need to be well documented to counter the loss of institutional knowledge when
C H A P T E R 3
3-2
C H A P T E R 3 : S U C C E S S F U L S O L U T I O N S
long-tenured staff retires and when newer staff quickly rises to management positions. n Decentralized organizations
More guidance is needed when designs are completed in regional or district offices instead of in a central location to keep processes standardized and communication channels open. n Use of specialty contracting such as design-build
More attention is given to QC/QA processes when design-build agreements are used, and this often leads states to look into similar quality processes for traditional design-bid-build projects
Finally, successful states have a few review and approval practices in common in their QC/ QA programs:
n Checklists outlining processes for designers, reviewers, and contract document compilation are used for each phase of project development.
n Consultants are rated or graded (although not all states use these ratings extensively for consultant selection).
n Decisions about the amount and type of review are made on a risk-based scale, taking into consideration the type and size of the project to determine the depth of the review. n Although VE is done in all states, successful states evaluate the outcomes of these
processes and use it as lessons learned feedback for future designs.
n Third-party consultant reviews are done for specialty projects or when DOTs do not have sufficient expertise or staff to meet deadlines.
n Plan signoffs or professional engineer (PE) stampings are done at many different levels, including signoffs on original design, review, and even for design changes that are done in construction.
n States are moving to single-point data systems where multiple users and disciplines can look at and analyze documents to determine problem areas and make improvements in processes.
The following sections give more information on these common elements, as well as on innovative, standout processes that visited states presented during the scan.
Training and Communication Channels
A number of states with successful QC/QA programs have developed procedures and training classes specifically focused on QC/QA. One way successful states are ensuring quality from their designers is to incorporate training rotations for new staff into their programs as well as training for all staff on ways to improve processes. Reporting on quality processes and awards for quality work helps to keep communication channels open throughout the agencies and helps to provide feedback on the QC/QA processes to all staff. States with well-developed QA programs also have regularly scheduled meetings with all disciplines involved in the projects, with earlier involvement from construction to
3-3
B E ST P R AC T I C E S I N Q UA L I T Y CO N T R O L A N D ASS U R A N C E I N D E S I G N
ensure constructability. These set meetings not only help to develop relationships across disciplines, but also help to contribute to lessons learned feedback loops.
Lastly, good communication and relationships between consultants and department staff is important in successful states. Many states hold lessons learned conferences with their consultants each year or partner with organizations such as the AGC or the ACEC to hold joint training or networking meetings.
Training Rotations and Staff Training
The scan team recognizes that one of the first steps to quality in design is to have quality people trained well in core competencies. Several of the visited states had innovative training and mentoring programs for new staff as well as continuing education and training in quality processes for existing staff.
New York
The NYSDOT mentoring program is one example of this type of innovative training. The mentoring program is voluntary and open to all main office personnel. The goal of the program is to assist in the development of employee skills, techniques, and perspectives, and to help develop managers and leaders within the DOT. The program provides guidance in career planning, personal development, and help in achieving the department’s corporate goals. Mentors and protégés are partnered on a one-to-one basis, matching mentors with certain skills/experiences with protégés who have a desire to attain those skills/experiences. The partners work together to set goals and identify activities that will assist the protégé in meeting his or her goals. The partners determine the duration of the mentoring relationship. New York’s Office of Design has a Workforce Development Program whose goal is ensuring that regional and main office design staff has the skills, knowledge, and proficiency necessary to develop and deliver quality, timely, and cost-effective capital projects. The program:
n Focuses on critical competencies that drive performance
n Provides a tool to streamline the process of matching competencies to employees based on job roles
n Includes a combination of technical, business, and leadership competencies n Measures proficiency levels as fundamental, experienced, and expert
n Provides a basis to measure current knowledge and identify clear objectives for future development
In total, the program includes more than 100 competencies in 16 categories, ranging from technical topics like Estimating, Bridge Design and Work Zone Traffic Control to Business, Communication, and Coordination skills.
3-4
C H A P T E R 3 : S U C C E S S F U L S O L U T I O N S
design staff that places the designers in the construction field for at least one construction season. This program allows new design staff to learn valuable lessons, such as specific methods of construction, the need for clarity within plans, a better understanding of the specifications, and an understanding of realistic precision in the field and a better idea of the time needed to construct a project.
Kentucky
Kentucky is another host state that provides innovative ways to secure the best and brightest civil engineering students and train them in core competencies. The Kentucky Transportation Cabinet (KYTC) awards 10 to 20 new scholarships each year to qualifying students who are interested in attending the University of Kentucky or Western Kentucky University to obtain a bachelor of science degree in civil engineering. Students may also attend the University of Louisville J. B. Speed School of Engineering or attend pre-engineering courses at Kentucky State University or through the Kentucky Community and Technical College system and finish their bachelor of science degree in civil engineering at one of the accredited institutions.
The program provides students with a stipend that can be used for tuition or living
expenses in exchange for the student agreeing to work for the KYTC upon graduation. The scholarship is on a one-to-one basis, so that if a student accepts the scholarship for one year, he or she agrees to work for the Cabinet for one year after graduation. The program also provides each student the opportunity for summer employment with the Cabinet, most often as construction inspectors. In this way, students often have extensive construction experience before they graduate.
This program began in 1948, and the KYTC has awarded nearly 1,700 scholarships, amounting to over $12 million in scholarships since its beginning. Each year 80
scholarship openings are filled with returning students and new students. Once students graduate, they are placed in training rotations that allow them to work three to four months in different divisions of interest (e.g., design, materials, construction, or planning) for one year. Once they choose a specialty, they are given a one-year intensive assignment before being permanently assigned.
Ohio
Ohio explained to the team an innovative process described as “review training” for
engineers who are performing QC reviews on plans. This training concentrates on the best ways to identify errors or omissions and the use of manuals and checklists. It also teaches reviewers how to successfully convey comments back to the designer.
California
Training continues for more experienced staff and extends into the construction phases in California’s Resident Engineer Certificate program. This program leads to consistent
3-5
B E ST P R AC T I C E S I N Q UA L I T Y CO N T R O L A N D ASS U R A N C E I N D E S I G N
definitions of design error. Consistent handling of errors and omissions is intended to improve the performance of Caltrans construction staff, reinforce partnering, and help ensure consistent enforcement of Caltrans standards. The program recognizes certificate holders for having a certain level of knowledge and for the added effort they made to improve their skills so that they can provide even better service to Caltrans and its customers. As the resident engineers are responsible for administering the construction contract, these certified engineers are better prepared to identify when problems in the field are design errors or omissions. They are trained in ways of providing feedback information, working with designers to make sure that these errors are not repeated, and providing feedback to improve quality in future projects quality.
All of the above-mentioned states have programs that allow new staff to be well trained and mentored in the core competencies that are needed to produce quality highway and bridge designs.
Reporting and Feedback
Quality processes do not begin and end with review of designs and contract documents. Feedback and reporting are needed to ensure quality in future projects and instill
effectiveness and efficiency into processes. Best practices and successful solutions within agencies should be recognized, reported, awarded, and incorporated into existing processes.
Georgia
Georgia has developed a process to identify best practices in design within its district offices and disseminate them to the entire state. The Office of Road Design scores individual in-house design groups across the state twice a year, identifying best practices by looking at these higher scoring groups or by identifying high performers based on recommendations from project managers (PMs). These best practices outline what these groups are doing differently, whether it is providing specific training, using checklists, or other program innovations. The Office of Road Design identifies high performers within district design offices, bridge design offices, and traffic operations offices and interviews them twice a year to determine if their practices are candidates for statewide implementation to improve quality.
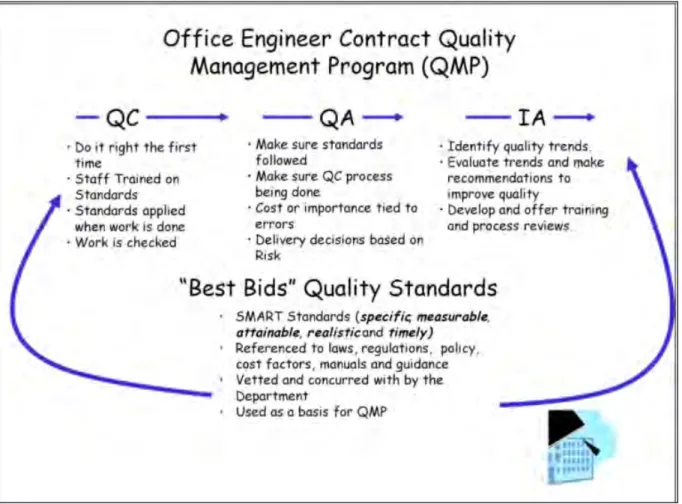
California
Caltrans has developed a Contract Quality Management Program, because it also knows that feedback on processes is the key to knowing if a quality program is working. The Caltrans program defines not only QC and QA, but also independent QA (IA). As shown in Figure 3.1, this process leads to what Caltrans has termed “Best Bids” Quality Standards. n QC – Design engineers are responsible for making sure that the design is correct. n QA – PMs make sure that standards are followed and the QC process is being done. n IA – The office engineer (program management) identifies quality trends and makes
3-6
C H A P T E R 3 : S U C C E S S F U L S O L U T I O N S
The IA evaluation is done on a sample number of projects each year and in certain instances is done for specific projects (see Table 3.1). The project evaluation process includes an annual feedback report to the districts and leads to the development of cooperative action plans in response to lessons learned.
Type Description
Sampling Based 25% of eligible projects with a cross section of project
types
Indicator Based Based on performance measures, cost factors, and
other historical data
Priority Based Project specific beyond baseline delegation for AADD
projects
Determined on a case-by-case basis by request of appropriate senior authority
Figure 3.1 Caltrans contract quality management flowchart
Required
3-7
B E ST P R AC T I C E S I N Q UA L I T Y CO N T R O L A N D ASS U R A N C E I N D E S I G N
New York
New York also recognizes the need for feedback and reporting to improve quality processes. Its Design QA Bureau tracks each design for several quality measures, such as:
n Timeliness
n Development of design standards and environmental analysis
n Completeness of design decision documents and final plan packages
n Changes between plans, specifications, and estimates (PS&E) submittal and advertisement (e.g., unit price changes)
n Amendments to design
n Low bid in comparison to the engineers’ estimate
n Bidder and construction administration staff experience with the design product
The Office of Design meets semiannually with the regional design engineers, discusses the performance metrics, and identifies areas for improvement.
During the preliminary design process, NYSDOT uses the Design Report Review Checklist (see Appendix E) to evaluate the completeness of submissions for design approval and to ensure compliance with applicable federal and state environmenta