SUPPLY CHAINS: HOW CAN RFID
IMPROVE THE PERFORMANCE?
YACINEREKIK
Finance and Control Department, Emlyon Business School, Ecully, France
INTRODUCTION
Many research workers have alluded to the tremendous payoffs associated with an effective management of operations [1,2]. Companies adopting innovative supply chain management solutions that enhance the value added to customers at a lower cost are improving their competitive advantage. Nowadays, radio-frequency identification (RFID) technology, which is one type of automatic identification and data capture (AIDC) systems currently available, is becoming the basis for such new solutions contributing to a better management of supply chains, in terms of cost reduction and improvement of the customer service level. In most industries, AIDC systems originated with the use of barcode readers, barcode labels, and the universal product code (UPC). In a bar code system, in order to be detected and identified by readers, labels must be positioned precisely. This characteristic, calledline-of-sight positioning requirement, necessitates human interven-tion for scanning products and leaves room for errors and inefficiencies. The problem is intensified by the fact that companies rarely have common product codes for specific products or parts [3]. Also, the increasing quantity and variety of information to be managed make the definition of standard transactions for exchanging the gathered data difficult [4]. There is therefore a need for the development of new data capture and product identification systems. Our work is motivated by the recent development of the
Wiley Encyclopedia of Operations Research and Management Science, edited by James J. Cochran Copyright©2010 John Wiley & Sons, Inc.
can potentially perform even better than the bar code system and replace it in the long term [5]. This technology is basically based on the use of wireless RFID tags that carry unique electronic product codes (EPCs) and a set of software components that permit the exchange of data in a supply chain.
Several investigations have attempted to evaluate the benefits of RFID. Most of case-study-type research considers the evaluation of hard (direct) benefits [6]. However, these modeling approaches may not be sufficient for the quantification of some other types of benefits, such as the benefit of having more accurate inventory records.
Ataliet al. [7] characterize three different kinds of demand streams that result in inven-tory discrepancy. Some demand streams result in permanent inventory shrinkage (such as theft and damage). Some demand streams are temporary and can be recovered by physical inventory audit and returned to inventory (such as misplacement). The final group of demand stream (such as scanning error) affects only the inventory record and leaves the physical inventory unchanged. A detailed analysis of factors generating errors will be provided later.
The aim of this article is to provide a comprehensive study on the inventory inac-curacy issue and to show the way the RFID technology can improve the performance of supply chains subject to these inaccuracies. The remaining part of this section will be concerned with the main sources causing inventory inaccuracy: we focus on the impact on the performances and briefly detail main investigations performed for each type of source. Then, in the section titled ‘‘How to Cope with Inventory Inaccuracy,’’ we provide the different ways that permit us to cope with the inventory inaccuracy issue. For this pur-pose, we show that RFID technology could be an interesting alternative as proven by many recent investigations. The aim of the section titled ‘‘A Framework Enabling Mod-eling Inaccuracies and the Impact of RFID’’
is to present a framework that allows the modeling of an inventory system subject to inaccuracies and to show how we can mea-sure the impact of RFID on such system. Finally, the last section ends the article. The Inventory Inaccuracy Issue
The standard literature on inventory models has rarely differentiated between the inven-tory record and the physical inveninven-tory. The two have always been considered to be the same, and the main concern was on how, hav-ing observed demand and the resulthav-ing inven-tory levels, an inveninven-tory manager should determine when and how much to replenish. On the basis of empirical observations, this implicit assumption has been proven wrong. In fact, based on a study done with a lead-ing retailer, Raman [8] reports that out of close to 370,000 Stock-Keeping Unit(SKU) investigated, more than 65% of the inventory records did not match the physical inventory at the store-SKU level. Moreover, 20% of the inventory records differed from the physical stock by six or more items.
A general definition of accuracy includes obtaining the correct value for a measure-ment at the correct time [9]. According to Iglehart and Morey [10,11], inventory inaccu-racy occurs when the system inventory, that is, what, according to the information system (IS), is available, does not match the physical inventory, that is, what is actually available. Various other definitions going in the same sense and measures of inventory accuracy are presented in Refs 12–17. For example, Ernstet al. [12] propose using a control chart to monitor the changes in the inventory accu-racy. Another definition provided by Bernard [14] considers the percentage (and not the difference) error in the inventory records. Martin and Goodrich [17] define accuracy as the total dollar deviation between the actual dollar value of the inventory and the recorded dollar value of the inventory. As a conclusion of the last provided definitions, we say that an inventory stock is inaccurate when the record stock is not in agreement with the physical stock.
Inventory inaccuracy can be a major obsta-cle to improvements in firms’ performance [18]. While companies have undertaken large
investments to automate and improve their inventory management processes, inventory IS and physical inventory are rarely aligned [8]. Inventory inaccuracy might result from several factors. The aim of this section is to present a comprehensive analysis of the factors generating inventory inaccuracy. On the basis of empirical and qualitative inves-tigations, we try to focus on the order of magnitude of these errors. We also provide the main quantitative investigations for each error type.
Transaction Errors. Transaction errors are unintentional errors occurring during inven-tory transactions. Some of these transactions happen when counting the inventory, receiv-ing an order, or checkreceiv-ing out at the cash register.
Errors when checking out occur if the cash register scans one item twice, rather than each item separately, when a customer is buying two similar (but not identical) items with the same price. This innocuous action by the cash register ensures that the customer pays the correct amount and may even save the customer time as the cash register avoids handling the additional item. However, it generates a discrepancy in the inventory IS. Errors when picking impact inventory records similarly. A warehouse employee can unintentionally ship the wrong quantity of a particular item to a store or even send the wrong item altogether. According to DeHor-atius and Raman [11], in an apparel ware-house, it is quite easy for an employee to mistakenly pick a ‘‘medium’’ instead of a ‘‘large’’ garment. Stores typically do not scan merchandise on receipt, allowing such errors to remain invisible. In her PhD dissertation, Sahin [19] provides a comprehensive analysis of inventory systems subject to perturbations in nominal flows. According to the author, the major defects resulting in transaction errors are the following:
• the technical limitations of the bar code system;
• the potential failures stemming from the interaction between inventory operators and the bar code system. Those errors result in (i) errors made
when identifying entities, (ii) errors made when counting, and (iii) errors made when keypunching data.
Concerning the impact of transaction errors, we note that there is some empirical data available in the context of retail stores. Kang and Gershwin [20] report the results of a study conducted by a global retailer in sev-eral hundred of its stores. Inventory records were accurate for 51% of SKUs, whereas for 76% of SKUs the deviation between phys-ical inventory and inventory records was within a range of±5 units. This means that for close to one in four SKUs, inventory records deviated from physical inventory by six or more units. In another empirical study conducted by DeHoratius and Raman [11], who examined inventory record accuracy at a multibillion dollar retailer, the authors found that the absolute difference between inven-tory records and physical inveninven-tory was on average close to five units. For 15% of SKUs, it was above eight items. This compares with an average target inventory of 14 units per SKU. Average inventory inaccuracy varied considerably by store, with a minimum of 2.4 units per SKU and a maximum of 7.9 units. The same investigation suggests that factors such as higher selling quantity, inventory density, and product variety are associated with higher levels of inventory record inaccu-racy.
Among examples of studies that quan-tify the impact of inventory inaccuracies, the first one is performed by Iglehart and Morey [10], who propose an analytical tool to aid in controlling inventory errors, the objec-tive being to select the type and frequency of counts and to modify the predetermined inventory policy by adding a buffer to com-pensate for errors so as to minimize the total cost (inventory holding + inspection costs) per unit time. Sandoh and Shimamoto [21] also builds a model that determines the opti-mal frequency for periodical inventory tak-ing processes within a supermarket, which results from the trade-off between the cost for inventory-taking activities and the cost of investigating the causes of deviations. More recently, the work conducted by K¨ok and
Shang [18] aims at finding effective inven-tory replenishment and inspection policies that minimize inventory and inspection costs over a finite horizon. In their framework, the authors represent inventory inaccuracy through random errors that change the phys-ical inventory at the end of each period and errors accumulate until a costly inspection is performed. They propose a near-optimal joint inventory inspection and replenishment heuristic.
Misplacement Errors. Misplacement errors occur when a fraction of the inventory is misplaced; it is not available to meet a cus-tomer demand until it is found. According to Chappell [22], there are several sources gen-erating misplacement errors such as (i) con-sumers picking up products and then putting them down in another location, (ii) clerks not storing products on the correct shelf at the right time, and (iii) clerks losing products in the backroom. From a four-year longitu-dinal study of 333 stores of a large retailer, Ton and Raman [23] show that increasing product variety and inventory level per prod-uct is associated with an increase in mis-placed products. The authors also show that increasing misplaced products is associated with a decrease in store sales. According to C¸ amdereli and Swaminathan [24], mis-placed inventory is also present in warehouse operations. G.T Interactive, the creator of computer games like Doom II and Driver, suf-fered from low productivity due to inventory misplacement in the warehouse. Fundamen-tally what happens in these settings is that the product is misplaced in the supply chain and is unavailable during the sales period but can be retrieved when a cleanup is performed. Misplaced inventory can be quite large and have a significant impact on the inven-tory performance. It is reported in Ref. 8 that customers of a ‘‘leading retailer’’ cannot find 16% of the items in the store because of misplacement errors. The consequence is that misplacement errors reduce the profit by 25% for this retailer.
The authors in Ref. 25 model the con-sequences of random misplacement errors on the retail supply chain by comparing three approaches. In the first approach, the
retailer is unaware of the misplacement and places his orders as if inventory information is perfect. In the second case, the retailer is aware of the errors in his inventory status information, and adjusts his ordering policy accordingly. In the final approach, perfect inventory status information based on RFID technology is assumed. They also provide a critical value of the RFID cost, which makes its deployment cost effective. As an extension of the last investigation, the authors in Ref. 26 consider the impact of misplacement-type errors and the effect of the RFID technology on a decentralized supply chain. In partic-ular, they compare two possible strategies, in which the first deals with the deployment of the RFID technology and the second considers the coordination of the channel by using a modified buy-back contract. Gaukler et al. [27] investigate the effects of the RFID technology within the context of the retail supply chain. They build a newsvendor model that takes into account the inefficiency of the replenishment process from the backroom to the shelf in the retail store. Then, based on this model, they examine how the cost of the RFID implementation should be shared among the supply chain actors, and deter-mine coordinating contracts for the RFID-enabled supply chain within a newsvendor framework. C¸ amdereli and Swaminathan [24] study also the misplacement-type errors in a decentralized supply chain for uniform distributions of demand and error.
Damage and Spoilage. For supermarkets, perishables are the driving force behind the industry’s profitability and represent a signif-icant opportunity for improvement, account-ing for up to $200 billion in US sales a year but subjecting firms to losses of up to 15% due to damage and spoilage [28]. Examples of limited lifetime products are drugs and food products. In retail stores, customers can cause damages to products, thereby making them unavailable for sales. Some examples are, tearing a package to try on the contained cloth item, wearing down a shoe by trying it on and walking, erasing software on comput-ers on demonstration, spilling food on clothes, and scratching a car during a test drive [29]. These damages may not be detected by the
inventory manager and as a consequence would cause inventory inaccuracy.
According to Sahin [19], items reach their limit lifetime during storage because of the following:
• Errors when forecasting the customer demand, which may lead to an overes-timation of this demand and as conse-quence a substantial quantity of prod-ucts not being sold.
• The inability to track accurately the location, condition, and the age of prod-ucts stored within a facility.
An industry survey performed by the Joint Industry Unsalables Steering Committee [30] provides data on the level of unsalables in the US retail industry. According to the survey results, which are based on responses from over 60 manufacturers and retailers, the cost of unsalable food and grocery products amount to 1% of sales in the United States. Damage is the biggest cause of unsal-ables with 63% of all unsalunsal-ables, followed by expired (16%) and discontinued items (12%). The rate of unsalable products can differ by product category: frozen products, for example, reported an unsalable rate of 0.9%, whereas the rate for refrigerated prod-ucts was 1.7%. Unsalable rates for health and beauty care and general merchandise had even higher unsalable rates (1.9 and 2.2%, respectively), which was attributed to frequent new product introductions, shifts in fashion component, seasonality, and short shelf-life.
Theft. Inventory theft is defined as a com-bination of employee theft, shoplifting, inter-nal and exterinter-nal theft, vendor fraud, and administrative error. The Efficient Consumer Response (ECR)1 Europe project on shrink-age subsequently analyzed the causes of stock loss and proposed a systematic and collabo-rative approach to reducing the phenomenon throughout the supply chain. ECR defines ‘‘shrinkage’’ as the process errors, deceptions, and internal and external thefts. According
to Beck [31], some specific types of internal theft include the following:
• staff stealing goods by either hiding them in their bags or intentionally plac-ing them outside the buildplac-ing for later collection;
• collusion occurring when a staff mem-ber collaborates with a customer to steal products. During such an incident, the staff member may not scan the item, or the security personnel may intention-ally ignore the offense as it occurs; • grazing occurring when items stored in
the warehouse are consumed by the warehouse staff.
The results of the research carried by ECR Europe have shown that the scale of shrink-age in the fast-moving consumer goods sector is estimated to be¤24 billion in 2003 (465 mil-lion euros is lost irreparably within the fast-moving consumer goods turnover weekly), which is 2.41% of the whole turnover value of the sector. The process errors present 27% of the whole shrinkage value, 7% deceptions, 28% internal thefts, and 38% external thefts. On the basis of survey data, internal and external theft, administrative errors, and vendor fraud accounted for an estimated 1.8% of sales in the US retail industry in 2001, costing US retailers $33 billion [32]. For US supermarkets, the National Super-market Research Group (NSRG) survey [33] estimates that internal and external theft, receiving errors, damage, accounting errors, and retail pricing errors amount to 2.3% of sales. These figures only take into account the item value, but not any process-related costs (e.g., for handling of damaged items). Kang and Gershwin [20] use simulation to analyze the consequence of inventory inaccu-racy. They show that even small undetected losses can lead to important stockouts. They also propose several ways to tackle this problem, including the deployment of RFID technology. The authors in Ref. 34 use also simulation to show the consequences of inventory inaccuracy in a three-stage supply chain. Considering misplaced-type errors, the authors in Ref. 25 show analytically the impact of errors on the inventory decision
strategies and derive a threshold cost value at which RFID deployment would become cost effective. Extending the model of Rekik et al. [25,26] consider the case of a decen-tralized supply chain with one manufacturer and one retailer whose inventory is subject to inaccuracies. They develop the optimal ordering strategies under the centralized and the decentralized scenarios and study the impact of the RFID deployment on such supply chains. Heese [35] studies a supply chain consisting of a Stackelberg leader manufacturer and a retailer with inventory inaccuracy and random demand. Using specific distribution functions, he derives the threshold value of tag cost in order for a firm to adopt RFID. More recently, Rekik et al. [36] consider a finite horizon, single-product periodic review store inventory in which inventory records are inaccurate due to theft errors. They analyze the problem of theft in the store by optimizing the holding costs under a service level constraint, and analyze the impact of theft errors and the value of the RFID technology on the inventory system.
Supply Errors: Product Quality, Yield, and Supply Process. When the product quality is low, or a production process has a low yield, or a supply process is unreliable, the physical inventory may not be known and as a conse-quence may be different from the inventory in the IS [37–39]. Products that are not con-forming to quality standards can also make the inventory inaccurate. According to Ben-soussan [29], receipts are usually added to the inventory without a full inspection pro-cess. The consequence is that the IS may consist of both nondefective products and defective products which are not available for sale.
HOW TO COPE WITH INVENTORY INACCURACY
To cope with inventory inaccuracy, differ-ent compensation methods can be used. The analysis conducted by many investigations [19,20,40,41] agreed that (i) making decisions by considering the inventory inaccuracy may be applied to tackle the problem of inven-tory inaccuracy and (ii) RFID technology
may help to track items through the supply chain. In addition to reducing the inventory inaccuracy, this technology may also help to eliminate the reasons of inventory inaccuracy such as theft.
For the specific case of misplacement errors, inventory managers may apply other methods to tackle the problem of misplaced inventory. For example, in some apparel departments of retailers, there are signs informing customers not to return the product to their original location if the they decide not to buy the product after trying it. Some libraries cope with the misplacement problem by putting signs that tell the customers not to reshelve the books after use, while others have designated spaces for returning books taken off the shelf [24].
The analysis conducted by Kang and Gershwin [20] examines various other techniques that inventory managers can use to compensate for the inventory record errors. According to the authors, the com-pensation techniques can be summarized in the following three points:
• Verifying Manually the Inventory.The inventory manager can choose the items in the facility in order to perform a man-ual, periodic counting. The frequency of counting may depend on various ele-ments, such as the availability of labor and the product characteristics, includ-ing the profit margin, sales velocity, and whether the products are highly prone to errors.
• Performing a Manual Reset of the Inven-tory Record. This technique is used if a direct measurement of the physical inventory is not available, and inven-tory managers can gather and monitor the available data and search for any patterns that may be indicative of the presence of serious inventory error. • Performing a Constant Decrement of
the Inventory Record. This technique is performed if the inventory manager is aware of the presence of errors and also knows their stochastic distribu-tions. The inventory manager may decrement the inventory record by the average of the error in each period.
Since the physical value of the error realization at each period is unknown, performing this constant decrement will still not eliminate the error in the inventory record. However, over time, this corrective action can be expected to perform better than leaving the inventory record unadjusted.
In her PhD dissertation, Sahin [19] pro-poses a set of actions aiming to eliminate errors. These actions can be summarized in the following points:
• reengineering the physical organization of the facility;
• using a new product identification tech-nology that reduces scanning errors; • using a technology that enables the
reduction of theft in the facility; • using a technology to accurately track
the products’ sell-by dates;
• performing double receiving and ship-ment processes;
• improving the actual processes in the facility;
• performing benchmarking analysis and developing personnel awareness build-ing actions that focus on the operational weaknesses.
DeHoratius et al. [41] suggest two more ways in which an inventory manager may respond to the inventory inaccuracy problem: • Prevention.Reduce or eliminate the root causes of inventory record inaccuracy through the implementation and execu-tion of process improvement.
• Correction.Identify and correct existing inventory record discrepancies through auditing policies.
A FRAMEWORK ENABLING TO MODEL INACCURACIES AND THE IMPACT OF RFID How to Model Inventory Inaccuracies
A typical supply chain may include three main entities: the manufacturer, the warehouse, and retailers. The manufacturer
produces products, the retailers are the agents selling products to the final customers. Between the manufacturer and the retailers, there may exist a warehouse that acts as an intermediate element that buys products from the manufacturer and resells them to the retailers.
From an inventory control point a view, satisfying customer demands may be differ-ent within the retail store and the warehouse. For this reason, two structures may exist:
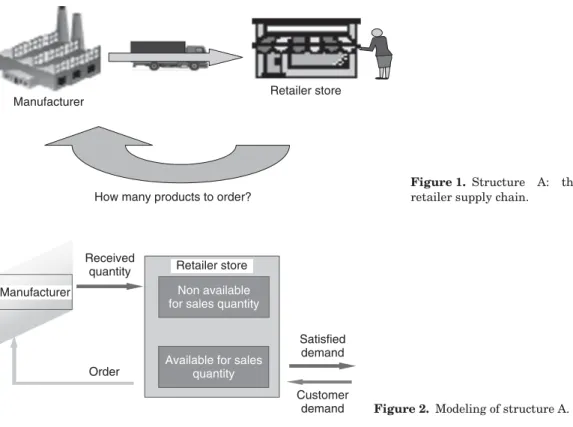
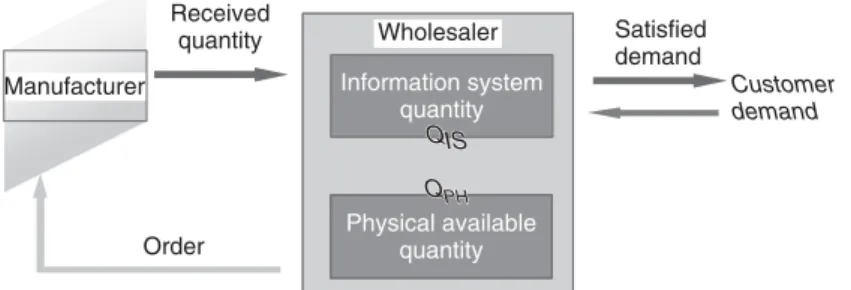
• Structure A.This structure focuses on the retail store context (Fig. 1). The end customers are physically present in the retail store and their demands are han-dled by the physical on-shelf inventory. The IS does not play a major role in this structure. This structure of the supply chain can be modeled as illustrated in Fig. 2.
• Structure B.This structure focuses on the warehouse context (Fig. 3). Cus-tomers are not physically present in
the warehouse, and demand satisfac-tion is met on the basis of the inven-tory level shown in the IS. On the basis of the demand it receives, the warehouse observes its IS stock and makes a commitment. The commitment is later satisfied depending on the phys-ical available stock. The structure of this supply chain can be modeled as illustrated in Fig. 4.
In the presence of inaccuracies, the two structures do not behave in the same way from an inventory control point of view. We argue that the main difference between the two structures concerns the commitment made by the warehouse under structure B. In structure A, no commitment is made by the retailer since the end customers are physically present in the store.
Remark 1. Note that Internet retailer inventory system can be modeled as struc-ture B since decisions concerning demand satisfaction are based on the IS inventory.
Manufacturer Retailer store
How many products to order?
Figure 1. Structure A: the retailer supply chain.
Manufacturer Received quantity Order Retailer store Non available for sales quantity
Satisfied demand
Customer demand Available for sales
quantity
Manufacturer Retailer stores • • • • • • Wholesaler distribution center
How many products to order?
Figure 3. Supply chain B: the warehouse supply chain.
Remark 2. From an inventory control point of view, structure A can be considered as a particular case of structure B, where the available-for-sale quantity in structure A corresponds toQIS of structure B, assuming thatQIS≤QPH.
Under structure B, one can consider the following sequence of events: Before the start of the selling season, the warehouse manager orders a quantity from the manufacturer. This quantity is established based on forecast information available to the inventory man-ager regarding the future demand. The ware-house receives the goods and stores them. Just before the start of the selling season, the inventory manger receives orders from the customers. He compares the cumulative order from all the customers to the quantity seen in the IS. If the cumulative order is less than the IS quantityQIS, he accepts all the orders. Otherwise, he only accepts orders summing up to QIS. Later on, the products are shipped from the warehouse and deliv-ered to the customers. All the orders that the inventory manager has committed himself to
should be satisfied, except in the case where the physical inventory is not able to satisfy the committed quantity. Unsatisfied demand during the commitment and unsatisfied com-mitment are lost since there is no opportunity for replenishment during the selling season.
The inventory manager’s decision is to determine the best quantity to order from the supply system before the selling season to satisfy customer’s aggregate demand. He faces three risks: (i) risk of having unsold products at the end of the selling season; (ii) risk of shortage; and (iii) risk of not being able to deliver the quantity that he has made a commitment for. Within this framework, the inventory manager faces three types of costs:
• the unit overage cost due to products unsold at the end of the selling season; • the first type of unit underage cost due
to orders rejected by the inventory man-ager during the commitment;
• the second type of unit underage cost due to orders initially accepted by
Manufacturer Received quantity Order QIS QIS QPH Wholesaler Information system quantity Satisfied demand Customer demand Physical available quantity QPH
the inventory manager but finally not totally delivered to the customers. We note that the second type underage cost is the parameter that characterizes the ware-house context. In a retail context, this cost does not exist since the customers are phys-ically present at the store: if the product is not available, the demand is lost, other-wise it is satisfied immediately. The second type underage cost occurs when the customer demand is related to the IS inventory.
To model the impact of inaccuracy errors on the performance of the inventory system, it is important to characterize the error type. In fact, in a general setting, if we let Q the quantity ordered from the supply pro-cess, the physical and the IS inventory can respectively be written as follows: QPH= γPHQ+PH and QIS=γISQ+IS, where the couple of random variables (γPH,PH) (γIS,IS) characterizes errors on the physical inven-tory level (IS inveninven-tory level). From this general setting, which is called the mixed error setting, one can distinguish two partic-ular cases:
• the additive error setting: in this case, Qi=Q+iwherei∈[PH, IS];
• the multiplicative error setting: in this case,Qi=γiQwherei∈[PH, IS]. Second, it is also important to discuss how an inventory system subject to inaccuracy problems can be managed. In the presence of errors, one should distinguish between two situations depending on whether or not the inventory manager is aware of the existence of errors. The case where the inventory man-ager is unaware or simply ignores errors will be referred to as Situation 1 in the rest of this article. The case where the inventory manager is aware of errors occurring in the inventory system will be referred to as Situa-tion 2. For this latter Situation, one can also distinguish between two cases based on the information the inventory manager has about the error parameters. The first case occurs when the inventory manager has statistical information about the error parameter (such as a mean or the distribution of the error). The second case occurs when he has exact
information on the realization of the error. The difference between the two cases makes sense especially in a multi-period framework. Concerning Situation 2, we notice that an estimation of the error parameters can be realized on the basis of statistical sampling methods as reported by Pergamalis [42], who proposes a methodology for measuring the store’s inventory accuracy.
In contrast to Situation 2, Situation 1 is easier to model and optimize. In fact, in Sit-uation 1, the inventory manager acts as if there were no errors. So, his ordering deci-sions or his replenishment policy coincides simply with the ordering quantity or the replenishment policy of the model without errors.
RFID as a Lever to Tackle the Inaccuracy Problem
RFID technology is a wireless technology that includes RFID tags and readers often linked to an IS through a computer. A tag is basically an antenna, which may be active or pas-sive. An active tag is powered by a battery, while a passive one is not. This affects the performance and price. Because of its char-acteristics, RFID tags may be read without visual or physical contact. To facilitate phys-ical distribution and inventory management, tags are attached to packaging or unit loads, for instance, transport packaging, pallets, or containers.
RFID technology is developing at a rapid pace, offering companies the opportunity to improve supply chain visibility. In fact, the number of RFID applications in supply chains is increasing steadily, which is indi-cated by the escalating level of investment in this technology. The Aberdeen Group [43] surveyed over 600 companies using RFID in the last 12 months. According to this study, the average manufacturer’s annual RFID budget has grown rapidly, from $50,000–75,000 in 2006 to $100,000– $200,000 in 2007. The study shows that the investments already made greatly improved cycle time, on-time delivery, safety stock, and changeover time.
Several authors highlight the opportu-nities presented by RFID technology. In the physical distribution field, Jim Wu and
Chen [44] use a simulation study to predict operational efficiency in a distribution center. Thanks to a perfect RFID system (100% read rate), the authors show an inventory reduction of 15%, lowered space use rate of 15%, and elimination of out-of-stock items. The authors in Holmqvist and Stefansson [45] study a mobile RFID system designed to manage arrival inspection and loading of containers. They find both time savings in arrival inspection and lead time reduction in loading, except when there are only a small number of consignments per container. In another study, Jarugumilli and Grasman [46] use invented data to model a vendor-managed inventory (VMI): for an excellent review about VMI systems, the reader is referred to the article titled Vendor-Managed Inventory in this ency-clopedia (by Michael J. Fry) setting with RFID tags applied to the goods. In Ref. 47, the authors propose a logistics IS to simplify the distribution process with the help of RFID technology. A case study is discussed in applying the proposed IS to solve distribution management problems of a medium-sized logistics service company. By using this RFID-enabled system, the authors show that the overall distribution performance of the company is greatly improved.
On the inventory control side, as stated in the section titled ‘‘Introduction,’’ many recent investigations concerned with inven-tory inaccuracy issues are motivated by RFID technology and its impact on supply chain performance. Indeed, RFID deployment con-tributes to the elimination of the sources of inaccuracies through the supply chain:
• Errors resulting from the unreliability of the supply system can be detected thanks to the counting performed when receiving orders. RFID can reduce the errors in receiving via the RFID-enabled process referred to as electronic proof-of- delivery (or ePod) [48]. With barcode, mistakes are made by misidentifying the quantity and type of product.
• For food and perishable products, RFID can
– Facilitate first-in-first-out (FIFO) and pricing management
– Facilitate the tracking and mainte-nance of temperature conditions sup-porting the integrity of the cold chain for some food products
– Allow getting more accurate infor-mation about demand and supply forecasts. Accurate and timely infor-mation about stock levels, sales throughput, and production data allow reengineering the overall business. Minimizing buffer and obsolescent stock will lead to lower inventory. Products can be brought closer to the market in the form of mini stocks, once the visibility over those can be guaranteed. Combining product flows from different sources on their way to the receiver becomes faster and more efficient. Overall, this will lead to increased product availability and as such increased sales, which can be even more accelerated by retail applications like automatic cross-selling or product information displays.
• Inaccuracies resulting from shrinkage errors can be reduced by discouraging thieves and by facilitating the location of quantities and timings of theft losses across the supply chain. Loss prevention during transport between sending and receiving parties or even within sites can be achieved by increased trans-parency and real-time visibility over the goods flow. Basically, the level of tagging (pallet, case, or item) and the frequency of read events determine the degree of loss prevention.
• Products subject to misplacement errors can be detected by deploying RFID read-ers within shelves and in the backroom. • Shipping accuracy can be improved. Distribution centers and manufactur-ers often make mistakes by loading product on the wrong truck. With RFID, the system can send an alert (visible, audible, etc.) to the person loading the truck that a mistake has been made. This alert could save a company money
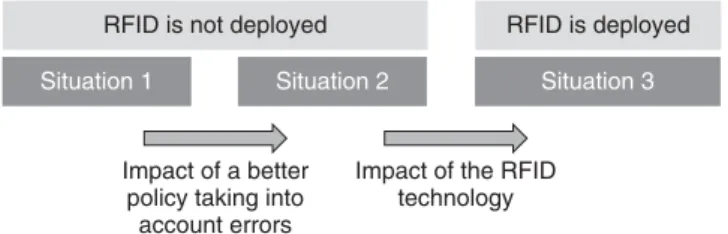
RFID is not deployed RFID is deployed Situation 1
Impact of a better policy taking into account errors
Impact of the RFID technology
Situation 2 Situation 3
Figure 5. Situations permitting management of the system.
from shipping and reshipping the same items as well as enhance inventory control.
The decision to invest in RFID technol-ogy will depend on the trade-off between the cost associated with the deployment of the technology and the savings resulting from investment. Taking into account the vari-able2costs associated with RFID, that is, the RFID tag cost embedded in each product, we are able to model the RFID-enabled situation. We note that RFID can bring two benefits for the inventory warehouse as follows:
• The visibility provided by this technol-ogy. Theoretically, RFID enables track-ing and tractrack-ing of items in stock and in the pipeline, thereby creating complete inventory visibility, leading to an accu-rate account of inventory discrepancy. In such cases, the inventory problem under study is nothing but the basic random yield problem.
• The prevention or reduction of the magnitude of some sources of inventory inaccuracy by RFID. In the case of theft errors, by being able to distinguish customer demand and other kinds of demand (theft for example), the inventory manager can act to prevent or discourage the sources of this latter demand.
The RFID-enabled problem, referred to as Situation 3, is also a basic inventory problem where the unit purchase (production) cost of the product includes the RFID tag cost.
To summarize, the Fig. 5 presents the different situation that allow modeling of the
2The introduction of fixed cost can be done by an additional return on investment (ROI) analysis.
impact of inventory inaccuracies and the ben-efit pertaining to the deployment of the RFID technology.
Comparing Situations 1 and 2 permits getting insights on the benefit of obtaining information about the errors and establishing a better inventory policy taking into account the inaccuracy issue. Comparing Situations 2 and 3 also permits getting insights into the real benefit of RFID and, in particular, answering the key questions:
• Is RFID deployment an economically feasible solution for the warehouse manager?
• If yes, under which tag price is RFID cost effective?
CONCLUSION
Our major focus in this article was to provide a comprehensive study on inventory inac-curacy and the way RFID technology can tackle this issue. We listed the main sources of errors with a focus on their impacts on the supply chain performances and briefly detailed the main research investigations in this field. We proposed a conceptual frame-work that permits modeling of the inaccuracy errors and the way RFID can contribute. In fact, three modeling situations show the impact of a better inventory policy, taking into account error distribution and the impact of RFID deployment.
REFERENCES
1. Quinn F. The payoff potential in sup-ply chain management in achieving supsup-ply chain excellence through technology. Techni-cal Report. San Francisco (CA): Montgomery Research; 1999.
2. Mentzer JT. Supply chain management. Thou-sand Oaks (CA): Sage; 2001.
3. Wilder C. Purchasing analyzer. 1999. 4. Ka¨orkka¨oinen M, Ala-Risku T, Fra¨omling K.
Integrating material and information flows using a distributed peer-to-peer information system. In Collaborative Systems for Produc-tion Management. (jagdev H.S., Wortmann J.C., Pels H.J.Eds.), Kluwer Academic Pub-lishers, Boston: 2003. pp. 305–319.
5. Sarma S, Brock DL, Ashton K. The net-worked physical world. report reference MIT-AUTOID-WH-001. Auto-ID Center; 2000. 6. Alexander K, Gilliam T, Gramling K, et al.
Focus on the supply chain: applying auto-id within the distribution center. Technical report. MIT, Cambridge: MIT: Auto-ID Cen-ter; 2003.
7. Atali A, Lee H, Ozer O. If the inventory man-ager knew: Value of RFID under imperfect inventory information. Technical report. Stan-ford: Graduate School of Business, Stanford University; 2009.
8. Raman A, DeHoratius N, Ton Z. Execution: the missing link in retail operations. Calif Manag Rev 2001;43:136–152.
9. Schuster EW, Scharfeld TA, Kar P,et al. The prospects for improving erp data quality using auto-id. Cutter IT Journal: Information Tech-nology and the Pursuit of Quality, 2004. 10. Iglehart D, Morey RC. Inventory systems
with imperfect asset information. Manag Sci 1972;18(8):388–394.
11. DeHoratius N, Raman A. Inventory record inaccuracy: an empirical analysis. Technical report. Graduate School of Business, Univer-sity of Chicago; 2004. Working paper, Gradu-ate School of Business, University of Chicago. 12. Ernst R, Guerrero JL, Roshwalb A. A
qual-ity control approach for monitoring inven-tory stock levels. J Oper Res Soc 1984;44: 1115–1127.
13. Buker DW. Inventory accuracy. Chicago, illi-nois: Inventory Management Reprints APICS; 1984. pp. 221–223.
14. Bernard A. Cycle counting: the missing link. Prod Invent Manag 1985;25(4):27–40. 15. Chopra V. How to set up an effective
inven-tory accuracy program. In: 29th Annual APICS International Conference Proceedings. Chicago, illinois: 1986.
16. Young JB. The limits of cycle counting. In: 29th Annual APICS International Conference Proceedings. Chicago, illinois: 1986.
17. Martin W, Goodrich S. Minimizing sample size for given accuracy in cycle counting. Prod Invent Manag 1987;28(4):24–27.
18. K¨ok AG, Shang KH. Replenishment and inspection policies for systems with inventory record inaccuracy. Manuf Serv Oper Manag 2007;9:185–205.
19. Sahin E. A qualitative and quantitative analy-sis of the impact of Auto ID technology on the performance of supply chains [PhD thesis]. Ecole Centrale Paris; 2004.
20. Kang Y, Gershwin SB. Information inaccuracy in inventory systems - stock loss and stockout. IIE Trans 2004;37:843–859.
21. Sandoh H, Shimamoto H. A theoretical study on optimal inventory taking frequency for retailing. J Retail Consum Serv 2001;8. 47–52.
22. Chappell G, Durdan D, Gilbert G,et al. Auto-id in the box: the value of auto-Auto-id technology in retail stores. Auto-ID Center; 2003. 23. Ton Z, Raman A. The effect of product variety
and inventory levels on misplaced products at retail stores: a longitudinal study. Techni-cal report. Boston: Harvard Business School; 2004.
24. C¸ amdereli AZ, Swaminathan JM. Coordina-tion of a supply chain under misplaced inven-tory. Technical report. North Carolina: Kenan-Flagler Business School; 2009.
25. Rekik Y, Sahin E, Dallery Y. Analysis of the impact of the rfid technology on reducing prod-uct misplacement errors at retail stores. Int J Prod Econ 2008;112:264–278.
26. Rekik Y, Jemai Z, Sahin E,et al. Inventory inaccuracy in the retail supply chain: coordi-nation versus rfid technology. OR Spectrum 2007;29:597–626.
27. Gaukler G, Seifert RW, Hausman WH. Item-level rfid in the retail supply chain. Prod Oper Manage 2007;16:65–76. Working Paper, Stan-ford University, StanStan-ford, USA.
28. Ketzenberg ME, Ferguson M. Managing slow moving perishables in the grocery industry. Technical report. College of Business Colorado State University and The College of Manage-ment Georgia Institute of Technology; 2006. 29. Bensoussan A, Cakanyildirim M, Sethi SP.
Partially observed inventory systems: the case of zero balance walk. Technical report. Richardson: School of Management, Univer-sity of Texas at Dallas; 2005.
30. Lightburn A. Unsaleables Benchmark Report. Virginia: Joint Industry Unsaleables Steering Committee, Food Distributors International,
Food Marketing Institute and Grocery Manu-facturers of America; 2002.
31. Beck A. How can rfid help to reduce shrink-age. Technical report. Leicester: University of Leicester; 2003.
32. Hollinger RC, Davis JL. National retail secu-rity survey. Florida: Department of Sociology and the Center for Studies in Criminology and Law, University of Florida; 2001.
33. Supermarket. Supermarket shrink survey. London: National Supermarket Research Group; 2001.
34. Fleisch E, Tellkamp C. Inventory inaccuracy and supply chain performance: a simulation study of a retail supply chain. Int J Prod Econ 2005;95:373–385.
35. Heese H. Inventory record inaccuracy, double marginalization and rfid adoption. Prod Oper Manag 2007;16:542–553.
36. Rekik Y, Sahin E, Dallery Y. Inventory inac-curacy in retail stores due to theft: An analysis of the benefits of RFID. Int J Prod Econ 2009;118:189–198.
37. Yano CA, Lee HL. Lot sizing with random yields: A review. Oper Res 1995;43:311–334. 38. Inderfurth K. Analytical solution for a
single-period production-inventory problem with uniformly distributed yield and demand. Cent Eur J Oper Res 200412:117–127.
39. Rekik Y, Sahin E, Dallery Y. A compre-hensive analysis of the newsvendor model with unreliable supply. OR Spectrum 2007;29: 207–233.
40. Uckun C, Karaesmen F, Savas S. Invest-ment in improved inventory accuracy in a decentralized supply chain. Int J Prod Econ 2008;113:546–566.
41. DeHoratius N, Mersereau AJ, Schrage L. Retail inventory management when records are inaccurate. Manuf Serv Oper Manag 2008;10:257–277.
42. Pergamalis D. Measurement and check-ing of the stock accuracy. 2002. Article in www.optimum.gr (www.optimum.gr/Know ledge_Center/articles/).
43. Klein R. Can rfid deliver the goods?- the man-ufacturer’s visibility into supply and demand. Technical report. Anderson Group; 2007. 44. Wu Y-C, Chen J-X. RFID application in a
cvs distribution centre in taiwan: a simu-lation study. Int J Manuf Technol Manag 2007;1:121–136.
45. Holmqvist M, Stefansson G. Smart goods’ and mobile rfid: a case with innovation from volvo. J Bus Log 2006;27:251–272.
46. Jarugumilli S, Grasman SE. RFID-enabled inventory routing problems. Int J Manuf Tech Manag 2007;10:92–105.
47. Choy KL, Henry CWL, Kwok SK,et al. Using radio frequency identification technology in distribution management: a case study on third-party logistics. Int J Manuf Tech Manag 2007;10:19–40.
48. Mason M, Langford S, Supple J,et al. Elec-tronic proof of delivery. Technical report. Brussels, Belgium: EPCglobal; 2006.