On the Limits of Psychometric Testing
in Online Education
Ruben Naeff, Zachary Nichols Knewton, Inc.
100 5th Ave, 8th Floor, New York NY
{ruben, zack, data-science}@knewton.com
Abstract
The rapid growth of web-based educational products has garnered renewed in-terest into psychometric assessment methods. Here we compare two traditional psychometric approaches – classical test theory (CTT) and item response theory (IRT) – that model student proficiency and item difficulty, and introduce a graph-theoretical algorithm based on tournament ranking that approximates an upper bound to both traditional models’ single interaction prediction accuracy. We ap-ply each model to two large dataset collections, each containing tens of millions of student interactions, and find via cross-validation that CTT is more susceptible to over-fitting than IRT. We also find via the graph theoretical method that for this data, the prediction accuracy of models with fixed student and item parameters has an upper bound of 93% on average (and as low as 82% for some datasets). This is significant, given the reported prediction accuracy for IRT on web-based data [1]. We also find that the upper bound on prediction accuracy can be well-fit by a simple model from basic statistics of the sample (such as mean correctness, number of students, or number of questions answered per student), suggesting that the maximum accuracy is a feature of student behavior that itself can be described by or utilized in future assessment methods.
1
Introduction
The explosion of web-based, varied, and adaptive educational products in recent years has spurred discussion of how continuous assessments can work in these systems [2, 3]. Traditional psychome-tric testing approaches – including Classical Test Theory (CTT) and Item Response Theory (IRT) (see [4]) – were developed for high accuracy in single assessments. However, today’s educational products raise concerns that were not relevant in these classical scenarios: learning, forgetting, in-complete response data, the use of hints, repeated attempts, etc. This means that the transition of testing approaches into environments where these phenomena are common has necessitated fur-ther research. This research has included (for example) evaluation of the stability and performance of assessment approaches in continuous settings [1, 3], and in extensions to these methods where increased complexity is required [5].
Gauging the accuracy of psychometric testing approaches such as IRT is itself an area of active research [6, 1]. A common validation method is to evaluate the stability and accuracy of recovered item parameters (as in [7, 3]). Here, we follow the machine learning approach of Bergner et al. [1] by evaluating the ability of the psychometric models to explain and predict individual student responses. This method has the advantage that it allows the psychometric approaches to be compared with each other and with other machine learning or modeling techniques.
Using this machine-learning approach, we compare two traditional psychometric assessment meth-ods (CTT and IRT) on two large datasets (each containing tens of millions of individual responses)
from web-based learning environments. We also introduce a tournament ranking algorithm which is able to closely approximate the minimum number of prediction errors yielded by an algorithm with fixed student abilities and item difficulties (a property that both the IRT and CTT approaches have). We find that while CTT is able to predict individual student responses much closer to the approx-imate maximum performance within “training” data, its cross-validated performance is worse than IRT (i.e., it is more susceptible to over-fitting). We also find that the minimum number of prediction errors for the student response datasets (measured via the tournament ranking algorithm) is highly predictable given a small set of data features. This suggests a consistency within student behavior that could itself be a feature taken advantage of (or explained by) future assessment approaches.
2
Assessment Approaches
We consider three types of assessment methods: CTT, IRT, and a graph theoretical approach based on tournament ranking. Each assessment method is implemented with a model containing the same total number of parameters (one for each student and for each item), though their regularization and fitting methods vary.
2.1 Classical Test Theory
CTT is based on the (simple) assumption that for a population of students (indexed bys), the ob-served scoresxsfor an individual assessment are a function of some underlying true scorestsand
an error terme[4, 8]:
xs=ts+e.
The true score for a studentts can itself be represented as a function of student ability and item
parameters. The item parameter we are primarily concerned with here is the difficulty, which in CTT is formulated as the complement of the “pvalue”: the proportion of the student sample that correctly answers the item.
In order to predict individual student responses with CTT, we compare an item’spvalue with the student’s overall inferred ability (the fraction of items answered correctly by the student). Since student ability parameters are not directly dependent on the inference of item parameters, our cal-culations avoid circular dependencies (a common issue in fitting CTT parameters [7]), though they still are sensitive to the sample used, and to the pattern of incomplete responses in the sample. 2.2 Item Response Theory
IRT is a family of models that describe the probability of a student answering an item correctly as a function of a nonlinear relationship between student ability and item parameters [4, 8]. For the common one-parameter logistic (1PL) IRT model, this function takes the form of the sigmoid
P(correct) = 1
1 +e−(θs−βi), (1)
whereθsrepresents the ability of students, andβirepresents the difficulty of itemi(see Fig. 1A).
Fitting the set of item and student parameters in this model to incomplete data is a type of Collabo-rative Filtering [1], where, for example, inferences on item parameters from one sub-population of students might influence student ability inferences on another. This formulation makes IRT models less sensitive than CTT to the statistics of the sample responses used in fitting, though evidence shows that they are not totally invariant [7].
We perform the IRT fitting process by maximizing the log-likelihood of (1) given the dataset. Addi-tional regularization is introduced via Bayesian priors, so thata priori, difficultiesβ and abilitiesθ
are assumed to be normally distributed according toN(0,1). This yields the objective function:
Z=− X (s,i)∈R log(1 +e−(θs−βi)) + (1−r s,i)(θs−βi) −X s 1 2θ 2 s− X i 1 2β 2 i, (2)
wherers,i is the response of students to itemi, where a correct response is coded as1 and an
incorrect response is coded as0. Missing responses are handled by the termR, which contains a pair(s, i)only in cases where the response of studentsto itemiexists in the observed dataset.
100% 0% R e sp o ns e Pro b ab ility Student Proficiency Q2 Q1 A B S1 S2 S3 Q1 Q2 Students Questions C S1 S2 S3 Q1 Q2 Students Questions
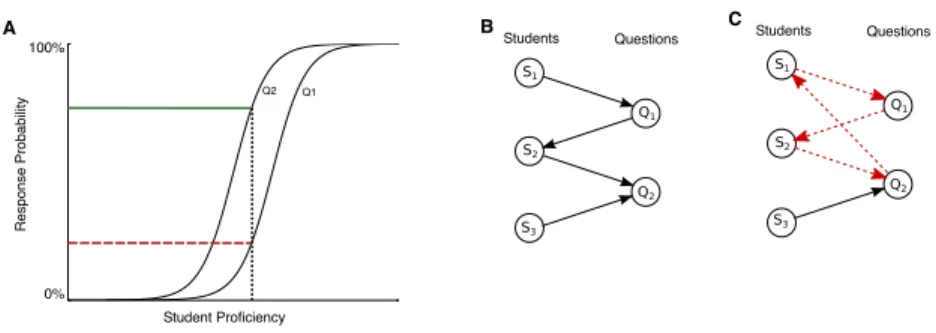
Figure 1: IRT and Partial Tournament Ranking.A, IRT models map student proficiency to a proba-bility of correctly answering a question. This example shows that a student with some proficiencyθ
(vertical dotted line) is likely to answerQ1incorrectly (dashed line), butQ2correctly (solid line).
Fitting an IRT model to response data requires assigning abilities~θto studentsSand difficultiesβ~
to question itemsQso that the observed responses are well-predicted by the model.B, Partial tour-nament ranking of students and items involves finding a topological ordering of students and items in a simple bipartite directed graph, where a student’s outgoing edges represent correct answers, and vice versa. C, cycles in the graph (dashed edges) make such a sorting impossible. Therefore, a model with the highest accuracy will remove a feedback arc set: the minimum number of edges that should be removed to eliminate cycles.
In order to predict individual student responses with 1PL-IRT, we use the student and item parame-ters found via maximizing (2). Following (1), we predict that studentswill answer itemicorrectly if and only ifθs≥βi(that is, whenP(correct)≥50%).
2.3 Bipartite Partial Tournament Ranking
For both CTT and IRT, we predict individual student responses by comparing an item difficulty parameter to a student ability parameter. Given this formulation, it is natural to ask what combination of student and item parameters can directly minimize the number of classification errors for a dataset. This is equivalent to a type of tournament ranking [9], where items and students compete against each other (Fig. 1B).
More formally, we let student responses form a bipartite directed graph G = (U, V, E), where students and items are represented by the verticesU and V, respectively, correct responses are represented by edgesu → v, and incorrect responses byv → u. We ensure thatGis simple by considering only a single response for a student-item pair (see Section 3.1), so that there is at most one edge per vertex pair (u, v), and there are no self-loops. We call this a “partial” tournament becauseGis generally incomplete: students are not guaranteed to respond to all items (and in most cases do not).
The tournament ranking problem can be stated as follows: given a graph of trial outcomes, find a
topological sortingof the vertices, where each vertex points to its less proficient, respectively easier,
successor. Note that if such a sorting exists for our student response data, that we then can predict all responses in the dataset perfectly: a student with some ranking will answer all items with a lower ranking correctly, and all items with a higher ranking incorrectly. Such a sorting only exists if the graph isacyclic, however. In cases where the tournament graph contains a cycle (see Fig. 1C), an edge must be broken to unambiguously rank students and items, which means that even the most accurate ranking must contain at least one prediction error.
Therefore, we need to find afeedback arc set(FAS) of graphG: a smallest set of edges that needs to be removed to makeGacyclic [9, 10]. Note that such a set is generally not unique. If we can find a FAS, then we can compute the smallest prediction error that is possible for any tournament ranking algorithm and, by extension, any model involving a comparison of static item difficulties and student abilities. While the FAS problem is NP-hard (even for tournaments) [11, 12, 13], heuristics exist for approximate solutions.
Local Optimization Algorithm: Single Vertex Moves
LetG = (U, V, E)be a bipartite directed graph. LetRbe a candidate ranking of verticesu ∈U and
v∈V, so that eachujis assigned a unique rankθjand eachviis assigned a unique rankβi. Let thecost
ofRbe the number of edges inEthat point in the ‘wrong’ direction, i.e. go from a lower- to a higher-rank vertex. Then theaccuracyis defined as the cost ofRover the number of edges|E|.
1. Takevi ∈ V, together with its adjacent vertices{uj}with parameters{βj}. Compute the
accuracy of the current rankingRon this subgraph.
2. Find a newθ0iforvisuch that the accuracy of the new rankingR0is maximized, using a linear
search (this may result in a fractional ranking)
3. If the accuracy of the new rankingR0is higher than the accuracy of the previous rankingR, replaceθiwithθi0
4. Reassign all ranks(θi, βj)to integers again, preserving the new ordering.
5. Repeat for all verticesv∈V andu∈U, until a complete cycle through all vertices has occurred with no change in ranking
One such heuristic solution to find a FAS is Eades’ algorithm [12]. While this algorithm is efficient, we find that its performance is greatly improved on our datasets (without much loss of efficiency) by taking advantage of a local optimization called “single vertex moves” [14, 10] (see Fig. 2). Single vertex moves involve iteratively re-ordering the vertex ranking until local improvements cease (see box). We refer to the combination of Eades’ algorithm with the single vertex moves local optimiza-tion asEades + LO
3
Datasets
3.1 Student Data
Student datasets consisted of student interactions from two separate adaptive, continuous, web-based products. Within each dataset, repeated attempts at the same item were removed (keeping only the first attempt). Items were partitioned into distinct pedagogical areas (“concepts”) via methods similar to those described previously [15, 16, 17, 18], so that student ability within in each concept is separate from other concepts.
The first dataset (Dataset 1) consists of student interactions in an web-based educational product which occurred from January 2014 through late August 2014. This dataset contains about 20 million interactions by over 55,000 students across 10,000 items, which were partitioned into over 650 individual concepts (with each concept containing between 1 and 55 items). Each student interacts with 30% of the available items on average.
The second dataset (Dataset 2) consists of student interactions in a separate web-based educational product from January 2013 through June 2013. This dataset contains almost 14 million interactions by over 36,000 students with almost 19,000 items, partitioned into about 350 concepts. On average, an individual student interacts with about 20% of all available items.
3.2 Simulation Data
In addition to the student response datasets, we created several datasets via simulation in order to test the assessment methods in known conditions. Each simulated dataset was based on a given number of students, number of items, average student score, completion rate, and desired amount of baseline prediction error (i.e., response noise).
Given the number of students and items, and the average score, we randomly generated parameters
~
θandβ~, so that the mean score of student responses would correspond with the given score. Then, responses were considered correct for studentson itemiif and only ifθs ≥βi. Next, responses
were randomly thrown away to reach the desired completion rate. Finally, the correctness of answers was randomly flipped according to the baseline prediction error parameter (note that an assessment model may make fewer errors than the baseline prediction error if several flips work together to
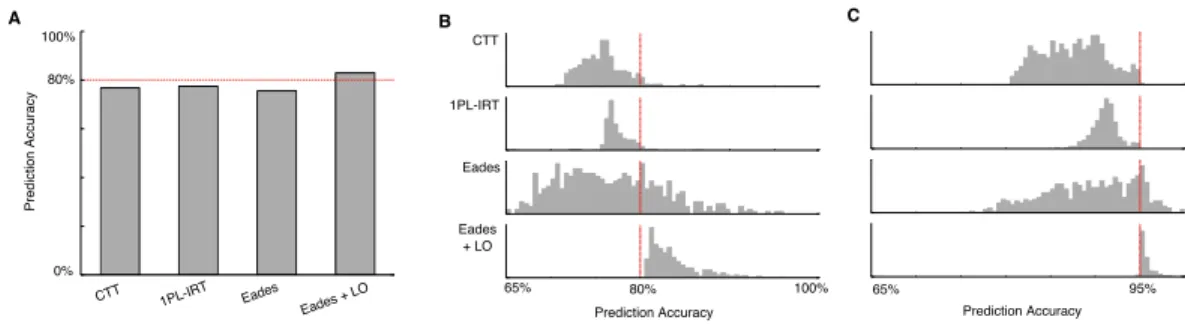
Eades CTT 1PL-IRT Eades + LO 100% 0% Pre di ctio n A ccu racy A 65% 80% 100% B Eades CTT 1PL-IRT Eades + LO Prediction Accuracy 65% 95% Prediction Accuracy C 80%
Baseline Prediction Accuracy
Figure 2: The Eades’ algorithm followed by local optimization (Eades + LO) is accurate for simu-lated data.A, accuracy of different assessment methods for a single representative simulated dataset, with a baseline prediction accuracy of 80% (see Sec. 3.2). Only theEades + LOalgorithm exceeds the baseline (a lower bound on optimal prediction accuracy). Results are similar across 500 sim-ulations at 80% baseline prediction accuracy (B) and 500 simulations at 95% baseline prediction accuracy (C).
produce a new minimum in parameter space). The baseline prediction error can be converted to a baseline prediction accuracy by subtracting it from 100%.
We produced two types of simulations using this procedure. The first type consisted of 1000 small datasets, split into two groups of 500 each at a baseline prediction error of 5% and 20%. For each small dataset (in both groups), other parameters were drawn from uniform distributions with the number of students ranging from 100-600, the number of items ranging from 10-60, average scores ranking from 40-100%, and completion rate ranging from 10-100%.
The second type of simulation directly modeled the data contained in the student response Dataset 1: for each of the concept partitions (more than 650), we simulated a new dataset with the same number of students, number of items, average score, and completion rate. For each concept partition dataset, the baseline prediction error rate was set uniformly at random (from 0-20%).
4
Results
4.1 Bipartite partial tournament ranking optimizes accuracy for simulated data
As mentioned in Sec. 2.3, the algorithm we use to estimate the tournament ranking error (Eades + LO) is a heuristic solution to the NP-hard problem of finding a feedback arc set. Because of its heuristic nature, we evaluate its performance empirically on the simulated datasets.
The results of the performance on simulations are shown in Fig. 2. A single representative simulation point is shown in Fig. 2A. For this simulation, both of the traditional assessment approaches (1PL-IRT and CTT) fall below the baseline prediction accuracy (indicating that they make more prediction errors than were introduced during simulation). The standard Eades’ algorithm also falls below this baseline, while the Eades’ algorithm followed by local optimization (Eades + LO) exceeds the baseline prediction accuracy.
Figs. 2B and C show the distribution of prediction accuracies for all 1000 simulated dataset samples. For the simulated datasets at 80% baseline prediction accuracy,Eades + LOexceeds the baseline prediction accuracy in every case (B), while at 95% baseline prediction accuracy,Eades + LO ex-ceeds the baseline in 98% of cases (and in these cases, it fell short a small amount). In every case,
Eades + LOfar exceeds the performance of the traditional assessment approaches.
Finally, we also tested theEades + LOalgorithm on the dataset created for the second, larger simu-lation (data not shown), and found again that the algorithm is able to exceed the baseline prediction accuracy in all but one case (out of more than 650 trials), where it falls below the baseline by 0.01%-point.
A 65% 100% B Prediction Accuracy 65% 100% Prediction Accuracy Dataset 1 Dataset 2 Freq u e ncy
Figure 3: The tournament ranking accuracy of recorded student responses (via theEades + LO
algorithm) for the datasets described in Sec. 3.1. For both Dataset 1 (A) and Dataset 2 (B), accuracies range from 82-100% with a mean of 93%. Each sample here represents interactions with a single concept.
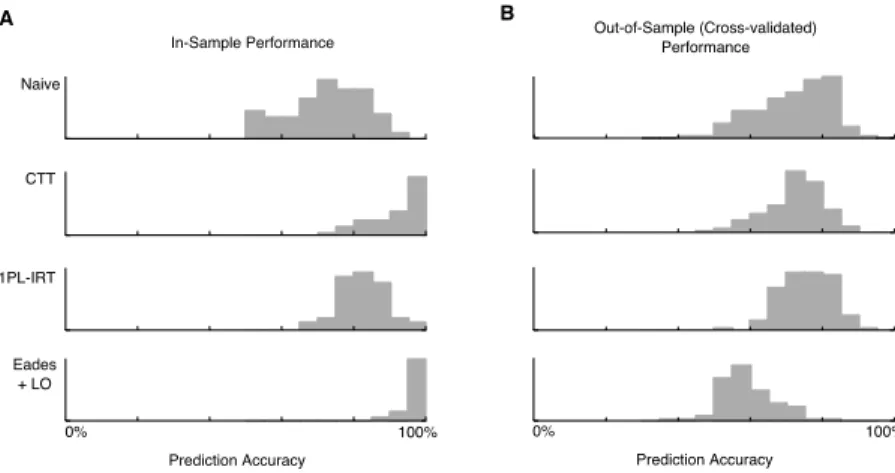
In-Sample Performance Out-of-Sample (Cross-validated)Performance
0% 100% Prediction Accuracy 0% 100% Prediction Accuracy CTT 1PL-IRT Eades + LO A B Naive
Figure 4: Comparison of in-sample vs. cross-validated accuracy for a assessment methods on a portion of Dataset 1. A, all three assessment methods (CTT, 1PL-IRT, and tournament ranking via
Eades + LO) compare favorably to a naive method (total proportion correct across all responses) for
in-sample data. Unlike for simulated data (Fig. 2), the CTT method has a higher accuracy then 1PL-IRT for in-sample prediction, but as was the case for simulations, the tournament ranking algorithm outperforms other methods. B, not all methods compare favorably to a naive method for cross-validation however. In particular, the tournament ranking algorithm cross-validates poorly. CTT and 1PL-IRT are more accurate in cross-validation (IRT in particular).
4.2 Model-implied minimum prediction error rates on student response data average around 93%
Having established that theEades + LO algorithm provides a reliable estimate of the minimum number of prediction errors for a given student response dataset assuming fixed student abilities and item difficulties, we next use it to calculate the minimum prediction error rates for Dataset 1 and Dataset 2.
As mentioned in Sec. 3.1, both Dataset 1 and Dataset 2 contain tens of thousands of items which themselves are partitioned into pedagogical areas called “concepts”. We consider each concept partition separately, which breaks the datasets into about 1000 smaller groupings.
TheEades + LOalgorithm’s prediction accuracies (i.e. approximate maximum accuracies) for the
concept partitions in both datasets is shown in Fig. 3. In both cases, prediction accuracies range from 82-100%, with a mean of about 93%. This means that the minimum error rates for these datasets averages 7%, with some concept partitions reaching 18% minimum prediction error.
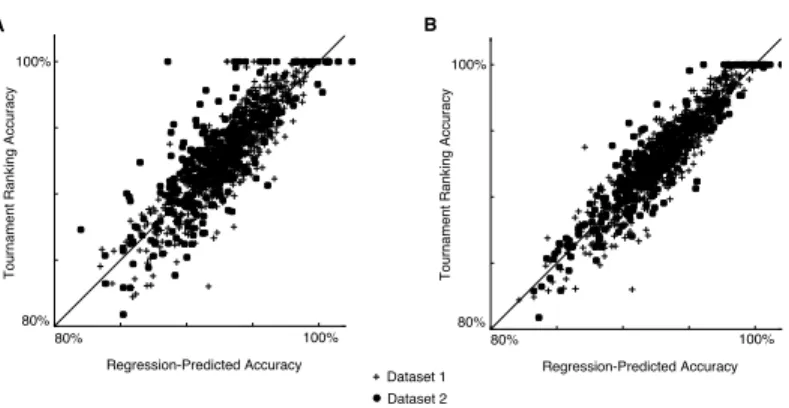
Dataset 1 80% 100% Regression-Predicted Accuracy A B To u rnam e nt R anking A ccu racy 80% 100% 80% 100% Regression-Predicted Accuracy To u rnam e nt R anking A ccu racy 80% 100% Dataset 2
Figure 5: Tournament ranking-based accuracies (viaEades + LO) for student response data correlate well with basic statistics. A, a linear regression on tournament ranking-based accuracy from mean response score, number of students, and the average number of questions answered per student yields an R2 of 73%. B, a linear regression on tournament ranking-based accuracy with a
3rd-degree polynomial in mean response score, number of items, and the mean item completion rate yields anR2of 85%.
4.3 Assessment methods show differing performance on cross-validation
The assessment approaches examined here are complex, and are susceptible to over-fitting. We therefore use a common method to check for over-fitting: cross-validation [19]. Our scheme for cross-validation fits an assessment model using “in-sample” data, and holds out a small amount of responses (1 per student) randomly for the “out-of-sample” testing data.
The mean prediction accuracies (per concept) for the in-sample and out-of-sample data are shown in Fig. 4. For each of the assessment methods (CTT, IRT, and tournament ranking viaEades + LO), the in-sample performance (Fig. 4A) is higher than a naive baseline (the total proportion of correct answers), and the tournament ranking outperforms both traditional assessment methods (as expected).
The out-of-sample performance (Fig. 4B) for the assessment methods shows a more complex story however. Each of the assessment methods exhibits lower performance on the out-of-sample data, but the tournament ranking performance drops the most, to a level below even the naive baseline. The performance of CTT drops to slightly below IRT on the out-of-sample data, and IRT (which was the assessment method with the lowest performance on in-sample data) is the most accurate on out-of-sample data.
4.4 Minimum prediction error rates are predictable
While the tournament ranking model shows poor cross-validation performance, the property that the tournament ranking accuracy approximates an upper bound on prediction accuracy for all models based on static student and item parameters is useful as a method to provide reference values on performance and on student behavior. We therefore examined this relationship further.
As can be seen in Fig. 5, the tournament ranking scores can be well-predicted (on average) from statistics about the datasets on which they are calculated. In particular, a linear model on three features was able to capture 73% of the tournament ranking score variance (Fig. 5A), and a linear model on a 3rd-degree polynomial involving three features was able to capture 85% of the score variance. Since the tournament ranking score (calculated via approximating a FAS) is nota priori
related to these features, this implies a predictability in the pattern of student responses in web-based learning environments.
5
Discussion
Here we have evaluated three related types of assessment approaches to tens of millions of student interactions in two web-based learning environments. We found that of the two popular assessment approaches (1PL-IRT and CTT), the IRT approach is not as accurate in predicting individual student responses for in-sample data, though it has an advantage in cross-validated (out-of-sample) accuracy. We also introduced a related third model (bipartite partial tournament ranking) and associated al-gorithm (Eades + LO) that approximates the upper bound of the prediction accuracy for in-sample data (assuming static student abilities and item difficulties). This model, while NP-hard in general, can be efficiently and accurately approximated by combining two known simple techniques (Eades’ algorithm with a single vertex moves local optimization). It should be emphasized that these three approaches model student behavior with the same total number of parameters, and vary only in their regularizations and fitting algorithms (which can still result in dramatic differences for in-sample and out-of-sample accuracy [19]).
The tournament ranking-based predictions (while providing very poor cross-validation performance) yield a reference point to comparison with other algorithms – for example, if a dataset has a tour-nament ranking-based prediction accuracy of 85%, then an IRT model fit to this dataset cannot reasonably be expected to have a prediction accuracy higher than 85%.
The tournament ranking-based prediction accuracies were also shown to correlate well with simple dataset features. This is important, since the accuracy of tournament ranking-based predictions is defined by the size of a feedback arc set in the data – predictability of this feature hints at some conserved student behavior across the datasets. It is possible that modeling approaches which are better-tuned to continuous assessment in online educational environments could take advantage of (or explain) this property.
We did not use discrimination item parameters in either the IRT or the CTT models. This choice was made for two reasons. The first reason is that by using the same dimensionality for each assessment model, we could limit comparisons to the choice of fitting algorithm and regularization, simplifying the interpretation of the results (especially since discrimination has no effect on the prediction of single-item responses). The second reason is that a 2PL-IRT model [4] (using a discrimination parameter) yielded prediction accuracy results that were nearly indistinguishable from the 1PL-IRT model used here.
Finally, this study has two caveats. The first is the use of single-item prediction accuracy as a metric. Although this choice simplifies analysis and makes traditional machine learning approaches (including cross-validation) straightforward, a metric based on (for example) predicting responses to collections of items together may yield different results (especially when considering models which do include discrimination parameters).
The second caveat is the choice to limit models to those that use static student abilities. While this choice was made so that traditional and well-studied assessment approaches could be compared using the student responses from web-based learning environments, it stands to reason that an as-sessment method that can take learning into account should have measurable advantages for this type of data. This work is intended as a step in that direction, by providing a necessary point of comparison.
Acknowledgements
We’d like to thank our colleagues in the Knewton data science community for their support during the creation of this paper. In particular, we’re thankful for the thoughtful feedback we were given by David Kuntz, Jesse St. Charles, Illya Bomash, Kevin Wilson and Yan Karklin.
References
[1] Yoav Bergner, Stefan Droschler, Gerd Kortemeyer, Saif Rayyan, Daniel Seaton, and David E. Pritchard. Model-Based Collaborative Filtering Analysis of Student Response Data: Machine-Learning Item Response Theory.International Educational Data Mining Society, 2012.
[2] Robert J. Mislevy and Geneva D. Haertel. Implications of Evidence-Centered Design for Ed-ucational Testing. Educational Measurement: Issues and Practice, 25(4):6–20, 2006.
[3] Young-Jin Lee. Developing an efficient computational method that estimates the ability of stu-dents in a Web-based learning environment.Computers & Education, 58(1):579–589, January 2012.
[4] Frederic M Lord, Melvin R Novick, and Allan Birnbaum. Statistical theories of mental test scores. 1968.
[5] Alejandro Pe˜na Ayala. Educational data mining: A survey and a data mining-based analysis of recent works. Expert Systems with Applications, 41(4):1432–1462, March 2014.
[6] M. Orlando and D. Thissen. Likelihood-Based Item-Fit Indices for Dichotomous Item Re-sponse Theory Models. Applied Psychological Measurement, 24(1):50–64, March 2000. [7] X. Fan. Item Response Theory and Classical Test Theory: An Empirical Comparison of their
Item/Person Statistics. Educational and Psychological Measurement, 58(3):357–381, June 1998.
[8] A De Champlain. A primer on classical test theory and item response theory for assessments in medical education: Classical test theory and item response theory. Medical Education, 44(1):109–117, January 2010.
[9] Noga Alon. Ranking tournaments. SIAM Journal on Discrete Mathematics, 20(1):137–142, 2006.
[10] Claire Kenyon-Mathieu and Warren Schudy. How to Rank with Fewer Errors. STOC, pages 95–103, 2007.
[11] Richard M Karp.Reducibility among combinatorial problems. Springer, 1972.
[12] Peter Eades, Xuemin Lin, and William F Smyth. A fast and effective heuristic for the feedback arc set problem. Information Processing Letters, 47(6):319–323, 1993.
[13] Pierre Charbit, St´ephan Thomass´e, and Anders Yeo. The minimum feedback arc set problem is NP-hard for tournaments. Combinatorics, Probability and Computing, 16(01):1–4, 2007. [14] Patrick Slater. Inconsistencies in a Schedule of Paired Comparisons.Biometrika, 48(3/4):303,
December 1961.
[15] Joseph D Novak. Concept mapping: A useful tool for science education. Journal of research
in science teaching, 27(10):937–949, 1990.
[16] Ray McAleese. Concept Mapping A Critical Review. Innovations in education and training
international, 36(4):351–360, 1999.
[17] J P Doignon and J C Falmagne.Knowledge spaces. Springer, 1999.
[18] Gwo-Jen Hwang. A conceptual map model for developing intelligent tutoring systems.
Com-puters & Education, 40(3):217–235, 2003.
[19] Trevor Hastie, Robert Tibshirani, and Jerome Friedman. The elements of statistical learning, volume 2. Springer, 2009.