Leverage Constraints, Protability, and Risk-Shifting in
the Aftermath of Dodd-Frank
Rawley Z. Heimer
∗Brandeis University, International Business School
August 15, 2012
Abstract
This paper provides evidence that leverage constraints can improve investor welfare and reduce unprotable speculation. In accordance with Dodd-Frank, the CFTC halved the maximum permissible leverage available to U.S. retail foreign exchange traders from 100:1 to 50:1. By comparing U.S. and European traders on the same brokerages, I show that the leverage constraint brought a reduction in average losses with no change in return volatility. Unable to use leverage to generate volatility, investors traded more frequently on days with high implied volatility, a form of risk shifting. The possibility that nancial market regulation can protect traders from their own behavioral biases is supported by evidence that overcondent investors benet most.
∗Brandeis International Business School Mailstop 032, P.O. Box 549100, Waltham, MA 02454, USA.
e-mail: [email protected].
I am grateful for support from Brandeis University and to faculty for advice. This research has ben-eted from conversations with Daniel B. Bergstresser, Alain P. Chaboud, Jens Hilscher, Blake LeBaron, Debarshi K. Nandy, Carol L. Osler, David Simon, and David Sraer. I also thank the operators of the social network for providing me with the data, especially Alex Dusenbery for helping setup the database. This version is preliminary and incomplete. All errors are my own.
1 Introduction
In the nine years since the passage of the [Commodity Futures Modernization Act of 2000], the Commission has observed a number of improper practices that have raised concern, among them [...] the targeting of unsophisticated, elderly, low net worth and other vulnerable individuals.
Commodity Futures Trading Commission, January 20, 2010
The debate among policy makers and academics regarding the role of leverage in nancial markets stems back to at least the Stock Market Crash of 1929.1 Recent theory
(Geanako-plos, 2009) along with much anecdotal evidence from the 2008 U.S. nancial crisis suggest that leverage induces unprotable speculation and contributes to the propagation of asset price bubbles and busts. In the wake of the 2008 Financial Crisis, policy makers were forced to react to the damage caused by nancial instability by implementing the DoddFrank Wall Street Reform and Consumer Protection Act on July 21, 2010. Among the tasks set forth by Dodd-Frank, the Commodity Futures Trading Commission (CFTC) began to investigate the activities in a burgeoning market, retail foreign exchange trading.2 This required the
registration of retail brokerages with the CFTC and brought the promise of further regula-tion. By October 18, 2010 the CFTC required all retail foreign exchange trading platforms to reduce the amount of leverage available to its U.S. clients from 100:1 to 50:1 on all major currency pairs with the stated intention of protecting their welfare. Contrary to the goals of
1The Securities Exchange Act of 1934 gave the Federal Reserve System authority to regulate margin
requirements.
2According to the Bank of International Settlements and the New York Stock Exchange (NYSE), the
the CFTC, most standard economic theory posits that allowing the use of leverage levels the playing eld for low-wealth investors and restricting leverage harms their protability. This research seeks to reconcile this debate by examining the activities of U.S. retail foreign ex-change traders relative to their European counterparts before and after the implementation of the CFTC trading rule.
This paper nds strong support in favor of the rule change. Following the reduction in leverage, investors increase their protability by around 0.1% per trade which amounts to roughly 0.8% on days in which they trade. Concurrently, there is no change in the volatility of their returns. Unable to use leverage to generate volatility when prices are stable, investors trade more frequently on days with high implied volatility. This hints at a link between the use of leverage and a speculative motive for trading (Galbraith (1993) and Moore (1966)).3
From a regulatory perspective, these ndings suggest that a leverage constraint can curb cumulative losses and improve trader welfare particularly since the poor performance of individual investors is documented across many dierent markets. For instance, Barber, et al. (2009) nd that Taiwan's retail investors underperform the market by 3.8% and accumulate losses that amount to 2.2% of Taiwan's GDP annually.
Secondly, little is known about the ability of individual investors to inuence asset prices. Recent work by Foucault, et al. (2011) nds that retail investors act as noise traders in nancial markets and reductions in their cumulative activity results in lower idiosyncratic volatility. In this study, U.S. investors decrease the size of their trades by around two-thirds a standard deviation and the number of trades falls by 13% per-day, suggesting that the trading rule is also likely to reduce intraday currency volatility particularly during trading hours
3When providing explanation as to why leverage constraints have remained in place since 1934, even
during periods of stability, Moore (1966) states: The reasons for the lack of opposition to [controls on leverage] probably lie in the small number of individuals aected and in a belief that the controls protect the community from 'excessive' speculation.
in which U.S. participants are more active. However, trades made by margin constrained investors are more likely to be entered into on days in which implied volatility is high, a nding that is consistent with Frazzini and Pederson (2011), in which leverage constrained investors hold a higher fraction of high-beta stocks in their portfolio. This suggests that while average daily volatility may fall as a result of having their leverage reduced, investors may crowd in during turbulent days and exacerbate large price movements.
The eect of leverage constraints on investor trading activity is under-studied for a few reasons. Firstly, data on individual investors and their use of leverage has been dicult for researchers to obtain. Secondly, it is dicult to draw a causal interpretation from other data sources since there is likely an endogenous relationship between trading on margin and investor activities. For instance, unprotable retail traders are likely drawn towards trading environments oering higher leverage since trader protability is increasing in wealth (Bonaparte and Fabozzi (2009)) and those possessing less capital require more leverage. They also exhibit preferences towards lottery-type stocks ones with lower expected value but high idiosyncratic skewness (Kumar (2009)) and greater leverage helps facilitate these types of gambles.
To overcome the problem of endogeneity, I analyze the impact of a trading rule instituted by the CFTC in October, 2010 that required retail foreign exchange trading platforms to reduce the amount of margin oered to its clients from 100:1 to 50:1 on all major currency pairs. Simply examining the dierence in trading activity before and after the rule change is not sucient to fully identify the eect of reduced leverage since changes may be caused by unrelated dierences in market conditions that simultaneously aected all investors. How-ever, the rule only impacted U.S traders. Therefore, I compare U.S. traders to a group of their European counterparts before and after the legislation.
European retail foreign exchange traders prove to be a good control group with which to compare to their U.S. counterparts. For one, both sets of market participants hold accounts on the same online brokerages. Furthermore, traders from both locales have self-selected into a social network that allows for an unprecedented opportunity to track and mimic the activities of other traders. In addition to chatting and posting in forums on the website, friends in the social network are able to view each others portfolios in real-time. Upon examining the aggregate activity of both groups of traders, I nd a positive correlation between when they trade, make and lose money, and use leverage. This suggests a common set of trading strategies is utilized by traders on both sides of the Atlantic and any dierences in their activity following the CFTC trading rule can be attributed to the reduction in leverage.
I ensure that the legislation has a binding eect on the amount of leverage used by U.S. traders by showing that average leverage use falls after the legislation. Consistent with the fact that tighter margins increase the cost of trading, U.S. investors reduce the size of their trades by around two-thirds a standard deviation following the CFTC trading rule. They also trade less frequently reducing the amount of trades they make by around 13% on days in which they trade.
When investigating the eect of lower leverage on trader protability, I start by docu-menting a strong negative correlation between the amount of leverage used and per-trade protability. A one unit increase in the amount of leverage (for instance, 20:1 to 21:1) is associated with a decrease in the per-trade return on investment of about 0.016%.
To determine if there is a causal relationship, I employ dierence-in-dierences regres-sion analysis using European traders as a control group and the CFTC trading rule as an exogenous shock to trader leverage use. Following the reduction in leverage, U.S. investors
increase their protability by around 0.1% per trade relative to the control group. This relationship holds even after controlling for per-trade factors such as the size of the trade, the holding period, the currency pair, and the direction, as well as trader specic factors such as their trading style, experience, and the brokerage they place their trades on. I also employ a placebo test using false dates for the rule change. It veries that my results are unlikely to occur by changes in market conditions unrelated to the leverage constraint.
My ndings lead to the following question: why would individual investors perform bet-ter when they are leverage constrained? I propose and test the following theory. Individual investors perform poorly because they exhibit overcondence in their own abilities, causing them to overweight their own beliefs relative to those of others (Odean (1998)).4 The
intro-duction of a leverage constraint induces a non-zero probability that other traders drive down prices resulting in a margin call, which occurs regardless of the trader's own beliefs or the terminal value of the asset (similar to DeLong, et al. (1990)). The investor recognizes this possibility and falls more in-line with common signals known to all investors. This yields the testable prediction that the greater the overcondence, the greater the improvement in trader performance when leverage constraints are binding.
To test this theory, I draw from the social networking aspect of the dataset. Since, [m]ore socially dominant individuals ... make more condent judgments, holding constant their actual ability, (Burks, S.V. et al (2010)) I proxy for overcondence using the number of friends a trader has in the social network. For robustness, I also use measures of network centrality borrowed from graph theory, namely betweenness and eigenvector centrality. I then
4Daniel, Hirshleifer, and Subrahmanyam (1998, 2001), Kyle and Wang (1997), and Bernardo and Welch
(2001) all rely on similar modeling assumptions, that overcondent traders overweight their own beliefs. However, Odean (1998) is the only to consider the case in which traders are price-takers. On the other hand, Schienkman and Xiong (2003) motivates overcondence dierently, suggesting they hold a speculative motive for asset market participation.
nd that margin constrained investors who are more overcondent have a greater increase in protability following the CFTC rule change than other traders.
The theoretical literature has until recently been decidedly in favor of the notion that leverage constraints lower investor welfare. A textbook example of trading on margin (Pindyck and Rubinfeld (2009)) suggests that investors with a low level of risk aversion may prefer to invest more than 100% of their wealth in risky assets and are thus worse o when unable to use leverage. A few recent theoretical works predict the opposite. Wang (2011) nds that margin constrained investors may be better o; however, her model relies on a higher probability of endogenously formed price reversals. Coen-Pirani (2005) also nds possible increases in investor protability, but his model also predicts that margin constraints increase trading volume which is at odds with my empirical ndings.
On the empirical side of the literature, Linnainmaa (2003) documents a negative rela-tionship between the amount of leverage used and the returns from a round trip trade among Finnish stockholders, but makes no claims to a causal interpretation. Foucault, et al. (2011) nds that a reform reducing the ability of retail traders to borrow on Euronext Paris reduced the amount of speculative buying as well as the idiosyncratic volatility of stock prices.5 To
the best of my knowledge, no other empirical studies exist that examine the use of leverage on investor activities.
The paper is organized as follows. In Section 2, I provide a detailed account of the CFTC trading rule limiting the amount of leverage available to retail traders. In Section
3, I outline the proprietary dataset used in the empirical analysis, the results of which are presented in Section 4. I examine whether the trading rule aected the volatility of their returns in Section 5. In Section 6, I present a theory that predicts how tightened margin
5Using U.S. stock return data from 1857 through 1986, Schwert (1989) nds that there is no historical
requirements can improve the protability of overcondent traders and show empirically that the legislation had a stronger eect on their protability. The nal section oers policy recommendations and concludes.
2 The CFTC trading rule reducing leverage
The retail foreign exchange trading market has experienced unprecedented growth over the past decade. Barely in existence in the early 2000s, the emergence of online trading platforms has propelled the retail market. Worldwide retail foreign exchange trading volume grew over seventy percent during 2007 to 2010 and now exceeds $125 to $150 billion per day (King and Rime (2010)), roughly the same as daily turnover on the entire NYSE family of stock exchanges (NYSE, Arca and Amex). According to the introductory quote by the CFTC, much eort went into attracting new customers, including those with little chance of successfully navigating the market.
The 2008 Financial Crisis brought to light many unscrupulous practices in which nancial institutions have taken advantage of a susceptible customer base. Legislators were forced to respond and on July 21, 2010, the DoddFrank Wall Street Reform and Consumer Protec-tion Act was passed. The act brought widespread changes to the nancial industry and even included the creation of the United States Consumer Financial Protection Bureau. In par-ticular, Dodd-Frank asked the CFTC to engage in further oversight of the various markets within its domain.
The CFTC itself began considering methods to protect consumer welfare in the forex market in anticipation of the passage of Dodd-Frank. On January 20, 2010, the CFTC released in the Federal Register a proposal to limit leverage available to retail customers
to 10:1 on all pairs.6 Shortly after the passage of Dodd-Frank on September 10, 2010, the
CFTC released a nalized set of rules which required all retail brokerages to register with the CFTC and for them to limit the amount of leverage available to U.S. customers to 50:1 on all major pairs and 20:1 on exotics. All brokerages were required to come into compliance with the new rules by October 18, 2010. The words of CFTC Chairman Gary Gensler summarize the intended purpose of the rule change:
These rules of the road will help protect the American public in the largest area of retail fraud that the CFTC oversees: retail foreign exchange. All CFTC registrants involved in soliciting and selling retail forex contracts to consumers will now have to comply with rules to protect the investing public. This is also the rst nal rule that the Commission has published to implement the Dodd-Frank Wall Street Reform and Consumer Protection Act.7
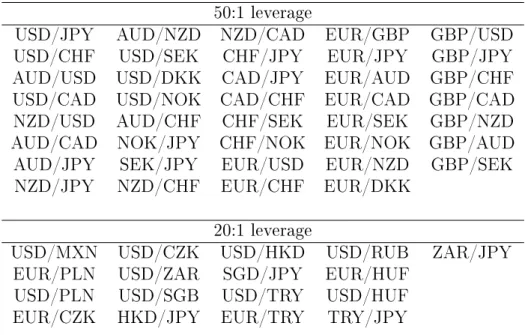
The most important feature of the CFTC regulations that had a direct eect on the activity of retail foreign exchange traders was the imposition of tighter margin requirements from 100:1 to 50:1 on all major currency pairs and to 20:1 on exotic pairs (all pairs are listed in Table 1). Interestingly, retail brokerages in forex typically have clients from around the globe. Thus the brokerages were tasked with limiting the available leverage only to a subset of their clients. The rule change, along with this feature of the market, provide an ideal setting in which to examine the impact of a reduction in the amount of leverage available to traders.
6www.cftc.gov/LawRegulation/FederalRegister/ProposedRules/2010-456a 7http://www.cftc.gov/PressRoom/PressReleases/pr5883-10
3 The data: myForexBook
The data used in the following empirical analysis was compiled by a social networking website that, for privacy purposes, I call myForexBook. Registering with myForexBook which is free requires a trader to have an open account with one of roughly 45 retail specic foreign exchange brokers. Once registered, myForexBook can access a trader's complete trading record at those brokers, even the trades they made before joining the network. New trades are entered via the retail brokerages but they are simultaneously recorded in the myForexBook database and are time-stamped to the second. Hence, there are no concerns about reporting bias. An example of a myForexBook user's homepage is displayed in Figure
1. There are 5,693 traders in the database who made a total of roughly 2.2 million trades. A more detailed discussion of the social networking aspects of the database is available in Heimer and Simon (2012).
I trim the data in several ways. First, I restrict the population of traders to those located in either the United States or Europe. While there are traders from other locations present in the dataset it is unclear what their margin requirements are. Furthermore, the overlap between typical U.S. and European trading hours provides for a more clear quasi-experimental setting. For instance, if I were to compare the U.S. investors to a sample in Japan it may be that unrelated changes to market conditions during business hours in Japan made the market less favorable for Japanese traders over the course of the sample period. Secondly, I restrict the trader population to the set issuing trades both before and after the trading rule was implemented. Failing to do may bias any econometric analysis since certain groups of traders may have had a greater propensity to exit the market upon the implementation of the CFTC imposed margin requirements.
data is used for robustness. I remove the outer one percent of all observations of return on investment (ROI) to ensure that extreme returns in either direction do not bias any empirical estimates. This leaves the per-trade ROI within a range of 70% to 120%. I further eliminate the outer one percent on the upper tail of the distribution for margin use, which censors the data at no more than 400:1 leverage. Lastly, while the majority of trades in the dataset occur between early 2009 and December, 2010, I restrict the analysis to trades made between September 1, 2010 and December 1, 2010 so that a roughly equal amount of time passes before and after the legislation. This leaves a total of 266,248 trades made by 1,071 traders, 489 of whom are from the U.S. and 582 are from Europe.
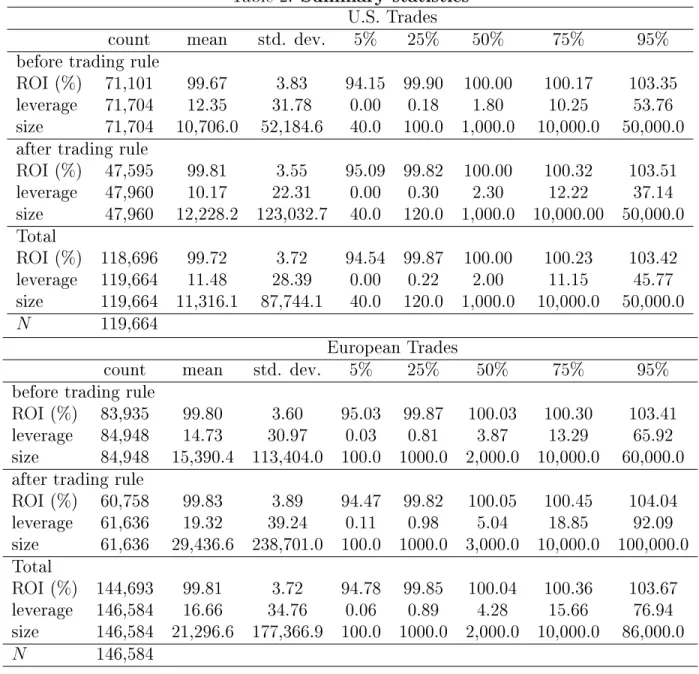
Summary statistics on per-trade ROI, separated by U.S. and European traders before and after the CFTC trading rule, are presented in Table2. A common theme is present across all groups: while the median trade is slightly protable, the mean trade is unprotable losing around 0.2% ROI. This is unsurprising since foreign exchange trading is a zero-sum game and the transaction costs most notably, paying the dealer the spread pushes the expected value slightly negative. Furthermore, the distribution has a high kurtosis with nearly half of all observations earning or losing less than 0.1% ROI, but a standard deviation of 3.83%.
With regards to leverage use, summary statistics are also presented in Table 2. Notably, European traders in the sample use more leverage than U.S. traders regardless of whether the measure of centrality is the mean or the median, or if the observations are before or after the CFTC rule. Furthermore, 7.5% of all trades within the sample period were issued with leverage greater than 50:1. Leverage use drops substantially among U.S. investors following the CFTC trading rule from 9.40% to 2.59% of all trades utilizing greater than 50:1 margin. On the other hand, leverage used by European traders experiences a slight uptick. Respectively, 7.00% and 8.06% of all European trades use greater than 50:1 leverage
prior to and after October 18, 2010.
It is important to note that while there is a substantial drop in the number of instances in which U.S. traders use greater than 50:1 leverage after October 18, 2010, there are ob-servations seemingly in violation of the CFTC rule. For one, it is possible that the CFTC was unable to perfectly enforce the trading rule. Given that regulation in this market was a new phenomena and that there are over 45 brokerages in the dataset, some may have had diculty coming into compliance. Another possibility is that there are reporting errors. The social network may at times inaccurately download data from the brokerage servers. This explanation appears unlikely; I use foreign exchange prices downloaded from Yahoo! Finance to externally validate the accuracy of the untrimmed database and less than 0.0001% of all trades fall outside the daily range of prices in the currency pair. Regardless, while some trades still use more than 50:1 leverage, the CFTC trading rule is clearly eective in limiting the amount of leverage available to traders.
4 Leverage and protability
4.1 Correlation of leverage and return on investment
First, I examine the relationship between return on investment and the leverage use of individual traders. I estimate the following regression via OLS:
roij,i,t =β0 +β1∗leveragej,i,t+β2∗Xj,i,t+β3∗Xi+εj,i,t (1)
where roij,i,t is the ROI for trade j, issued by trader i, at time t, the second in which the
while Xj,i,t is a matrix of features that belong to each trade issued and Xi is a matrix of
trader characteristics. Standard errors are clustered by trader.
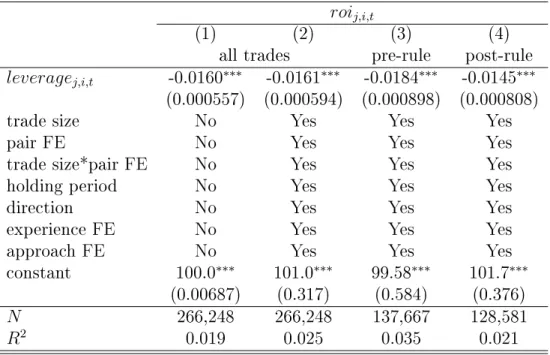
There is a strong correlation between the amount of margin used and the return on investment per-trade. In the rst column of Table 3, I present estimates of the binary relationship between the amount of margin and the return on investment. A one unit increase in the amount of margin (for instance, 20:1 to 21:1) is associated with a decrease in the return on investment of about 0.016%. This implies that if a trader is using the most available margin prior to the CFTC trading rule (100:1) then the mandated reduction to 50:1 increases the per-trade return on investment by about 0.8%. This relationship holds when I include controls for the holding period on the trade, the size of the trade interacted with the currency pair8, trader experience, the trader's trading style, and brokerage and
currency pair xed eects. Furthermore, the magnitude of the relationship is roughly stable across time although the coecient on marginj,i,t is slightly larger before the CFTC rule
change was implemented.
Thus, there is a negative relationship between an investor's use of leverage and the prof-itability of their trades. However, as illustrated in the introduction, the amount of margin available could stimulate unprotable trading activity, which precludes a causal interpreta-tion of the previous result.
4.2 Empirical strategy
The CFTC trading rule issued in October, 2010 oers a good quasi-natural experimental setting in which to identify the eect of leveraged trading on investor protability. This trading rule reduced the amount of leverage available to U.S. investors, but did not have an
8The size of the trade is dependent on the currency pair chosen presumably because traders are often
eect on European traders. Since there is no a priori reason to believe that the trading rule directly inuenced the protability of traders, any change in the protability of U.S. traders when compared to European traders following the trading rule must be attributed to the reduction in leverage.
In the following section, I verify that U.S. and European traders behave similarly which would imply that European traders are a good control group with which to study the impact of the trading rule. I continue by conrming that the trading rule had a binding eect on U.S. traders by showing that it reduced the amount of leverage they use. Since the reduction in leverage increases the out-of-pocket cost to the investor, the trading rule should also reduce the frequency with which U.S. investors trade and the size of their trades.
Are the EUR and US traders similar?
In this section, I explore whether or not European traders make for a good control group with which to examine the eect of reducing the amount of leverage available to U.S. retail foreign exchange traders. I examine the aggregate trading activity of the U.S. and European traders by exploring both how much they trade and when, when they use leverage, and if their aggregate returns trend together.
First, I examine when retail investors in the U.S. and Europe trade. In Figure 2, I plot the time series of the total number of trades by each group. Traders from both groups are much more active during the work-week and tend to take the weekends o. Furthermore, I examine whether or not the U.S. and European traders increase and decrease their aggregate activity in concert. To do so, I take the log rst dierence of the aggregate number of trades per group (excluding weekends). I then calculate the Pearson's correlation coecient which is 97.2%, suggesting that there is an extremely strong positive correlation between the
aggregate trading activity of both groups.
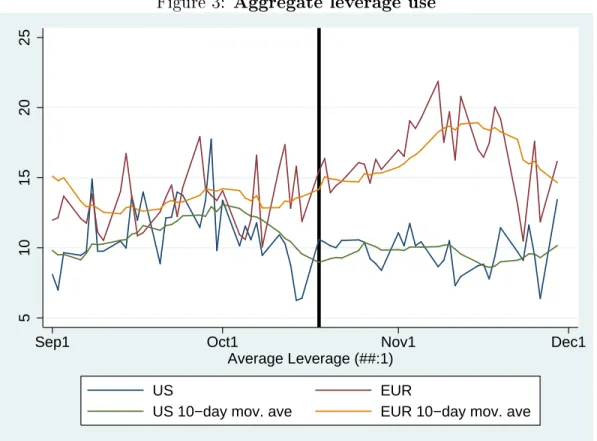
I also nd that U.S. and European traders have a similar pattern of leverage use. I plot the time series of average leverage use per day in Figure3as well as the ten-day moving average of both series. Noticeably, the moving average of the European leverage series is always greater than that of the U.S. reecting the less restrictive trading environment in Europe even prior to the October, 2010 CFTC trading rule. However, despite the dierence in levels, the moving averages trend together until a few days before the rule's implementation. After the trading rule, the average leverage used by European traders increases while that of the U.S. traders stays roughly constant. I also investigate whether the uctuations in their leverage use move together on a daily basis. I calculate the log rst dierence of average daily leverage per group (excluding weekends) and calculate the Pearson's correlation coecient between the two series. I again nd a positive correlation between the two groups; the Pearson's correlation coecient is 32.0%.
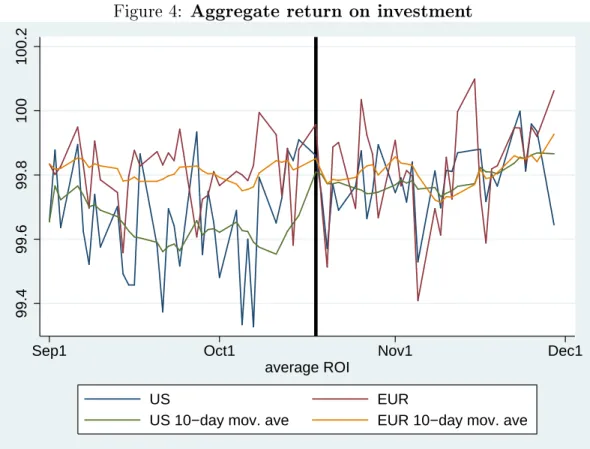
Lastly, I nd that the aggregate returns of U.S. and European investors tend to move together. The correlation coecient of the log rst dierence of average daily return on investment is 26.5%. Considering the well-known fact that there is little return predictability in nancial markets, this suggests a strikingly strong positive association between their aggregate uctuations. When I plot the time series of aggregate returns (Figure 4), I nd that their 10-day moving averages trend together both before and after the trading rule. However, after the trading rule, the level of average ROI increases for U.S. traders while staying roughly constant for those from Europe.
Taken together, these results suggest that the activities of U.S. and European traders mirror each other. It is possible that there are a common set of trading strategies that inuence the activity of traders in the U.S. and Europe. Therefore, it is safe to assume that
the sample of European retail traders used in this research makes for a good control group with which to examine the eect of tighter margins on trader welfare and behavior.
Was the CFTC trading rule binding?
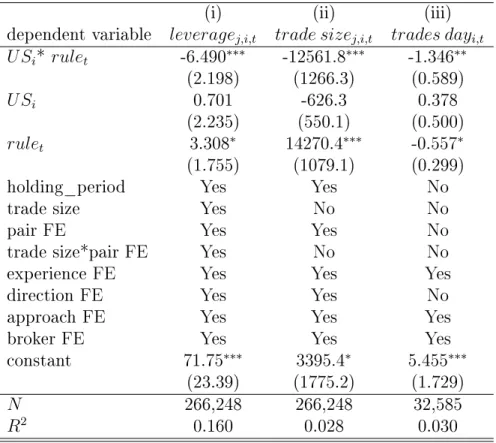
The next step is to show that the CFTC trading rule had a binding eect on the amount of leverage used by U.S. traders. For instance, it is possible that the CFTC was unable to enforce the rule change which would suggest that any empirical dierences found subsequent to the rule change are spurious. To this end, I empirically estimate if the the rule change reduced the amount of leverage used by U.S. traders relative to their European counterparts. Since a reduction in leverage should also reduce the volume of trading and there are two margins that determine aggregate volume, size and frequency, I further test if the rule change reduces the size of their trades as well as decreases the frequency with which they trade. As expected, I nd that following the rule change, U.S. traders use less leverage, the size of their trades is reduced, and they trade less frequently.
To test if the CFTC trading rule was binding, I estimate the following dierence-in-dierences regression via OLS :
Yj,i,t =γ0+γ1∗U Si+γ2∗rulei,t +γ3∗U Si∗rulei,t+γ4∗Xj,i,t+γ5∗Xi+j,i,t (2)
whereU Si is an indicator variable for if the trader's account is in the U.S. andruletis equal
to one if the day was opened after the CFTC rule on margin requirements went into eect on October 18, 2010. The dependent variable, Yj,i,t, is either (i) leveragej,i,t, the amount of
leverage used per-trade j, or (ii) the size of the trade denominated in the base-currency of
of trades issued in a given day, trades dayi,t. In this specication, the per-trade subscript j
is dropped and t is at a daily frequency. It is estimated conditional on having made at least
one trade during the day.
Estimation results are presented in Table4. In regression (i), I nd that leverage by U.S. traders falls by around six units relative to the control group following the trading rule. The linear model predicts that U.S. traders reduce their leverage use following the legislation from 14.5:1 to 11.3:1, while leverage use among European traders increased from 13.8:1 to 17.1:1. Considering that the distribution of leverage use is truncated at zero and heavily skewed to the right, I also estimate the following models: OLS estimation with the logarithm ofleveragej,i,t as the dependent variable, a zero-truncated Poisson regression estimated using
maximum-likelihood, and a negative binomial regression also with maximum-likelihood. The three alternative empirical models fail to change my ndings that the trading rule reduced the amount of leverage use.
I examine if the trading rule had an eect on the size of trades in regression (ii) of Table
4. I nd that the trading rule caused a statistically signicant reduction in the size of trades made by U.S. traders relative to the control group. The trade size is denominated in the base currency of the pair. Many traders are possibly unaware of this since the distribution of trade sizej,i,t is dependent on the chosen pair. As such, I include pair xed eects in all
regressions so that the size of the eect is a deviation around the average size per pair. I also rerun the same regression after calculating a z-score fortrade sizej,i,t conditional on the pair
and use it as the dependent variable. The results are largely the same in all specications; the CFTC trading rule results in roughly two-thirds a standard deviation decrease in the size of the trade.
of U.S. traders. In column (iii), I run a similar dierence-in-dierences regression in which the dependent variable is the number of trades issued in a given day t by trader i. The
regression is run conditional on having made at least one trade in said day. The empirical model predicts that U.S. traders reduce the number of trades they make per-day by about 1.35 which is roughly a 13% decrease in trading. Since the dependent variable is count data, I also estimate the regression using a zero-truncated Poisson regression and nd similar results.
Taken together, the results of the preceding analysis demonstrates that the CFTC trading rule had a binding eect on the leverage employed by U.S. retail foreign exchange investors. As a result, it is fair to assume that any subsequent change in U.S. trader activity following October 18, 2010 can be attributed to the reduction in leverage.
4.3 Return on investment and the CFTC trading rule
Aggregate U.S. performance following the rule
In order to examine the eect of the CFTC trading rule on average protability, I estimate the following regression using OLS:
U S minus EU R ROIt =γ0 +γ1∗rulet+t (3)
where U S minus EU R ROIt = ¯roiU S,t−roi¯ EU R,t, the average daily ROI in the U.S. minus
that in Europe, and rulet is equal to one if the day was opened after the CFTC rule on
margin requirements went into eect on October 18, 2010. A positive coecient on rulet,
γ1, in the empirical model would suggest that a reduction in leverage increases the average
Estimates of the OLS regression are presented in Table 5. γ1 is predicted to be roughly
0.12% to 0.13% and is strongly statistically signicant in all specications. This suggests that following the CFTC trading rule that limits the amount of leverage available to U.S. traders, they increase their protability relative to their European counterparts by about one and a quarter standard deviations. The result is in accordance with Figure4, in which I plot the time series of aggregate returns for both U.S. and European traders. There is a clear structural break around the time of the trading rule in which U.S. traders vastly improve their protability.
Performance on a per-trade basis
The above approach, while highly informative, is awed in that the activities of a few traders may be driving the results. To account for this short-coming, I disaggregate the analysis and examine the impact of the trading rule on a per-trade basis. I estimate the following dierence-in-dierences regression via OLS :
roij,i,t=γ0+γ1∗U Si+γ2 ∗rulei,t+γ3∗U Si∗rulei,t +γ4∗Xj,i,t+γ5∗Xi+j,i,t (4)
where U Si is equal to one if the trader is located in the U.S. and equal to zero if located in
Europe, and rulet is equal to one if the trade was opened after the CFTC rule on margin
requirements went into eect on October 18, 2010. The coecient γ1 captures the baseline
level of ROI if the trade is made by a U.S. trader, while γ2 is the baseline ROI for trades
issued after the legislation. The coecient on the interaction term U Si∗rulet, γ3, captures
the eect of the legislation. A positive value for γ3 suggests that the legislation increases
protability.
Estimates of the dierence-in-dierences regression are presented in Table 6. Consistent with the goals of the CFTC, the per-trade protability is higher for U.S. traders relative to their European counterparts after the implementation of the trading rule. The per-trade return on investment is between 0.1% and 0.135% higher after the margin requirements are tightened. In terms of economic signicance, the magnitude of the coecient hardly registers when measured in standard deviations. However, the distribution of ROI has a high kurtosis and roughly 42% of all trades falls within 0.135 of the mean. The magnitude of the reform is more striking when considering the fact that the average day of trading includes around seven or eight round trip trades.
The impact of the CFTC mandated margin requirements on returns is made apparent in Figure 5. I plot the cumulative density function (CDF) of each trade's ROI before and after the legislation for both U.S. and European traders. For the European traders presented in the second panel, the CDF nearly mirrors itself before and after the implementation of the trading rule. On the other hand, for the U.S investors whose trades are presented in the rst panel, there are a smaller fraction of trades on the extreme negative tail of the distribution after the trading rule. This suggests that limiting the amount of leverage available to traders reduces the frequency and magnitude of instances in which they fall o a cli and lose a substantial portion of their investment.
...
I further examine whether the trading rule increases the likelihood of making protable trades. Doing so is valuable since the point estimate in the preceding regression results may simply be driven by the large losses in ROI. Furthermore, if traders are able to learn how to
avoid these large losses then imposing leverage limits would not have as pronounced eect on their protability in the long run.
The results of estimating the following logistic regression,
P r(winningtradej,i,t) =γ0+γ1∗U Si+γ2∗rulei,t+γ3∗U Si∗rulei,t+γ4∗Xj,i,t+γ5∗Xi+j,i,t (5)
are presented in Table7. The dependent variable,winning tradej,i,t, is equal to one if trade
j, issued by investor i, at timet earns a ROI greater than one hundred percent, and zero if
it earns less than one hundred percent.
According to the results of the estimation, the CFTC trading rule caused a positive and statistically signicant increase in the likelihood of making a protable trade. However, the magnitude of the eect is not strong; the log-odds of making a protable trade increases by around 1.06 to 1.10 units relative to the control group. This may be due in part to the fact that only a small fractions of trades are placed with leverage above 50:1. The percentage of U.S. trades with leverage above 50:1 falls from 9.40% to 2.59% after the legislation. Regardless, this specication further supports the notion that there is a negative relationship between leverage and protability.
A placebo test for the CFTC rule change date
Lastly, I employ a placebo test to verify that the change in trader performance following the CFTC trading rule is unlikely to have been caused by chance. An alternative story that would explain my ndings is that the forex market undergoes frequent structural changes that aect U.S. and European traders dierently. Therefore, it would not be uncommon to see a statistically signicant coecient on the interaction term in the preceding
dierence-in-dierences regressions regardless of the date chosen to implement the regime change. I conduct the placebo test in the following manner. I run the same two dierence-in-dierences regressions as in Section 4.3, sketched out in Equation 4, using a placebo date instead of October 17, 2010, the date of implementation of the actual CFTC rule change. Starting with Sunday, May 3, 2009, I re-date the placebo rule change, rolling the date forward weekly until August 29, 2010. Before each regression, I perform the data-trimming exercise outlined in Section 3 which, among other things, restricts the sample group to those who have made trades both before and after the placebo rule change. My procedure produces 70 total regressions from which I collect the results after each iteration.
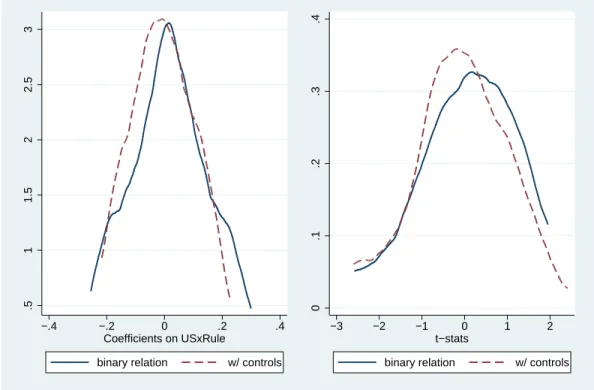
In the left panel of Figure 6, I plot a kernel-density estimate of the collected coecients on the interaction term between U Si ∗rulei,t, γ3. In the right panel, I provide the
kernel-density estimate of the corresponding t-statistics. The average placeboγ3 is between -0.0055
and 0.016, depending on the model specication, with a standard deviation of around 0.12. Its t-statistic averages between -0.087 and 0.065 and has a standard deviation of about 1.10. This suggests the following. First, it is not uncommon to nd a point estimate of either 0.107 or 0.135, the coecients on the actual rule change, since it is only around one standard deviation above the mean of the placebo coecients. However, it is rare to nd a coecient on the interaction term that is as precisely estimated. The regressions assessing the actual rule change produce t-statistics of 3.664 and 4.455, which when placed in the placebo distribution, yield p-values less than 0.0001.
In summary, the placebo test examines how likely it is that the dierence-in-dierences regressions produce false positive results. While it is not uncommon to produce a point estimate of similar magnitude, it is rare to obtain purely by chance coecient estimates that are as precisely estimated.
5 Leverage and return volatility
In the previous section, I nd that leverage constraints can lead to more protable trading. This nding leads to the following question: do leverage constraints also eect the volatility of their returns? To address this question, I compute the daily standard deviation of per-trade return on investment per per-traderiand employ a similar empirical test as in the previous
sections. The results of estimating the dierence-in-dierences regression are presented in Table8. I nd that there is no change in the volatility of their returns following the legislation. How are investors able to see improved protability, without any change in the volatility of their returns? I nd that traders who are leverage constrained trade more frequently on days when implied volatility is high. I use two measures of implied volatility the cvix and the vxy and show that following the trading rule, U.S. traders are more likely to make trades on days when implied volatility is at its weekly high. Dierence-in-dierence regression results are presented in Table 9.
6 Do leverage constraints help overcondent traders?
6.1 Theory
In this section I discuss a theoretical model that predicts how investor protability is aected by the introduction of leverage constraints into the market for an asset. The model is drawn from Odean (1998) in which a risk-neutral investor is given the option to purchase a risky asset that pays-out after several rounds of trading. During the trading rounds, investors receive both a private and common signal about the value of the asset, and update their beliefs according to Baye's rule. Odean's (1998) model is novel in that it relies on the
assumption that some traders are overcondent which causes them to hold posterior beliefs about the terminal value of the asset that is too precise and underweight common signals. It thus predicts that overcondent traders are less protable.
I modify Odean (1998) to include binding leverage constraints for all traders. Even though the investor weighs their beliefs more heavily than the common signal, they know there is a non-zero probability that other traders interpret the signal in a manner that pushes the price of the asset down far enough to induce a margin call prior to the pay-out (similar to DeLong, et al. (1990)). In such instances, the investor loses all of their investment regardless of the terminal value of the asset and the accuracy of their own beliefs. Owing to the risk of the margin call, the investor is forced to put a larger weight than they would otherwise on the common signal. The model yields the following testable prediction:
Hypothesis: In the presence of leverage constraints, average investor protabil-ity increases. Furthermore, the greater the overcondence of the trader, the greater the increase in protability.
6.2 Empirical test
A common explanation for the under-performance of individual investors relative to the market is that they exhibit overcondence, specically about the precision of their abilities (Odean, 1998). Existing empirical studies proxy for trader overcondence using their gender (Barber and Odean, 2001), tax lings and driving records (Grinblatt and Keloharjua, 2009), and trading frequency. Unfortunately, I am not provided the gender of the trader, and I am unable to link the database to outside sources as in the works of Grinblatt and Keloharjua. Proxies relying on trading activity are inappropriate in this setting since the dierent regimes
by using the number of friends made by each trader in the social network.
As described in Section 3, the traders in the sample are all participants in a social network. They are able to communicate with other traders and form bilateral friendships. The number of friends makes for a good proxy since Burks, S.V. et al. (2010) nd that, [m]ore socially dominant individuals ... make more condent judgments, holding constant their actual ability. They suggest that the relationship between social dominance and condence is caused by a propensity to send public signals when events occur that appear to conrm their own abilities. Furthermore, the CFTC trading rule is unlikely to have had an eect on trader interactions within the social network, which makes this measure a better proxy than any directly related to trader activity.
In order to analyze the impact of lower leverage on the trading activities of overcondent investors, I create a variable, overconf identi, that is equal to one if the trader has more
than the cuto number of friends specied in each regression, and equal to zero otherwise. In the rst regression, the cuto is above the median number of friends (8), above the 75th percentile (19) in the second, and above the 90th percentile (40) in the last. My empirical approach is similar to before, running dierence-in-dierences regressions that assess how the change in margin requirements legislated by the CFTC aected the protability of U.S. traders relative to European traders. Now I include overconf identi as a triple interaction
term with U Si and rulet yielding the following empirical model:
roij,i,t =γ0+γ1∗U Si+γ2∗rulet+γ3∗U Si∗rulet+γ4∗U Si∗overconf identi... +γ5∗rulet∗overconf identi+γ6∗U Si∗rulet∗overconf identi...
A positive value for the coecient on the triple interaction term,γ6, implies that a reduction
in leverage causes a larger increase in the protability of overcondent traders.
My regression results are detailed in Table 10. The trading rule is found to have a larger positive eect on the protability of overcondent traders, increasing the per-trade ROI by between 0.15% and 0.24% relative to the control group. The one concern is that while the coecient on the triple interaction should rise monotonically as I increase the threshold number of friends needed to term the trader overcondent, despite remaining positive and statistically signicant, it falls when going from the 75th to the 90th percentile cuto. This may suggest that those with the most friendships have achieved prominence within the network because of a reputation for good performance rather than their propensity to be boastful. Therefore, since they are less biased, they are less likely to be aected by the trading rule.
For robustness, I use two additional proxies for overcondence that are drawn from graph theory, betweenness and eigenvector centrality. Betweenness centrality attempts to quantify the extend to which communications within a network have to travel through a given individual. Eigenvector centrality seeks to dene how prominent one is by placing a greater weight on those with ties to highly connected individuals. Technical descriptions of both variables are provided in the Appendix. Since both variables are highly correlated with the number of friendships, 95.0 and 92.1 percent respectively, they do not change my ndings.
My results strongly support the conclusion that overcondence drives trader under-performance and that leverage constraints help those who are most overcondent.
7 Conclusion
This research nds that a CFTC trading rule that reduces the leverage available to U.S. traders caused individual investors to trade more protably. While this nding might imply a change in the risk associated with their investment, I nd no change in the realized volatility of their returns. This is due at least in part by risk-shifting; unable to use leverage to generate volatility, U.S. investors trade more frequently on days with high implied volatility.
Since the standard risk-return model of investor behavior fails to hold, I propose an alternative theory to explain my empirical ndings. Unprotable trading is often caused by overcondence, a bias causing individuals to overweight their own beliefs relative to those of others. I rely on this insight to show that if investors are overcondent, leverage constraints can boost their protability. This is caused by the non-zero probability that other traders drive down prices resulting in a margin call, which occurs regardless of the trader's own beliefs or the terminal value of the asset. The investor recognizes this possibility and is forced to fall more in-line with common signals known to all investors. In support of this theory, I nd empirical evidence that the more overcondent traders are most helped by the CFTC trading rule.
Thus, this work is strongly supportive of the CFTC's regulation, one of the many actions taken by policy makers to protect consumer welfare in nancial markets as a result of Dodd-Frank. A strong case can be made that it was likely to have had no eect: if investors use leverage to generate volatility they will nd an alternative means to do so. In fact, I nd evidence that following the legislation, U.S. investors concentrate their trading on days with high implied volatility. Despite risk-shifting, the eect of limiting leverage outweighs the substitution eect and traders become more protable. As such, I recommend that it is appropriate to tie the hands of individual investors when it can possibly attenuate the
deleterious eect of known behavioral biases.
The most important extension to research conducted in this paper is to determine if the trading rule had an eect on currency prices. As mentioned in the introduction, Foucault, et al. (2011) nd that an exogenous change to the share of speculative retail trading on the Paris Bourse substantially reduces idiosyncratic stock price volatility. In order to replicate a study such as theirs, it is necessary to determine the share of U.S. retail foreign exchange trading especially since other market participants may respond endogenously to the decline in U.S. trading activity. Estimates from the Bank of International Settlements nd that retail traders constitute approximately 10% of daily market volume (King and Rime, 2010), but shares may vary intraday. This requires marriage with other data sources to estimate the intraday share of retail trading volume. In the meantime, my intuition is that while intraday volatility will decline as a result of the CFTC trading rule and the reduction in U.S. retail trading, the nding that leverage constrained investors substitute towards days with high implied volatility implies the possibility that they may crowd-in during turbulent times and exacerbate large price movements.
Appendix
Network theory glossary
• graph: a set of vertices and edges. • vertex: a node or point.
• edge: a line connecting two vertices.
• path: the route taken to travel between two vertices. The two vertices may be directly
connected by two edges, may require travel through at least one vertices, or there may be no path connecting two vertices.
• directed/undirected graph: in a directed graph, travel between two vertices may
only be possible in one direction, i.e. vertex i to j, but not j to i. In an undirected
graph, travel is possible in both directions for all edges.
• adjacency matrix: A = (av,t). av,t = 1 if vertex v shares an edge with t, zero
otherwise.
Network centrality measures
• Betweenness Centrality: CB(v) = X s6=v6=t∈V σst(v) σst ! × 1 (n−1)(n−2)/2measures the centrality of node v in an undirected graph. σst is the total number of
pass through v. n is the number of vertices in the graph and the second term on the
right hand side of the expression normalizes the measure such thatCB(v)∈[0,1].
• Eigenvector Centrality: Cx(v) = 1 λ X t∈G av,txt
measures the centrality of node v in undirected graph G. A = (av,t) is the adjacency
matrix and xt is the centrality score of the neighbors ofv. λ is a constant drawn from
References
[1] Brad M. Barber, Yi-Tsung Lee, Yu-Jane Liu, and Terrance Odean, Just how much do individual investors lose by trading?, Review of Financial Studies 22 (2009), no. 2, 609632.
[2] Brad M. Barber and Terrance Odean, Boys will be boys: Gender, overcondence, and common stock investment, The Quarterly Journal of Economics 116 (2001), no. 1, 261 292.
[3] Antonio E. Bernardo and Ivo Welch, On the evolution of overcondence and en-trepreneurs, Journal of Economics & Management Strategy 10 (2001), no. 3, 301330. [4] Yosef Bonaparte and Frank J. Fabozzi, Household search choice: Theory and evidence,
Applied Economics, Forthcoming (2009).
[5] Stephen V. Burks, Jerey P. Carpenter, Lorenz Goette, and Aldo Rustichini, Overcon-dence is a social signaling bias, Institute for the Study of Labor Discussion Paper (2010), no. 4840.
[6] Daniele Coen-Pirani, Margin requirements and equilibrium asset prices, Journal of Mon-etary Economics 52 (2005), no. 2, 449475.
[7] Kent Daniel, David Hirshleifer, and Avanidhar Subrahmanyam, Investor psychology and security market under- and overreactions, Journal of Finance 53 (1998), no. 6, 1839 1885.
[8] Bradford J. Delong, Andrei Shleifer, Lawrence H. Summers, and Robert J. Waldmann, Noise trader risk in nancial markets, Journal of Political Economy 98 (1990), no. 4, 70338.
[9] Thierry Foucault, David Sraer, and David J. Thesmar, Individual investors and volatil-ity, The Journal of Finance 66 (2011), no. 4, 13691406.
[10] J.K. Galbraith, A short history of nancial euphoria, Whittle Series, Whittle Books in association with Viking, 1993.
[11] John Geanakoplos, The leverage cycle, NBER Macroeconomics Annual 24 (2010), no. 1, 166.
[12] Mark Grinblatt and Matti Keloharju, Sensation seeking, overcondence, and trading activity, Journal of Finance 64 (2009), no. 2, 549578.
[13] Rawley Z. Heimer and David Simon, Facebook nance: How social interaction propagates active investing, Working Paper (2012).
[14] Michael R King and Dagnn Rime, The $4 trillion question: what explains fx growth since the 2007 survey?, BIS Quarterly Review (2010).
[15] Alok Kumar, Who gambles in the stock market?, Journal of Finance 64 (2009), no. 4, 18891933.
[16] Paul H. Kupiec, Initial margin requirements and stock returns volatility: Another look, Journal of Financial Services Research 3 (1989), 287301.
[18] Juhani T. Linnainmaa, The anatomy of day traders, mimeo (2003).
[19] Thomas Gale Moore, Stock market margin requirements, Journal of Political Economy 74 (1966), no. 2, pp. 158167.
[20] Terrance Odean, Volume, volatility, price, and prot when all traders are above average, The Journal of Finance 53 (1998), no. 6.
[21] Jose A. Scheinkman and Wei Xiong, Overcondence and speculative bubbles, Journal of Political Economy 111 (2003), no. 6, 11831219.
[22] G. William Schwert, Margin requirements and stock volatility, Journal of Financial Ser-vices Research 3 (1989), 153164.
[23] Yajun Wang, Why can margin requirements increase volatility and benet margin con-strained investors?, SSRN eLibrary (2012).
Figure 1: myForexBook user homepage
Description: This gure displays the user homepage for a member of myForexBook. Users are able to form bi-lateral friendships with other traders and communicate via private mes-sage or in the chat forum.
Figure 2: When do retail investors trade? 0 1000 2000 3000 4000
Sep1 Oct1 Nov1 Dec1
number of trades
US trades EUR trades
Description: In this gure I plot the total number of opened positions per day by U.S. and European investors in the trimmed sample described in Section 3. The valleys in the time series correspond to weekends while the majority of trading occurs during the work-week. The black vertical bar indicates the date that the CFTC trading rule was implemented, October 18, 2010.
Figure 3: Aggregate leverage use 5 10 15 20 25
Sep1 Oct1 Nov1 Dec1
Average Leverage (##:1)
US EUR
US 10−day mov. ave EUR 10−day mov. ave
Description: In this gure I plot the average amount of leverage used per trade per day by U.S. and European traders in the trimmed sample described in Section 3 and a ten-day moving average of each time series. Weekends are excluded from the graph as well as the calculation of the moving average. The black vertical bar indicates the date that the CFTC trading rule was implemented, October 18, 2010.
Figure 4: Aggregate return on investment 99.4 99.6 99.8 100 100.2
Sep1 Oct1 Nov1 Dec1
average ROI
US EUR
US 10−day mov. ave EUR 10−day mov. ave
Description: In this gure, I plot the average return on investment per trade per day by U.S. and European traders in the trimmed sample described in Section 3 and a ten-day moving average of each time series. Weekends are excluded from the graph as well as the calculation of the moving average. The black vertical bar indicates the date that the CFTC trading rule was implemented, October 18, 2010.
Figure 5: Distribution of ROI before and after legislation 0 .2 .4 .6 .8 1 Cumulative Probability 70 80 90 100 110 120 roi pre−Rule post−Rule US traders CDF of ROI 0 .2 .4 .6 .8 1 Cumulative Probability 70 80 90 100 110 120 roi pre−Rule post−Rule EUR traders CDF of ROI
Description: In this gure, I plot the cumulative density function for the return on invest-ment for all trades in the sample. For illustrative purposes, I remove the inner 90% of the distribution conditional on the trade being placed by the U.S. or European sub-group.
Figure 6: Kernel density estimates from placebo test on US×Rule .5 1 1.5 2 2.5 3 −.4 −.2 0 .2 .4 Coefficients on USxRule
binary relation w/ controls
0 .1 .2 .3 .4 −3 −2 −1 0 1 2 t−stats
binary relation w/ controls
Kernel Density Estimates
Description: In this gure, I plot kernel density estimates using the Epanechnikov kernel function of the coecients and t-statistics from a placebo test for the main dierence-in-diernences regression to assess the impact of the CFTC rule change on per-trade return on investment. To conduct the placebo test, I run the following regressions:
binary relation: roij,i,t =γ0+γ1∗U Si+γ2∗rulei,t+γ3∗U Si∗rulet+j,i,t
w/controls: roij,i,t =γ0+γ1∗U Si+γ2∗rulei,t+γ3∗U Si∗rulet+...
...+γ4∗Xj,i,t+γ5∗Xi+j,i,t
collecting the coecient,γ3, and the corresponding t-statistic after 70 total iterations. I
change the date of the placebo rule change each iteration, starting from Sunday May 3, 2009 rolling forward a week at a time until Aug 29, 2010. I allow the range of the sample to encompass six weeks before and after the placebo rule change. Prior to running each iteration I impose the data trimming exercise discussed in Section 3. As a reminder, the results from estimating the eect of the actual rule change are as follows. In the binary relation, γ3 = 0.107 with t−stat = 3.664 and when control variables are included, γ3 = 0.135 with
Table 1: The CFTC trading rule and margin requirements
This table lists the currency pairs eected by the CFTC trading rule reducing the amount of leverage from 100:1 to either 50:1 or 20:1.
50:1 leverage
USD/JPY AUD/NZD NZD/CAD EUR/GBP GBP/USD USD/CHF USD/SEK CHF/JPY EUR/JPY GBP/JPY AUD/USD USD/DKK CAD/JPY EUR/AUD GBP/CHF USD/CAD USD/NOK CAD/CHF EUR/CAD GBP/CAD NZD/USD AUD/CHF CHF/SEK EUR/SEK GBP/NZD AUD/CAD NOK/JPY CHF/NOK EUR/NOK GBP/AUD AUD/JPY SEK/JPY EUR/USD EUR/NZD GBP/SEK NZD/JPY NZD/CHF EUR/CHF EUR/DKK
20:1 leverage
USD/MXN USD/CZK USD/HKD USD/RUB ZAR/JPY EUR/PLN USD/ZAR SGD/JPY EUR/HUF
USD/PLN USD/SGB USD/TRY USD/HUF EUR/CZK HKD/JPY EUR/TRY TRY/JPY
Table 2: Summary statistics U.S. Trades
count mean std. dev. 5% 25% 50% 75% 95% before trading rule
ROI (%) 71,101 99.67 3.83 94.15 99.90 100.00 100.17 103.35 leverage 71,704 12.35 31.78 0.00 0.18 1.80 10.25 53.76 size 71,704 10,706.0 52,184.6 40.0 100.0 1,000.0 10,000.0 50,000.0 after trading rule
ROI (%) 47,595 99.81 3.55 95.09 99.82 100.00 100.32 103.51 leverage 47,960 10.17 22.31 0.00 0.30 2.30 12.22 37.14 size 47,960 12,228.2 123,032.7 40.0 120.0 1,000.0 10,000.00 50,000.0 Total ROI (%) 118,696 99.72 3.72 94.54 99.87 100.00 100.23 103.42 leverage 119,664 11.48 28.39 0.00 0.22 2.00 11.15 45.77 size 119,664 11,316.1 87,744.1 40.0 120.0 1,000.0 10,000.0 50,000.0 N 119,664 European Trades
count mean std. dev. 5% 25% 50% 75% 95% before trading rule
ROI (%) 83,935 99.80 3.60 95.03 99.87 100.03 100.30 103.41 leverage 84,948 14.73 30.97 0.03 0.81 3.87 13.29 65.92 size 84,948 15,390.4 113,404.0 100.0 1000.0 2,000.0 10,000.0 60,000.0 after trading rule
ROI (%) 60,758 99.83 3.89 94.47 99.82 100.05 100.45 104.04 leverage 61,636 19.32 39.24 0.11 0.98 5.04 18.85 92.09 size 61,636 29,436.6 238,701.0 100.0 1000.0 3,000.0 10,000.0 100,000.0 Total ROI (%) 144,693 99.81 3.72 94.78 99.85 100.04 100.36 103.67 leverage 146,584 16.66 34.76 0.06 0.89 4.28 15.66 76.94 size 146,584 21,296.6 177,366.9 100.0 1000.0 2,000.0 10,000.0 86,000.0 N 146,584
Table 3: Correlation between ROI and margins
This table reports the estimates of the following regression using OLS:
roij,i,t=β0+β1∗leveragej,i,t+β2∗Xj,i,t+β3∗Xi+εj,i,t
where roij,i,t is the return on investment for trade j, issued by trader i, at time t. leveragej,i,t is
the amount of leverage used in each trade, while Xj,i,t is a matrix of features that belong to each
trade issued and Xi is a matrix of trader characteristics. Controls include: the holding period on
the trade, the size of the trade interacted with the currency pair (as well as main eects for both), trader experience, the trader's trading style, and brokerage. Units are in percentages. Standard errors are clustered by trader.
roij,i,t
(1) (2) (3) (4)
all trades pre-rule post-rule
leveragej,i,t -0.0160∗∗∗ -0.0161∗∗∗ -0.0184∗∗∗ -0.0145∗∗∗
(0.000557) (0.000594) (0.000898) (0.000808)
trade size No Yes Yes Yes
pair FE No Yes Yes Yes
trade size*pair FE No Yes Yes Yes
holding period No Yes Yes Yes
direction No Yes Yes Yes
experience FE No Yes Yes Yes
approach FE No Yes Yes Yes
constant 100.0∗∗∗ 101.0∗∗∗ 99.58∗∗∗ 101.7∗∗∗
(0.00687) (0.317) (0.584) (0.376)
N 266,248 266,248 137,667 128,581
R2 0.019 0.025 0.035 0.021
Robust standard errors in parentheses
Table 4: Was the CFTC trading rule binding?
This table reports the estimates of the following regression using OLS:
Yj,i,t =γ0+γ1∗U Si+γ2∗rulet+γ3∗U Si∗rulet+γ4∗Xj,i,t+γ5∗Xi+j,i,t
where the dependent variable Yj,i,t is for trade j, issued by trader i, at time t. In regression (i),
the dependent variable is the leverage (in units ##:1, 20:1 for example) used per-trade and in (ii), it is the size of the trade denominated in the base currency. In (iii), the number of trades are aggregated up to the daily level and the regression is run conditional on having made at least one trade. U Si is equal to one if the trader is located in the U.S. and equal to zero if located in Europe,
and rulet is equal to one if the trade was opened after the CFTC rule on margin requirements
went into eect on October 18, 2010. Standard errors are clustered by trader.
(i) (ii) (iii)
dependent variable leveragej,i,t trade sizej,i,t trades dayi,t
U Si*rulet -6.490∗∗∗ -12561.8∗∗∗ -1.346∗∗ (2.198) (1266.3) (0.589) U Si 0.701 -626.3 0.378 (2.235) (550.1) (0.500) rulet 3.308∗ 14270.4∗∗∗ -0.557∗ (1.755) (1079.1) (0.299)
holding_period Yes Yes No
trade size Yes No No
pair FE Yes Yes No
trade size*pair FE Yes No No
experience FE Yes Yes Yes
direction FE Yes Yes No
approach FE Yes Yes Yes
broker FE Yes Yes Yes
constant 71.75∗∗∗ 3395.4∗ 5.455∗∗∗
(23.39) (1775.2) (1.729)
N 266,248 266,248 32,585
R2 0.160 0.028 0.030
Standard errors in parentheses
Table 5: The impact of the CFTC trading rule on average daily ROI
This table reports the estimation of the following regression using OLS:
U S minus EU R ROIt=γ0+γ1∗rulet+t
whereU S minus EU R ROIt= ¯roiU S,t−roi¯ EU R,t, the average daily return on investment in the U.S.
minus that in Europe, andrulet is equal to one if the day is equal to or after October 18, 2010, the
day the CFTC rule constraining leverage use went into eect. The date range is September 1, 2010 to November 29, 2010, excluding weekends. The moving averages use data from prior to September 1st.
U S minus EU R ROIt 5-day MA 10-day MA rulet 0.120∗∗∗ 0.129∗∗∗ (0.0321) (0.0176) constant -0.165∗∗∗ -0.169∗∗∗ (0.0155) (0.00851) N 43 43 R2 0.254 0.567
Standard errors in parentheses
Table 6: The impact of the CFTC trading rule on ROI per trade
This table reports the estimates of the following regression using OLS:
roij,i,t =γ0+γ1∗U Si+γ2∗rulei,t+γ3∗U Si∗rulet+γ4∗Xj,i,t+γ5∗Xi+j,i,t
whereroij,i,t is the return on investment for trade j, issued by traderi, at time t. U Si is equal to
one if the trader is located in the U.S. and equal to zero if located in Europe, and rulet is equal
to one if the trade was opened after the CFTC rule on margin requirements went into eect on October 18, 2010. Units are in percentages. Standard errors are clustered by trader.
roij,i,t (1) (2) U Si* rulet 0.107∗∗∗ 0.135∗∗∗ (0.0292) (0.0303) U Si -0.134∗∗∗ -0.171∗∗∗ (0.0188) (0.0211) rulet 0.0307 0.0481∗∗ (0.0198) (0.0201)
trade size No Yes
pair FE No Yes
trade size*pair FE No Yes holding period No Yes direction FE No Yes experience FE No Yes trading approach FE No Yes
constant 99.80∗∗∗ 99.81∗∗∗
(0.0123) (0.318)
N 266,248 266,248
R2 0.000 0.008
Robust standard errors in parentheses
Table 7: The impact of the CFTC trading rule on the likelihood of winning trades
This table reports the estimates of the following logistic regression:
P r(winning tradej,i,t) =γ0+γ1∗U Si+γ2∗rulet+γ3∗U Si∗rulet+γ4∗Xj,i,t+γ5∗Xi+j,i,t
wherewinning tradej,i,t is equal to one if tradej, issued by investor i, at time tearns a positive
ROI, zero otherwise (excluding all trades that earn zero ROI). U Si is equal to one if the trader is
located in the U.S. and equal to zero if located in Europe, and rulet is equal to one if the trade
was opened after the CFTC rule on margin requirements went into eect on October 18, 2010. Standard errors are clustered by trader.
P r(winning tradej,i,t)
(1) (2) U Si* rulet 1.061∗∗∗ 1.104∗∗∗ (0.0176) (0.0193) U Si 0.975∗∗ 0.839∗∗∗ (0.0104) (0.00978) rulet 0.931∗∗∗ 0.954∗∗∗ (0.0103) (0.0111)
trade size No Yes
pair FE No Yes
trade size*pair FE No Yes holding period No Yes direction FE No Yes experience FE No Yes trading approach FE No Yes
constant Yes Yes
N 266,248 266,202
pseudoR2 0.000 0.042
Odds-ratios; Robust standard errors in parentheses
Table 8: The impact of the CFTC trading rule on the volatility of returns
This table reports the estimates of the following regression using OLS:
σi,tROI =γ0+γ1∗U Si+γ2∗rulei,t+γ3∗U Si∗rulet+γ4∗Xi+i,t
whereσi,tROI is the standard deviation of per trade return on investment within day t, for trader i. U Si is equal to one if the trader is located in the U.S. and equal to zero if located in Europe, and
rulet is equal to one if the trade was opened after the CFTC rule on margin requirements went
into eect on October 18, 2010. Units are in percentages. Standard errors are clustered by trader. σi,tROI
all days t with > 5 trades U Si*rulet 0.168 1.117 (2.686) (5.836) U Si -0.0119 0.0341 (0.139) (0.385) rulet 1.749 3.402 (1.728) (3.435) experience FE Yes Yes trading approach FE Yes Yes
constant Yes Yes
N 22,685 10,819
R2 0.001 0.002
Robust standard errors in parentheses
Table 9: Do leverage constrained investors trade more often when volatility is high?
This table reports the estimates of the following logistic regression:
P r(Yj,i,t) =γ0+γ1∗U Si+γ2∗rulet+γ3∗U Si∗rulet+γ4∗Xj,i,t+γ5∗Xi+j,i,t
where Yj,i,t is equal to one if tradej, issued by investor i, at time t is issued on the day in which
implied volatility (either the vxy or the cvix) is at its weekly high, zero otherwise. U Si is equal to
one if the trader is located in the U.S. and equal to zero if located in Europe, and rulet is equal
to one if the trade was opened after the CFTC rule on margin requirements went into eect on October 18, 2010. Standard errors are clustered by trader.
P r(vxyt) P r(cvixt) U Si* rulet 1.106*** 1.039* (0.0227) (0.0216) U Si 0.928*** 1.022 (0.0123) (0.0138) rulet 0.741*** 0.832*** (0.0100) (0.0115)
trade size Yes Yes
pair FE Yes Yes
trade size*pair FE Yes Yes holding period Yes Yes direction FE Yes Yes experience FE Yes Yes trading approach FE Yes Yes
constant Yes Yes
N 260,812 260,809
pseudo R2 0.006 0.011
Odds-Ratios; Robust standard errors in parentheses
Table 10: Are overcondent traders helped more by leverage constraints?
This table reports estimates of the following regression using OLS:
roij,i,t =γ0+γ1∗U Si+γ2∗rulet+γ3∗U Si∗rulet+γ4∗U Si∗overconf identi... +γ5∗rulet∗overconf identi+γ6∗U Si∗rulet∗overconf identi...
+γ7∗Xj,i,t+γ8∗Xi+j,i,t
whereoverconf identi is equal to one if the number of friends made by traderiexceed the following
thresholds: above the 50th, 75th, or 90th percentile. U Si is equal to one if the trader is located in
the U.S. and equal to zero if located in Europe, and rulet is equal to one if the trade was opened
after the CFTC rule on margin requirements went into eect on October 18, 2010. Standard errors are clustered by trader.
roij,i,t
(1) (2) (3)
overconf identi =f riendsi >50%ile >75%ile >90%ile
U Si*rulet*overconf identi 0.237∗∗∗ 0.242∗∗∗ 0.152∗∗
(0.0635) (0.0629) (0.0647) U Si -0.160∗∗∗ -0.0966∗∗∗ -0.157∗∗∗ (0.0342) (0.0297) (0.0270) rulet 0.0527 0.0209 0.0509∗ (0.0397) (0.0316) (0.0261) U Si*rulet -0.00761 0.0387 0.0889∗∗ (0.0493) (0.0426) (0.0382) overconf identi -0.0417 0.0236 0.00659 (0.0288) (0.0279) (0.0292) U Si*overconf identi -0.0278 -0.170∗∗∗ -0.0437 (0.0459) (0.0475) (0.0492)
rulet*overconf identi -0.0102 0.0398 -0.0196
(0.0462) (0.0418) (0.0420)
trade size Yes Yes Yes
pair FE Yes Yes Yes
trade size*pair FE Yes Yes Yes
holding period Yes Yes Yes
direction FE Yes Yes Yes
experience FE Yes Yes Yes
approach FE Yes Yes Yes
constant 99.79∗∗∗ 99.77∗∗∗ 99.78∗∗∗
(0.320) (0.321) (0.321)
N 263,389 263,389 263,389