Manufacturing Climate Solutions
Carbon-Reducing Technologies and U.S. Jobs
C
HAPTER11
Wind Power:
Generating Electricity and Employment
Gloria Ayee, Marcy Lowe and Gary Gereffi
Contributing CGGC researchers:
2 This research is an extension of the Manufacturing Climate Solutions report published in
November 2008. It was prepared on behalf of the Environmental Defense Fund (EDF)
(http://www.edf.org/home.cfm).
Cover Photo Credits:
1. Courtesy of DOE/NREL, Credit – Iberdrola Renewables, Inc. (formerly PPM Energy, Inc.) 2. Courtesy of DOE/NREL, Credit – Iberdrola Renewables, Inc. (formerly PPM Energy, Inc.) 3. Courtesy of DOE/NREL, Credit – Reseburg, Amanda; Type A Images
© September 22, 2009.
Center on Globalization, Governance & Competitiveness, Duke University
The complete report is available electronically from:
http://www.cggc.duke.edu/environment/climatesolutions/
3 Summary
Wind power is a cost effective, renewable energy solution for electricity generation. Wind power can dramatically reduce the environmental impacts associated with power generated from fossil fuels (coal, oil and natural gas). Electricity production is one of the largest sources of carbon dioxide (CO2) emissions in the United States. Thus, adoption of wind power generating
technologies has become a major way for the United States to diversify its energy portfolio and reach its expressed goal of 80% reduction in green house gas (GHG) emissions by the year 2050. The benefits of wind power plants include no fuel risk, no carbon dioxide emissions or air
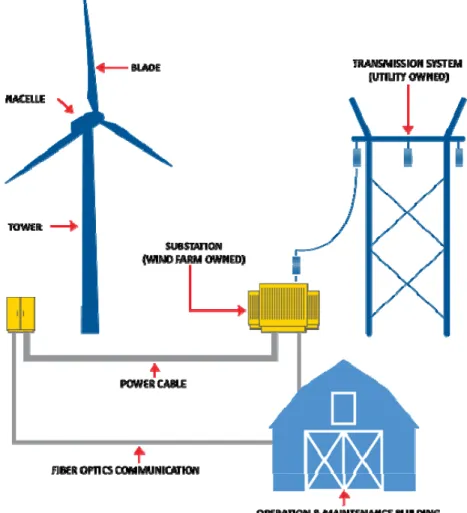
pollution, no hazardous waste production, and no need for mining, drilling or transportation of fuel (American Wind Energy Association, 2009a). The structure of a wind farm is illustrated in Figure 1.
Figure 1. Wind Farm Infrastructure
Source: (Wind Capital Group, 2009)
Global wind capacity has grown significantly over the past decade. Today more than 70
countries around the world are producing electricity from wind energy. However, wind power is still a heavily concentrated market, with Europe and the United States accounting for about 80% of global installed capacity. Wind turbine and component manufacturing has been dominated by
4 European companies since the technology is mature in Europe, but competition has increased as the wind industry has expanded globally. In 2008 the United States became the world leader in total wind power installed capacity, and the country is developing a niche in wind turbine manufacturing. Several leading original equipment manufacturers—or OEMs, the main finished wind turbine firms—have established, or plan to open, manufacturing facilities in the United States, and U.S.-based companies are also expanding their facilities to meet increasing demand. The U.S. wind power market has grown rapidly in recent years as technology improvements have helped reduce cost. The growth of the wind power industry in the United States is attributable to improvements in wind technology, increasingly supportive policies, and the
growing interest in renewable energy resources (U.S. DOE, 2008). This growth has led to a surge in wind turbine component manufacturing around the country and the creation of thousands of jobs in many related sectors.
Investment in wind power offers substantial benefits for the domestic manufacturing sector. In only four years, the share of parts manufactured domestically has grown from 30% to 50%. Continued government support of renewable energy programs could enable the United States to establish further domestic manufacturing capacity and gain a competitive edge in the global wind turbine manufacturing industry. There are over 8,000 precision parts in a single wind turbine, many already manufactured by U.S. companies. In addition to creating new jobs, the wind industry is positioned to help revive manufacturing jobs that have been lost in other sectors, including the motor vehicle industry; for instance, auto supplier firms are capable of transitioning to wind component manufacturing, primarily for small-scale wind projects.
This report focuses on the companies that manufacture Tier 1 and Tier 2 parts for the utility-scale or large wind power industry. Examples of other components in a wind turbine that are not highlighted in this report include lubricants, wiring, fiberglass housing, concrete & steel foundations, seals, power transmission equipment, printed circuits, motors and generators, and measuring devices. The report presents a value chain analysis of the wind power industry and illustrates the job potential in manufacturing, construction, transportation, and operations and maintenance services.
Introduction
Wind energy is a clean, low cost energy resource that offers the security of a renewable energy supply. Harnessed wind energy can be used to generate electricity that can power millions of homes and businesses. The wind power industry has the potential to become the cornerstone for global reliance on renewable energy. Many countries have begun to invest in the development of wind power as energy prices and environmental concerns underscore the need for economically viable and environmentally sustainable energy sources.
In May 2009, the U.S. Department of Energy (DOE) Energy Information Administration (EIA) announced an expected increase of world energy consumption by 44% over the next two decades. If attempts are not made to find suitable alternatives to energy production from fossil fuels, this could result in a 40% increase in atmospheric carbon dioxide emissions worldwide by 2030 (Energy Information Administration, 2009). In the United States alone, annual electricity consumption is estimated to grow at a rate of 1.3% annually, meaning that consumption could
5 reach 5.4 billion megawatt hours (MWh) by 2030 (U.S. DOE, 2008). To meet 20% of that
demand, U.S. wind power capacity would have to reach more than 300,000 MW, a significant increase from the 28,000 MW currently being produced (U.S. DOE, 2008).
Power generation from fossil fuels is the largest source of carbon dioxide emissions in the United States, and it accounts for 39% of total CO2 emissions in 2007 (U.S. Environmental Protection
Agency, 2009). The main sources of power generation currently being used in the United States are coal (49%), natural gas (22%), nuclear (20%), hydropower (6%), and petroleum/petroleum coke (1%) (American Wind Energy Association, 2009f). Although wind turbine technology has enabled wind energy to become a viable source for power generation, wind currently provides only about 1% of total U.S. electricity generation (U.S. DOE, 2008).
The International Energy Agency (IEA) has projected that global electricity demand will double by 2030, growing at 2.6% per year (World Energy Council, 2009). Energy prices, supply
uncertainties and environmental concerns have compelled the United States to work towards greater energy efficiency. In 2007, a collaborative effort to explore a modeled energy scenario in which wind provides 20% of U.S. electricity by 2030 was established as part of government efforts to diversify the domestic energy portfolio. Members of this 20% Wind Collaborative include the U.S. Department of Energy (DOE), national laboratories, engineering and consulting firm Black &Veatch, and the American Wind Energy Association (AWEA) (U.S. DOE, 2008). Wind energy is the fastest growing source of electricity generation in terms of annual installed capacity. Global wind capacity has grown at an average rate of 30% per year over the past decade. In 2003, the global wind energy industry installed 8,344 megawatts (MW) of new capacity, an investment of $9 billion. That year, the cumulative worldwide installed capacity reached 40 GW and provided about 0.5% of the world’s electricity demand (Wittholz & Pan, 2004). In 2008, more than 27 gigawatts (GW) of new capacity was installed worldwide, bringing the total global installed capacity to over 120 GW (Global Wind Energy Council, 2008b). The United States currently generates 29,440 MW of electricity from wind. This is enough to power approximately 8 million American homes (American Wind Energy Association, 2009b).
Greater adoption of wind power also presents enormous potential for new business opportunities in materials innovation and manufacturing (Ancona & McVeigh, 2009). Many wind turbine components involve labor-intensive manufacturing processes. There are over 8,000 precision parts in a single wind turbine, ranging from the steel tower and high-tech composites for blades, to gearboxes, bearings, electrical wiring, and power electronics. As the supply chain for the wind industry is formed to meet increasing demand, new opportunities are being created for suppliers and manufacturers to become involved (Schoof, 2009). Although the majority of wind turbines currently installed in the United States are imported from Europe and Asia, the percentage of wind turbine parts being manufactured domestically grew from less than 30% in 2005 to 50% in 2008, by value.1 At least 55 wind turbine and wind turbine component manufacturing facilities were added or expanded in 2008, which led to the direct creation of 13,000 new jobs (American
1
This percentage is based on the “value” of components. Primarily this refers to towers and blades, which account for half of the value of the wind turbine. Most towers and blades for U.S. wind installations are produced
6 Wind Energy Association, 2009d). The following sections will highlight the growth and potential for future development of the U.S. wind industry.
Wind Turbine Technology
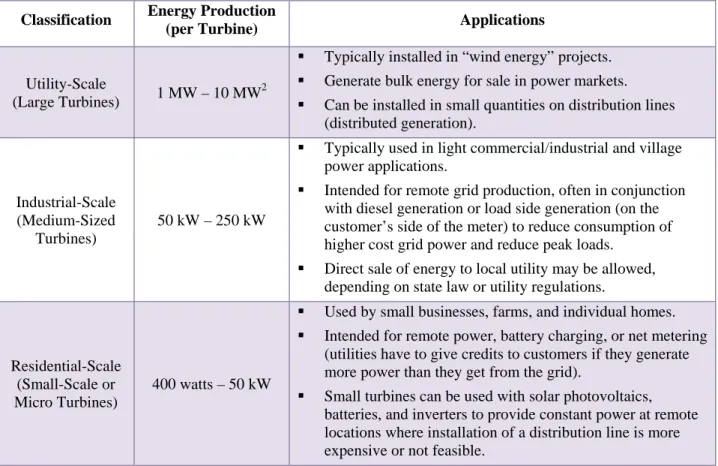
A wind turbine is a rotating machine that converts the wind’s kinetic energy to mechanical energy. This mechanical energy is then converted into electricity by a generator, without the emission of pollutants or green house gases. For centuries windmills have been used to harness wind energy, generally to power a piece of machinery such as a grinder for grain, and wind turbines are the modern equivalent. Turbines have three classifications, based on size and production capacity: utility-scale, industrial/commercial-scale and residential-scale.
Utility and industrial/commercial-scale turbines are used to provide bulk power to an electric grid for use at an offsite location. Single small turbines are for standalone applications – residential use, water pumping, or telecommunications purposes. Small turbines can be used as “hybrid systems,” in connection with batteries, diesel generators, or photovoltaic (solar cell) systems. This allows them to provide constant power to remote, off-grid locations, when
connection to a utility grid is too expensive or not feasible. Table 1 shows the three types of wind turbines, along with the energy they each produce and the situations in which they are applied.
Table 1. Wind Turbine Classifications (Based on Production Capacity)
Classification Energy Production
(per Turbine) Applications
Utility-Scale
(Large Turbines) 1 MW – 10 MW
2
Typically installed in “wind energy” projects.
Generate bulk energy for sale in power markets.
Can be installed in small quantities on distribution lines (distributed generation).
Industrial-Scale (Medium-Sized
Turbines)
50 kW – 250 kW
Typically used in light commercial/industrial and village power applications.
Intended for remote grid production, often in conjunction with diesel generation or load side generation (on the customer’s side of the meter) to reduce consumption of higher cost grid power and reduce peak loads.
Direct sale of energy to local utility may be allowed, depending on state law or utility regulations.
Residential-Scale (Small-Scale or Micro Turbines)
400 watts – 50 kW
Used by small businesses, farms, and individual homes.
Intended for remote power, battery charging, or net metering (utilities have to give credits to customers if they generate more power than they get from the grid).
Small turbines can be used with solar photovoltaics, batteries, and inverters to provide constant power at remote locations where installation of a distribution line is more expensive or not feasible.
Source: CGGC, based on (Global Energy Concepts, 2005)
2
Several U.S.-based OEMs produce 2.5 MW - 3 MW wind turbines, and 5 MW - 10 MW machines are currently in development (Radomski, 2009).
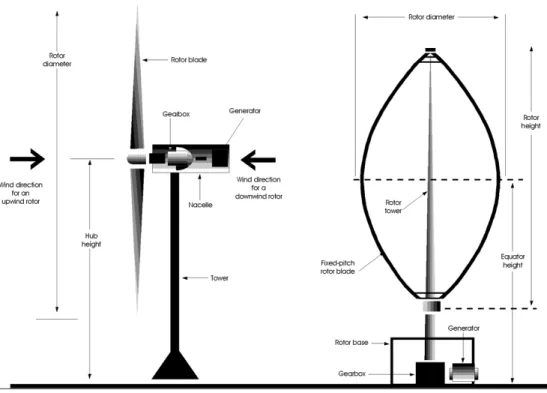
7 Wind turbines typically have between one and three blades and are configured as horizontal axis or vertical axis turbines. These two main wind turbine configurations are shown in Figure 2. Horizontal axis machines can generate wind energy in low wind speeds. Vertical axis wind turbines are most suitable for use in urban locations not affected by significant, rapid changes in wind direction. Most modern wind turbines are horizontal axis machines with two or three blades, usually operating upwind. In the upwind design, the rotor faces the wind with the turbine blades in front of the nacelle, and in the downwind machine the rotor is located on the side of the tower that is sheltered from the wind, and the blades are located at the rear of the nacelle. In upwind machines the rotor needs to be constructed of inflexible materials and located further from the tower to avoid the “wind shade,” an effect created when the wind decreases speed and bends away from an obstacle (the turbine tower) before reaching it. Upwind machines also need a yaw mechanism to keep the rotor facing the wind. Downwind machines can be built without a yaw mechanism, but the tradeoff is that each time the rotor passes the tower, energy will drop, creating fluctuations in power (Danish Wind Industry Association, 2003). Horizontal wind turbines operating upwind, predominantly used in the industry, are the main focus of this report.
Figure 2. Wind Turbine Configurations
Source: (U.S. Department of Energy Office of Solar Technologies, 1985)
In the United States, all commercially available, utility scale wind turbines utilize the “Danish concept” wind turbine configuration, which uses a horizontal axis, three-bladed rotor, an upwind orientation, and an active yaw system to keep the rotor oriented into the wind (Global Energy Concepts, 2005). However, a few OEMs, including Nordic, have plans to open facilities that
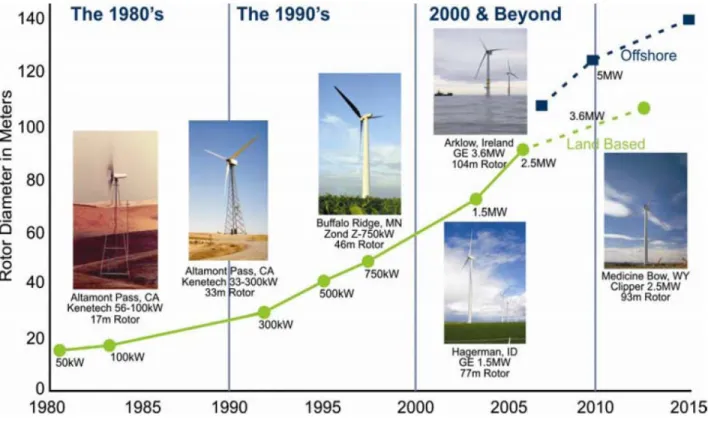
8 manufacture two-bladed wind turbine models. Wind turbines are mounted on a tower, usually about 100 or more feet above the ground, enabling them to take advantage of faster, less turbulent wind (National Renewable Energy Laboratory, 2008). Wind turbine sizes have increased because research has shown that larger size results in greater capacity. Since 1980, wind turbines have grown from 100 kW machines with a 17-meter rotor diameter to multi-megawatt machines with rotor diameters of over 100-meters. By 2005, turbines with capacities as large as 5 MW were being tested (American Wind Energy Association, 2009f). Most wind turbines begin to produce power at speeds of approximately 9 miles per hour (mph), achieve rated power3 at approximately 29 mph, and stop power production at 56 mph4 (Global Energy Concepts, 2005). Figure 3 illustrates the development path and growth of utility/commercial scale wind turbine technology.
Figure 3. The Development Path and Growth of Wind Turbines
Source: (U.S. DOE, 2008)
A single 750 kilowatt (kW) wind turbine produces approximately 2 million kilowatt hours (kWh) of electricity every year. An average U.S. household annually uses about 10,655 kWh of
electricity. One megawatt of wind energy can generate between 2.4 million kWh and over 3 million kWh annually. Therefore, a megawatt of wind generates about as much electricity as 225
3
Rated power is the maximum constant power that the turbine can achieve at a constant speed.
4
At very high speeds, the rotation of the wind turbine blades is halted with the help of brakes. This ensures that strong winds do not rip off the turbine blades.
9 to 300 households use (American Wind Energy Association, 2009f). The number of “homes served” is simply a way to quantify electricity production in familiar terms that are easy for people to understand. It is important to note that the wind does not blow constantly, and thus cannot be the only source of power for that many homes without a storage system.
Offshore Wind
Offshore wind energy installations could help the United States meet its alternative energy needs. Wind tends to be stronger and less turbulent offshore, making such areas good locations for wind farm installations. These offshore locations also can accommodate larger wind turbines with greater energy production capacities. Many offshore wind farms have been proposed and developed in Europe, where land space is limited. In the United States, more than 2,000 MW of offshore wind projects have been proposed, but the country has yet to install its first offshore wind farm (Hurst, 2009). Although offshore wind farms offer numerous benefits, opposition to their development has been strong because of concerns about the impacts on migratory birds and marine species, commercial fishing, tourism, and property values. NIMBY (not in my backyard) opposition and concern about the aesthetics of wind turbines has also affected support of
offshore wind farm development (Firestone et al., 2008). These concerns need to be considered and addressed as offshore wind development proceeds in the United States.
The U.S. Department of Interior’s Minerals Management Service (MMS) and the Federal Energy Regulatory Commission (FERC) are the main agencies involved in approving renewable energy projects on the Outer Continental Shelf (OCS). MMS has exclusive jurisdiction over all such projects. In April 2009, the Department of Interior finalized a long-awaited framework for energy production on the OCS (Minerals Management Service, 2009). This framework established a program that grants leases, easements, and rights-of-way for renewable energy development activities, such as offshore wind farm installations, to be located on the OCS. In May 2009 a proposal to build the Cape Wind project off the coast of Massachusetts won permit requirements, and developers plan to begin construction in early 2009 (McNicholas, 2009). In June 2009, Deepwater Wind LLC and three other companies were granted leases to build offshore research towers off the coasts of New Jersey and Delaware.
The leases will allow the companies to conduct tests on wind farms at five different sites and gather important meteorological information and data on wind speeds. If the tests are successful, and the five proposed wind farms are built, their capacity would equal 1,750 MW, or enough power for 500,000 to 625,000 households (Bauers, 2009). If construction of the Cape Wind project progresses as planned, offshore wind power is likely to become a viable source of renewable energy for the United States as early as 2011 or 2012 (McNicholas, 2009). Value Chain
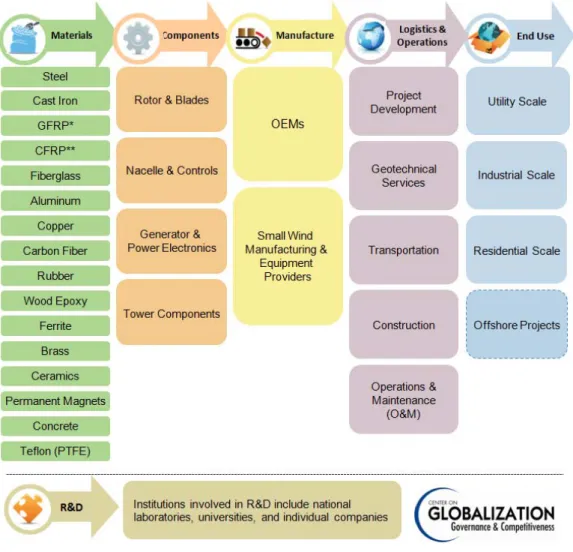
Improvements in performance, reliability and cost have led to the success and growth of the wind industry (U.S. DOE EERE, 2009). U.S. turbine technology has advanced to offer improved performance, and manufacturers have expanded their capacity to produce durable, high-quality components. The wind power value chain incorporates five main stages: materials; components; manufacture; logistics, development and operations (which includes project development,
10 geotechnical services, transportation, construction, and operations and maintenance); and end use (see Figure 4). A value chain that names important companies, agencies and organizations
appears at the end of this report (see Figure 11).
U.S. companies have a presence in each sector of the value chain, from materials production and component manufacturing to project development and construction. Thus, increased adoption of wind power technologies could have significant positive economic implications for the United States. Prior to the current economic recession, manufacturers faced a shortage of both domestic and international suppliers of wind turbine subcomponents for the rapidly growing industry. Currently, however, with orders and manufacturing slowing due to the downturn, such shortages have, for now, abated. The wind industry’s supply needs include gearboxes, bearings, turbine generators, fabricated parts, power transmission devices, and electrical equipment.
Figure 4. Simplified Wind Power Value Chain
Note: There are an estimated 8,000 parts in a wind turbine. The components listed here include Tier 1 and Tier 2 categories only. Source: CGGC, based on industry sources.
______________________________ * GFRP – Glass Fiber Reinforced Plastics **CFRP – Carbon-Filament Reinforced Plastics
11 Materials and Components
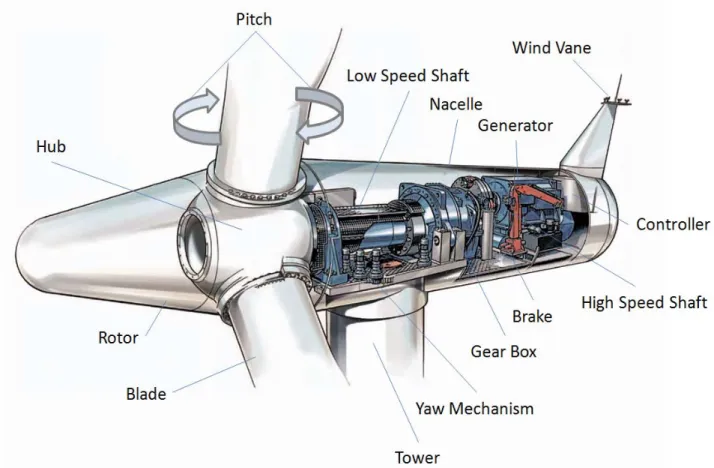
There are an estimated 8,000 parts in a wind turbine, but for the purpose of this report we have simplified the components into four categories: the rotor, the nacelle and controls, the generator and power electronics, and the turbine tower. The rotor includes the blades, which harness wind energy and convert it into mechanical energy, as well as a hub, which supports the blades. The generator and power electronics system includes the drivetrain, a generator – which converts mechanical energy into electricity – a yaw drive to rotate the nacelle, and electronic controls. The rapid growth of the wind power industry in recent years has put enormous pressure on component suppliers to meet the demands of the market. Wind turbine manufacturers are therefore resorting to various strategies such as vertical integration and signing long-term contracts with suppliers (Wood, 2009). As the wind power industry continues to expand, opportunities will be created for many companies to become involved across the value chain. The components of a wind turbine are illustrated in Figure 5, and the main components and sub-components with associated materials are illustrated in Figure 6.
Figure 5. Wind Turbine
12 Wind turbines are massive machines that typically weigh between 200 and 400 tons. A wide range of materials are used for wind turbine construction. Steel is one of the most important materials because of its strength and durability. Turbines are primarily made of steel, which accounts for 90% of the machine by weight. Every year the wind industry uses thousands of tons of steel for production of turbine components. A single 1 MW utility scale wind turbine tower is constructed from an estimated 100 tons of steel, and larger turbines use a significantly greater amount of steel. The rotor is constructed from approximately 45% steel, with the hub being made of 100% steel, and the blades being made up of 2% steel and a combination of fiberglass (78%) and adhesive (15%). Steel accounts for between 87% and 92% of nacelle components (American Wind Energy Association, 2009c).
Vestas, one of the leading wind turbine manufacturers in the world, uses an estimated 400,000 tons of steel annually for turbine tower production (Green Energy News, 2008). Wind turbine material usage is, and will continue to be, dominated by steel; however, aluminum and other light weight composites (hybrid fibers) could potentially be used as alternatives, primarily for blade manufacturing, as long as strength and fatigue requirements can be met (Ancona &
McVeigh, 2009). Pre-stressed concrete, which is used for turbine tower fabrication, is also a key material. A 44 MW wind power project, with 29 individual wind turbine towers, could use an estimated 12,470 tons of concrete, 6,500 tons of steel, and 609 tons of composite fiberglass5 (PPM Energy, 2004).
The most significant shortage in the wind industry is the availability of large bearings, which are used in gearboxes. Defective gearboxes are the main cause of wind turbine failure; therefore these components need to be manufactured to the highest quality. Large bearings are
manufactured by a small number of companies (about half a dozen worldwide). The shortage of supply of large bearings also affects turbine manufactures, because these bearings are needed for rotor pitch systems, yaw mechanisms and nacelle assembly (Industry Canada, 2007). The
primary material supply bottleneck for wind turbine manufacturing is the availability of permanent magnets, which are used in generator rotors. Availability of rare-earth permanent magnets is a concern because the key magnetic materials are not obtainable in large quantities in the United States. Supply constraints for copper and laminate steel, used for generator
manufacturing, are also a concern, making generators another major component supply
bottleneck (American Wind Energy Association, 2009e). The shortage of bearing-quality steel, which is needed for large bearing production, is also a materials pinch point.
Research and Development
The National Renewable Energy Laboratory’s (NREL) National Wind Technology Center (NWTC) is one the leading wind power technology research facilities in the United States. The NWTC assists the U.S. wind industry in developing cost-effective, high performance wind turbine technologies. NREL researchers work with industry partners to research, design, build, test, and refine advanced wind turbine designs. The NREL is also involved in utility grid integration research (National Renewable Energy Laboratory, 2009a).
5
13 Early equipment fatigue, especially in wind turbine gearboxes and power electronics systems, can greatly reduce wind turbine performance and raise wind turbine costs (National Renewable Energy Laboratory, 2009b). In 2007, a multi-year Gearbox Reliability Collaborative was set up to improve the reliability of gearboxes, through comprehensive laboratory testing, field testing, analysis and modeling. The Collaborative includes the NREL, wind turbine manufacturers, gearbox manufacturers, expert consultants, and other industry participants (Smith, 2007). In wind turbines, power electronics are generally variable speed drives (VSD) that enable the machines to run smoothly and continuously, regardless of wind speed. Research and
development of power electronics systems is important because power production in wind turbines is controlled by these systems. Power electronics enable wind turbine systems to perform like power plants, making them an active power source from an energy source (Infiniti Research Limited, 2009). Most of the research and development for power electronics systems focus specifically on silicon carbide (SiC) based power converters.
SiC devices could substantially reduce the cost of energy of large wind turbines that use power electronics for variable-speed generation systems (Marckx, 2006). Variable speed capability allows wind turbines to operate more efficiently at the speed that produces the most power, increasing energy production. Using SiC in power devices has several advantages because of this material’s unique characteristics, including lower losses, higher temperature, and faster
switching (Marckx, 2006). Technological advancements in power electronics systems for wind turbines will help reduce manufacturing costs, improve reliability and performance of turbines, and increase energy production capacity.
Considerable research and development for the wind power industry focuses on finding
alternatives to traditional materials. The U.S. DOE Wind Program is one of several organizations actively involved in researching materials options for wind turbine blades. Wind program
researchers are developing new blade material options, including carbon, carbon/glass hybrids, and S-glass. These advanced materials will reduce the weight of blades while increasing strength and flexibility (U.S. DOE EERE, 2009).
To ensure the continued growth of the domestic wind power industry, the Wind Program
collaborates with U.S. manufacturers to develop advanced fabrication techniques and automation processes (U.S. DOE EERE, 2009). The U.S. DOE also supports research and development activities through a number of its national laboratories. Universities, firms that specialize in wind power research and development (R&D), and wind energy companies, including GE, Siemens, and Vestas, are also actively involved in wind power R&D. This focus on fabrication and materials research ensures that the United States will continue to remain at the forefront of wind power technology development.
14 Figure 6. Wind Turbine Materials and Components
Note: There are an estimated 8,000 parts in a wind turbine. The components listed here include major Tier 1 and Tier 2 categories only. Source: CGGC, based on industry sources and company websites.
15 Wind Turbine Manufacturing
The rapid expansion of the U.S. wind power market and the demand for wind turbines has accelerated growth in the manufacturing sector and attracted the participation of large and small manufacturers. The global wind turbine manufacturing industry is dominated by a small number of OEMs, including Vestas (17.8% of the global market for wind turbines), GE (16.7%), Gamesa (10.8%), Enercon (9.0%), Suzlon (8.1%), Siemens (6.2%), Sinovel (4.5%), Acciona (4.1%), Goldwind (3.6%), Nordex (3.4%), Dongfang (3.4%), Repower (3.0%), and Mitsubishi (2.6%) (BTM Consult ApS, 2009). GE Energy is the leading U.S. wind turbine manufacturer, with 43% of the newly installed capacity in 2008, and over 48% of the more than 5,000 wind turbines that have been installed throughout the country over the past few years (Schoof, 2009). Other leading turbine manufacturers with some U.S. manufacturing involvement include Vestas, Siemens, Suzlon, Gamesa, Clipper, Mitsubishi, and Acciona WP. Although the leading companies account for about 98% of the new capacity added each year, new companies are entering the U.S. market, including Acciona, REpower, Fuhrlander, DeWind, and AWE (American Wind Energy
Association, 2009a). U.S. manufacturers are also the world leaders in both market and
technology development of small wind turbine systems rated 100kW or less (U.S. DOE, 2008). Wind turbine component manufacturing in the United States is growing rapidly. The market share of domestically manufactured wind turbine components was approximately 50% in 2008 (U.S. DOE EERE, 2009). However, the country is still a heavy importer of wind turbines. According to U.S. Customs data, in 2008, $2.5 billion worth of wind turbine imports came from Europe and Asia (Schoof, 2009), a sevenfold increase in imports over the 2003 figure of $356 million. According to U.S. Department of Commerce statistics, in 2008 the majority of wind turbine component imports came from Denmark (28.2%), Spain (26.7%), Germany (11.9%), India (7.1%), and the United Kingdom (5.5%). U.S. imports of parts for motors and generators, blades and other turbine components increased from $363 million in 2003 to $1.8 billion in 20086 (David, 2009). There has also been an increase in imports of generators for nacelles because of the rise in domestic production of nacelles.
During this period, U.S. exports also increased, but at a much slower rate: from $0.7 million to $22.1 million (David, 2009). The United States exports wind turbine components primarily to China, Brazil and Canada. U.S. exports of wind turbines and components have been limited and sporadic, but export and overseas investment opportunities have grown in recent years. Exports of wind turbines and blades are increasing slowly, and a number of tower and blade
manufacturers, including Acciona Energy, CTC/DeWind, Nordic Windpower, and LM Glasfiber, have established manufacturing facilities in the United States, with the possibility of supplying markets throughout the Americas (David, 2009). These numbers show the rising demand for wind power products both in the United States and internationally and indicate the enormous potential for the U.S. manufacturing sector to grow as the wind power industry expands.
Many foreign-based OEMs have plans to open or expand manufacturing facilities in the United States. This will enable them to reduce transportation costs, avoid import duties, alleviate risks from currency fluctuations, and ease logistical difficulties (David, 2009). The Danish company
6
These component categories are not wind industry specific, and figures include percentages for components used in other industries.
16 Vestas, the world’s largest manufacturer of utility-scale wind turbines, plans to begin production at its first U.S. manufacturing plant in Windsor, Colorado in 2010. This manufacturing plant will produce about 1,000 wind turbines per year (Daly, 2009).
In states such as Michigan and Ohio, whose manufacturing industries have been crippled by the economic crisis, there is potential to benefit from the growth of the wind power industry. The Michigan Economic Development Corporation estimates that approximately 700 companies in Michigan are emerging wind power manufacturing industry participants (Ferro, 2009).
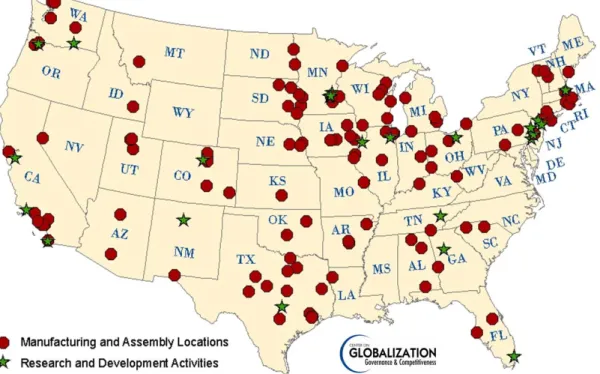
According to Ohio’s Department of Economic Development, 532 companies in the state are involved, or have plans to become involved in the wind supply chain (Boone, 2009); 88 of these companies are currently directly involved in the wind industry (Draginsky, 2009). Figure 7 illustrates the locations of existing and recently announced wind turbine manufacturing facilities.
Figure 7. Geographic Distribution of Representative Wind Turbine Component Manufacturers and R&D Locations (Includes Recently Announced Facilities)
Note: There are an estimated 8,000 parts in a wind turbine. The components listed here include Tier 1 and Tier 2 categories only. Source: CGGC, based on company websites, industry sources, and American Wind Energy Association.
Investment in wind power offers substantial benefits for the domestic manufacturing sector. Aside from the creation of new jobs, the wind industry is positioned to help revive
manufacturing jobs that have been lost in the motor vehicle industry and other sectors.
Companies in the auto industry are capable of transitioning to wind component manufacturing, primarily for small-scale wind projects. Auto manufacturers can retrofit automation
manufacturing facilities and employ former auto workers who have experience working with steel and the expertise to handle the advanced precision manufacturing needs of the wind
17 industry. Workers involved in the manufacture of components, such as industrial brakes and gearboxes, can easily make the transition to wind component manufacturing because the equipment and building processes for auto parts and these wind power components are similar. However, wind manufacturers are not necessarily seeking suppliers involved in huge production runs, therefore auto manufacturers interested in becoming involved in wind turbine
manufacturing need to make the switch from “high volume, low margin” to “low volume, high margin” production (Radomski, 2009). For details, please see text box on pages 34 and 35. Wind Project Development
Wind power project development for commercial-scale wind farms is a multifaceted, lengthy process that poses many challenges, often requiring collaborative efforts among several
companies. Project developers perform wind power feasibility analysis, site selection, wind farm design and layout, wind turbine selection and acquisition, obtaining federal and state permits, construction contracting, acquiring wind rights and leases, energy production estimates, and project financing (Costanti et al., 2006; National Wind, 2007).
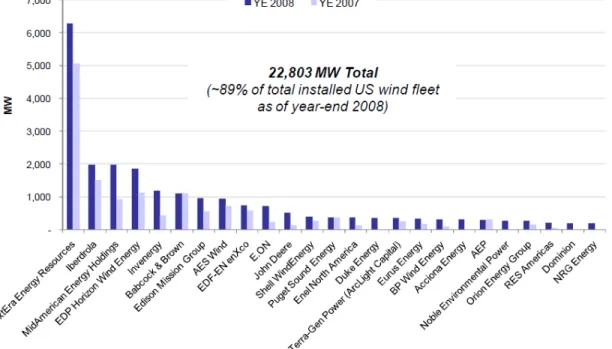
Wind power project developers are responsible for establishing access to capital for investment. In 2008, the average wind project installation cost $1,915/kW. The average reported cost from a sample of more than 3,600 MW of proposed projects for 2009 is $2,120/kW (Wiser & Bolinger, 2008). Wind project developers also have to invest in roads that can accommodate the transport of heavy industrial equipment and components. The wind project developer has a managing interest in the project when it is complete, but may not have complete ownership. The leading U.S. wind farm developers in 2008 are listed in Figure 8.
Figure 8. Top 25 U.S. Wind Farm Developers/Owners, Year-End 2008 (Cumulative)
18 Wind Turbine Transportation
Transporting wind turbines presents unique challenges and opportunities. Transporting these machines involves handling components that have an unusual weight, length and shape; thus companies that serve the industry must have equipment to transport very large and heavy cargo. The nacelles, blades, and turbine towers must be transported from the manufacturing facility to the wind farm location. The wind turbine industry needs to rely on collaborative transportation management processes, whereby manufacturers, logistics companies, transportation companies, and shipping ports share information and integrate their functions to achieve an effective
delivery process (Tremwell & Ozment, 2007). Modes of transportation for the wind industry include trucking, shipping and rail freight.
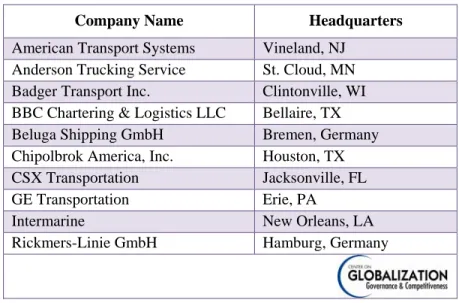
There are considerable opportunities for transportation providers in all sectors to serve the industry. A single wind turbine can require up to eight hauls, and for an entire project of 150 MW, transportation requirements could be as much as 689 truckloads, 140 railcars, and eight ships (Tremwell & Ozment, 2007). As the wind power industry continues to grow, demand increases for companies that are capable of transporting heavy and large loads. This could lead to the emergence of a specialized sector in the transportation industry, potentially creating many jobs throughout the United States.
Table 2. Representative Wind Power Component Transport Companies
Company Name Headquarters
American Transport Systems Vineland, NJ
Anderson Trucking Service St. Cloud, MN
Badger Transport Inc. Clintonville, WI
BBC Chartering & Logistics LLC Bellaire, TX
Beluga Shipping GmbH Bremen, Germany
Chipolbrok America, Inc. Houston, TX
CSX Transportation Jacksonville, FL
GE Transportation Erie, PA
Intermarine New Orleans, LA
Rickmers-Linie GmbH Hamburg, Germany
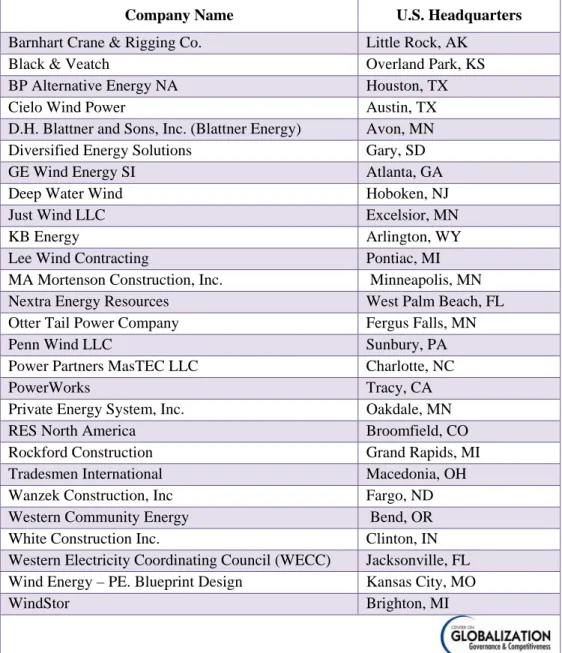
19 Wind Project Construction
Companies involved in large scale wind project construction generally offer turnkey
arrangements, according to criteria specified in the contract. Turnkey construction contractors provide engineering, procurement and construction services, including civil works, laying cables for electrical infrastructure, and installing wind turbines. On-site construction includes
excavating access roads and installing foundations for wind turbines. Geotechnical assessment, an important element of wind farm development, takes place before construction. Wind project developers may choose to hire companies that specialize in geotechnical assessments; however, a number of construction companies offer geotechnical services as part of their turnkey packages.
Table 3. U.S. Companies Involved in Wind Project Construction
Company Name U.S. Headquarters
Barnhart Crane & Rigging Co. Little Rock, AK
Black & Veatch Overland Park, KS
BP Alternative Energy NA Houston, TX
Cielo Wind Power Austin, TX
D.H. Blattner and Sons, Inc. (Blattner Energy) Avon, MN
Diversified Energy Solutions Gary, SD
GE Wind Energy SI Atlanta, GA
Deep Water Wind Hoboken, NJ
Just Wind LLC Excelsior, MN
KB Energy Arlington, WY
Lee Wind Contracting Pontiac, MI
MA Mortenson Construction, Inc. Minneapolis, MN
Nextra Energy Resources West Palm Beach, FL
Otter Tail Power Company Fergus Falls, MN
Penn Wind LLC Sunbury, PA
Power Partners MasTEC LLC Charlotte, NC
PowerWorks Tracy, CA
Private Energy System, Inc. Oakdale, MN
RES North America Broomfield, CO
Rockford Construction Grand Rapids, MI
Tradesmen International Macedonia, OH
Wanzek Construction, Inc Fargo, ND
Western Community Energy Bend, OR
White Construction Inc. Clinton, IN
Western Electricity Coordinating Council (WECC) Jacksonville, FL
Wind Energy – PE. Blueprint Design Kansas City, MO
WindStor Brighton, MI
20 Operation and Maintenance
The reliability of the turbine system is essential to a wind power project; thus operation and maintenance (O&M) services are critical. Operations include scheduling site personnel,
observing turbine operation, dealing with equipment failure, and coordinating with the utility to respond to curtailments or outages (Walford, 2006). Maintenance includes both scheduled
(preventative) services, such as periodic equipment inspections, oil and filter changes, calibration of electronic sensors, blade cleaning, and unscheduled services to repair component malfunctions. When wind turbines are installed and the wind farm is in use, routine maintenance is important to ensure maximum efficiency and lifespan of the machines. Generally, wind turbine
manufacturers service turbines during the first 2-5 years while the wind turbines are still under warranty. Thereafter, wind farm operators may perform maintenance on their own, or
subcontract the service to independent service companies (Wittholz & Pan, 2004). In the United States, companies such as Global Windpower Services, enXco Service Corporation, and
SeaWest WindPower specialize in maintenance and repair services, as well as providing operating support, to wind farm operators.
Table 4. Representative Wind Power O&M Companies
Company Name Headquarters
DKRW Wind (DKRW Energy) Houston, TX
DXP Enterprises Inc. Houston, TX
enXco Service Corporation Escondido, CA
Energy Composites Corporation Wisconsin Rapids, WI
Energy Maintenance Service Gary, SD
Evans Enterprises (Wind Division) Oklahoma City, OK
Frontier Pro Services Banning, CA
GE Wind Energy Tehachapi, CA
Global Wind Power Services Midland, TX
Horizon Wind Energy Houston, TX
Knight & Carver Wind Group National City, CA
M4 Wind Services Long Beach, CA
NAES Corporation Issaquah, WA
Rope Partner Santa Cruz, CA
SeaWest WindPower Inc. San Diego, CA
Shermco Industries Irving, TX
Texas Air Composites Desoto, TX
Turn Energy Maintenance, LLC Austin, TX
21 Global Wind Power Market
Wind power has rapidly grown into a mature and successful global business. Over the past decade, global wind capacity has grown at an average rate of 30% per year, and in 2008 more than 27 gigawatts (GW) of new capacity was installed around the world, bringing the total installed capacity to over 120 GW (Global Wind Energy Council, 2008b). According to World Wind Energy Association projections, by year 2020, at least 1,500 GW of wind power will be installed around the world, and this will support at least 12% of global electricity consumption (World Wind Energy Association, 2008). The United States is currently the world leader with 29,440 MW of installed capacity. The other world leaders are Germany (23,903 MW), Spain (16,754 MW), China (12,210 MW), and India (9,645 MW) (American Wind Energy Association, 2009a, 2009b). Although Europe (mostly Germany and Spain) and the United States account for about 80% of the world’s installed wind power capacity, more than 70 countries around the world are producing electricity from wind energy (Sawin, 2009). Figure 9 illustrates the growth in global cumulative wind power installed capacity over the past 12 years.
Figure 9. Global Cumulative Installed Wind Capacity 1996-2008
Source: (Global Wind Energy Council, 2008b)
Wind power is the fastest growing power generation technology in the European Union. After the United States, Europe has the second largest market for wind power. In 2008, 43% of all new energy installations were from wind power; gas and oil accounted for only 35% and 13%
respectively (Global Wind Energy Council, 2008b). The wind power market in Europe has diversified in recent years, and 10 of the 27 EU-member states currently have at least 1 GW of installed wind capacity. In 2008, wind power represented 7.5% of Germany’s electricity consumption, and the wind power industry employed approximately 100,000 people. Spain, Europe’s second largest wind power market, generated 31,000 GW hours of wind energy in 2008, covering more than 11% of the country’s electricity demand (Global Wind Energy Council, 2008b). Italy and France have also experienced significant growth in wind power production. The growth in wind power in Europe has been a major contributor to the economic welfare of the region and provided many employment opportunities. Between 2005 and 2007, 60,000 new jobs
22 were created in the European Union wind energy sector, making a total of 108,600 people directly employed in the industry (European Wind Energy Association, 2009).
There has also been remarkable growth in the wind power market in Asia. By 2007, China – a relative newcomer to the wind business at the time – ranked third in total number of wind installations, and fifth in total installed capacity with over 6 GW (Sawin, 2009). In 2008, the country continued its spectacular growth and added 6.3 GW of installed capacity, bringing the total to 12.2 GW (Global Wind Energy Council, 2008b). Other Asian countries with new wind capacity installations in 2008 are India (1,800 MW, for a total of 9.6 GW), Japan (346 MW, for a total of 1.9 GW), Taiwan (81 MW, for a total of 358 MW), and South Korea (43 MW, for a total of 236 MW) (Global Wind Energy Council, 2008b).
As the global demand for renewable energy resources grows, many countries have begun to put incentives and tariff policies in place, enabling them to remain competitive in the world energy market. The European Union has demonstrated a strong commitment to supporting renewable energy generation. To promote the use of renewable energy sources, European governments, including those of Denmark, Germany, Spain, France, the Netherlands, Portugal, Belgium, and Austria, have established feed-in tariff policies, which ensure that utilities pay a stipulated price for renewable energy (Vestas, 2007). These policies guarantee that utilities enable renewable energy plants to connect to the electricity grid. The utilities are also required to purchase any electricity generated by renewable resources at fixed minimum prices.
In Asia government policies have also led to the growth of the wind power market. China plans to install 30,000 MW of wind energy by 2020, and India plans to install 10,000 MW by 2010 (Vestas, 2007). Both countries have put in place tax measures and renewable portfolio standards, which require utility companies to generate a certain percentage of their output from renewable energy resources. The long-term policies that European and Asian governments established have directly led to the growth and development of wind power in these regions.
U.S. Wind Power Market
The United States currently generates 29,440 MW of electricity from wind, enough power to serve over 8 million homes (American Wind Energy Association, 2009b). Since 2000, wind-generated electricity has grown by more than 400%. The Department of Energy estimates that with the use of even 6% of U.S. land, more than one and a half times the current electricity consumption could be supplied through wind power (Burleson, 2008). In 2008, the United States became the world leader of total wind capacity installed, surpassing Germany. That year, the U.S. wind industry grew by 50%, adding over 8,500 megawatts (MW) of new wind power capacity to increase the nation’s cumulative total to over 23,000 MW (American Wind Energy Association, 2009a).
New wind projects completed in 2008 account for an estimated 40% of new U.S. power-generating capacity from all energy sources (U.S. DOE EERE, 2009). In 2009, Texas led the nation’s wind energy installations with a total capacity of 7,116 MW, followed by Iowa with 2,790, California with 2,517, Minnesota with 1,752, and Washington with 1,375 (National Renewable Energy Laboratory, 2009c). The growth of the wind power industry in the United
23 States is attributable to improvements in wind technology, increasingly supportive policies, and the growing interest in renewable energy resources (U.S. DOE, 2008).
Figure 10. U.S. Wind Installations and Renewable Portfolio Standards (2008)
Source:(Emerging Energy Research, 2009)
The growth of the wind power industry in 2008 represents an investment of about $17 billion (American Wind Energy Association, 2009a). In the United States, financial institutions, power utilities, turbine manufacturers, the government, and wealthy individuals are involved in wind power investment. The U.S. utility-scale wind power market is driven, at the federal level, by the renewable energy production tax credit (PTC), which offers a credit of 2.1 cents per kilowatt-hour. In 2005 and 2006, the U.S. wind industry installed nearly 2,500 MW after the
reinstatement of the PTC – an explosive growth in comparison to only 389 MW of new capacity in 2004 when the PTC had expired. Although the intermittent nature of the PTC incentive led to sporadic growth of the wind industry between the early 1990s and 2003, with the policy’s revival at the end of 2004, investments increased drastically enabling the United States to catch up with Germany and Spain, the leading wind power producers at the time. Owners of small wind systems with 100 kW of capacity or less can receive a credit of 30% of the total installed cost of the system, under the federal-level investment tax credit (ITC).
Wind power demand in the United States is also fueled by state renewable energy initiatives, and rising costs of natural gas (Industry Canada, 2007). Furthermore, many states have adopted a Renewable Energy Portfolio requirement that forces utilities to increase the percentage of their electrical power supply that comes from renewable resources. Since wind is a relatively low-cost renewable energy resource, the wind industry has seen considerable growth because of these
24 Renewable Energy Portfolio requirements. Policy incentives that have promoted the use of wind power and other renewable energy resources in the United States are listed in Table 5.
Table 5. Wind Power Policy Incentives
Policy Description
Renewable Portfolio Standard (RPS) RPS schedules electricity providers to obtain a minimum fraction of
their energy from renewable resources.
Capacity Rebates One-time up-front payments for building renewable energy
projects, based on installed capacity.
Feed-in Tariffs Feed-in tariffsset a minimum per kilowatt hour price that retail
electricity distributors pay to renewable electricity generators.
Production Tax Credit (PTC) The federal production tax credit reduces the corporate tax liability of the wind farm owner by 2.1 cents per kilowatt hour, for power
produced by wind.
Clean Renewable Energy Bonds Interest-free financing, for municipal and co-op utilities that have
no tax liability.
Section 9006 of the Farm Bill The Renewable Energy and Energy Efficiency Program, which funds grants and loan guarantees for agricultural producers and
rural small businesses.
System Benefits Charges These chargeslow-income support, renewables, efficiency, and R&D projects that are paid by all utility customers and create a fund for
are unlikely to be provided by a competitive market.
Net Metering Net meteringrequires retail utilities to offer credits to customers
who generate more electricity than they consume. Source: (Center for Sustainable Systems, 2008)
Domestic production of wind turbines and components is expected to expand as the wind industry continues to grow. While rising fossil fuel prices and possible climate-change policies will continue to spur the wind market, a long-term or permanent PTC is important to ensure steady market growth (Bolinger & Wiser, 2008). The American Recovery and Reinvestment Act (also known as the stimulus package) passed by Congress in February 2009 includes a three year extension of the PTC. This provides about two cents per kilowatt hour in the form of a tax credit back to wind power providers for a ten-year period (Great Lakes Wind Network, 2009). Changes to tax credit financing included in the stimulus package are expected to help boost investment in the wind power industry (St. John, 2009). The new extension of the PTC will cover wind
turbines installed through 2012.
According to a study by Emerging Energy Research (EER), wind capacity additions in the United States may drop to 6.5 GW in 2009, 24% below the record levels in 2008. However, EER forecasts a rebound in the U.S. wind market in 2010 and 2011, with 9.5 GW and 11 GW of wind capacity additions respectively. The EER’s base-forecast scenario estimates that U.S. annual wind power growth will increase from 8.5 GW in 2008 to approximately 15.5 GW in 2020. Growth in the U.S. wind power market will result from State Renewable Portfolio Standards (RPS), short-term boosts from new federal incentives, such as the 30% Investment Tax Credit
25 (ITC), major investments in U.S. wind turbine manufacturing facilities, extended commitments to wind power ownership by U.S.-regulated utilities, and development of transmission grid infrastructure (North American Clean Energy, 2008).
Transmission is currently the biggest long-term barrier to significant wind power expansion in the United States. In order to fully benefit from the growing wind power market, the United States needs transmission capacity to get wind from windy rural areas, where it is generated, to urban population centers where electricity consumption is greatest. In July 2009, Mesa Power, owned by energy baron T. Boone Pickens, called off plans for construction of the world’s largest wind farm. Although Mesa Power will still use the turbines in a series of smaller, dispersed wind farms, the company, which had already invested $2 billion into the original project, explained that transmission problems, from the Texas Panhandle site to the distribution system, caused the cancelation (Porretto, 2009). The United States could benefit from making better use of existing transmission capacity and investing in high-voltage interstate transmission highways.
Job Opportunities
The wind power industry draws on a variety of domestic industries and has the potential to create and sustain many jobs, bringing economic benefits to every region of the United States.
Although it is difficult to quantify the number of jobs that will result from growth in the wind power industry, reasonable estimates can be made by considering employment figures for companies involved in the wind industry. These companies include wind turbine manufacturers, major sub-component manufacturers, companies involved in geotechnical assessment and construction activities, as well as companies involved in wind-related R&D, and operation and maintenance service providers.
The significant growth in the U.S. wind market in 2008 led to the creation of 35,000 new jobs, bringing the total employment in the sector to over 85,000 (American Wind Energy Association, 2009a; Global Wind Energy Council, 2008a). Texas, the nation’s leading wind market, saw a marked increase in job creation with 2,500 wind project construction jobs in 2008, and the Illinois Governor’s Office also reported the creation of 3,500 wind industry-related jobs. Specific jobs in the wind industry are highlighted in Table 6.
Table 6. Job Opportunities in the Wind Power Supply Chain
Job Sector Specifics
Component Manufacturing Electrical, Mechanical, Fabrications, Other Sub-components
Commodity Manufacturing Fasteners, Lubricants, Wiring, Connectors, Other Electrical & Mechanical Base Industry Component Manufacturing Castings, Forgings, Rolled Steel, Resins, Woven Glass, Seals
Turbine Manufacturing Component, Composite, General Assembly, Tower Manufacturing, Site
Infrastructure
Transportation and Construction Cranes, Specialized Transport, Housings, Concrete and Steel Foundations
Power Equipment Power Transmission Equipment, Printed Circuits, Motors and Generators,
Measuring Devices
Operation and Maintenance (O&M) Operations and Monitoring, Maintenance and Repair, Asset Management
Off-take/ Transmission Grid Management, Transmission Services, Utility Services
26 In May 2009, the U.S. Department of Energy announced plans to invest $25 million in the first commercial large wind turbine blade facility in the United States, to be located in Boston, Massachusetts. To date, DOE has decided to invest roughly $118 million for wind energy development, with $93 million coming from the stimulus package (Bhambhani, 2009). This funding from the American Recovery and Reinvestment Act will leverage the Department of Energy’s national laboratories, universities, and organizations in the private sector through projects that will create green jobs, promote economic recovery, and provide the investments needed for improving renewable energy generation (Energy Efficiency and Renewable Energy, 2009).
Table 7 is based on research presented in Wind Turbine Development: Location of
Manufacturing Activity, which uses NAICS codes to identify industries that manufacture the major components for wind turbines. Although companies in these industries do not exclusively manufacture wind turbine components, they have the potential to manufacture wind components because they use the same skills and expertise (Chiappe, 2008).
Table 7. Employment in Wind-Component Manufacturing Industries
NAICS
Code Wind-Component Product
United States Employment United States Establishments Jobs per Establishment
326199 Blade, Nacelle Case 310,988 6,195 50
331511 Rotor Hub, Blade Extender, Tower Flange 53,888 508 106
332312 Tower 99,082 3,607 27
332991 Ball Bearings 33,035 216 153
333412 Cooling Fan 12,135 213 57
333611 Turbine Generators 21,715 193 113
333612 Gearbox, Industrial Speed Changers 14,501 297 49
333613 Couplings for Power Transmission 16,435 323 51
334418 Controller/ Printed Circuits 54,906 1,127 49
334519 Anemometer and Sensors 30,589 1,028 30
335312 Pitch Drive 47,387 658 72
335999 Power Electronics 28,574 973 29
723,235 15,338 47
The Wind-Component Product heading is not the NAICS title for the industry. For example, wind towers are manufactured by companies in NAICS 332312, which is the Fabricated Structural Metal Manufacturing Industry.
Source: (Chiappe, 2008)
Every time a wind power project is installed it creates jobs, not only in the manufacturing sector, but also for structural engineers, surveyors, mechanics, sheet metal workers, machinists, truck drivers, construction equipment operators and wind turbine operators. According to the North Carolina Wind Working Group, every 100 MW of installed wind power capacity provides 310 full-time equivalent (FTE) manufacturing sector jobs, 67 contracting and installation jobs, and 9.5 jobs in operation and maintenance every year (Methipara et al., 2008).
27 The U.S. DOE 20% Wind Energy by 2030 report estimates that by 2030, the wind industry could support 500,000 jobs, including over 150,000 direct jobs. An additional three million jobs in construction and wind project development are also projected. As the U.S. wind industry works to accomplish the 20% by 2030 wind power milestone that has been envisioned by the U.S. Department of Energy, many additional jobs will be created across the value chain.
The growth of the U.S. wind power industry will also benefit the small business sector. Small businesses currently make up over 90% of renewable and efficiency industries (U.S. House of Representatives, 2009). Adoption of environmentally sustainable technologies, including wind power generation, will further boost this sector and galvanize the domestic workforce. Although, small businesses tend to be the innovators and major producers of renewable energy products, they often struggle to remain competitive (U.S. House of Representatives, 2007). Therefore, incentives must be put in place to ensure that these businesses are able to maintain a strong position in the industry. A $30 billion revolving loan program, proposed as part of the American Clean Energy and Security Act (a climate bill) and funded by the U.S. Treasury, will help small businesses retool, expand or create manufacturing operations related to clean and renewable energy (Mulkern, 2009). According to U.S. Senator Sherrod Brown, who is co-sponsoring the climate bill, the bill could potentially generate 680,000 new manufacturing jobs directly, and support about 2 million jobs, over the next five years (Shingler, 2009).
Wind Turbine OEMs and Component Manufacturers
OEMs usually manufacture the nacelle in-house, and blades and towers are produced either by the OEM or fabricated to the OEM’s specifications by a supplier. The wind project developers contract with the OEMs for the delivery of the complete wind turbine, including the nacelle, blades, and turbine tower, which are transported from the manufacturing facility directly to the wind farm construction site (David, 2009). Competition among wind turbine OEMs has
increased substantially as the wind power industry has expanded around the world. Many European companies – including Vestas, Gamesa, Enercon, and Acciona Energy – have taken the lead in wind turbine manufacturing, because the technology is mature in this region, but Asian firms such as Suzlon (India), Sinovel (China), and Goldwind (China) are also market leaders.
OEMs with nacelle assembly facilities in the United States include Acciona, Clipper Windpower, DeWind, Gamesa, and GE Energy. Siemens, Suzlon, and Vestas only manufacture blades at U.S. facilities; however, both Siemens and Vestas have recently announced plans to open nacelle assembly facilities in the United States. Including Siemens, Suzlon, and Vestas, 7 OEMs have announced plans to open manufacturing facilities in the United States (Isaacs, 2009). GE, the leading U.S. turbine manufacturer, has 16.2% of the world market share, making it the second largest wind turbine OEM after the Danish company Vestas. GE turbine installations in the United States increased from 903 MW in 2003 to 3,657 MW in 2008. Other leading OEMs with installations in the U.S. market in 2008 are Vestas (1,120 MW), Siemens (791 MW), Suzlon (763 MW), Gamesa (616 MW), and Clipper Windpower (595 MW) (American Wind Energy Association, 2009a).
28 A list of leading companies that manufacture utility-scale wind turbines, as well as firms
involved in small-scale or residential wind turbine manufacturing, is provided in Table 8. This list includes company headquarters and, where available, the U.S. manufacturing, assembly, and R&D locations relevant to wind power. Total company employees and total company sales, while not reflective of a given company’s specific involvement in the wind industry, helps provide a sense of relative size of the firms involved.
Table 8. Wind Turbine OEMs (Large and Small Turbines)
Scale Company Name Headquarters
U.S. Manufacturing, Assembly, and R&D Locations Total Company Employees Total Company Sales (USD mil)
Utility Americas Wind Energy Inc.* Toronto, ON, Canada n/a 2 n/a
Small Abundant Renewable
Energy*
Newberg, OR Newburg, OR 7 $1.8
Utility Acciona Energy Chicago, IL West Branch, IA 40,000 $4,067.50
Small Aerostar Inc.* Westport Point, MA Westport Point, MA 20 n/a
Small AeroVironment Monrovia, CA Simi Valley, CA 543 $215.7
Medium Atlantic Orient Canada Inc.7 Dartmouth, NS, Canada
n/a 6 $1.6
Small Bergey Windpower* Norman, OK Norman, OK 30 $6.5
Utility Bonus Energy A/S (Siemens) Brande, Denmark n/a 209 $488.8
Utility Clipper Windpower Carpinteria, CA Cedar Rapids, IA 62 $23.8
Utility DeWind Irvine, CA Irvine, CA 186 $7.8
Utility Enercon GmbH Aurich, Germany n/a 240 $4.5
Utility Medium
Enertech Wind* Newton, KS n/a n/a n/a
Medium Entegrity Wind Systems Inc. Boulder, CO n/a 19 $2.1
Utility Medium
Fuhrlander AG* Waigandshain,
Germany
Butte, MT † 150 $97.1
Small Gaia Wind Ltd.* Glasgow, Scotland n/a n/a n/a
Utility Gamesa Corporación Tecnológica S.A.
Vitoria-Gasteiz, Spain Fairless Hills, PA 7,187 $5,135.2
Utility GE Wind Energy8 Tehachapi, CA Fairfield, CT 322,980 $182,515.0
Utility Global Wind Systems Novi, MI Novi, MI † 350 $2.1
Small Mariah Power* Reno, NV Reno, NV 30 $0.1
Manistee, MI Utility
Medium
Mitsubishi Power Systems Lake Mary, FL Orlando, FL 64,072 $22,734.1
7
Atlantic Orient Canada Inc. is a partnership between Atlantic Orient Corporation of Norwich, VT and Seaforth Engineering Group.
8
29
Scale Company Name Headquarters
U.S. Manufacturing, Assembly, and R&D Locations Total Company Employees Total Company Sales (USD mil)
Utility Nordex Energy GmbH Norderstedt, Germany Chicago, IL 1,885 $1,591.9
Utility Nordic WindPower Berkeley, CA Pocatello, ID 10 $11.5
Utility Medium
Northern Power Systems* Barre, VT Barre, VT 100 $5.0
Utility Medium
Norwin Roskilde, Denmark Plymouth, MA n/a n/a
Medium Small
Pacwind (WePower)* Torrance, CA Torrance, CA 15 $9.1
Small Proven Energy Ltd.* Glasgow, Scotland n/a 12 $1.2
Small ReDriven Power Inc.* Iroquois, ON, Canada n/a n/a n/a
Utility REpower USA Corp Portland, OR Portland, OR 11 $1.3
Utility Siemens Power Generation Orlando, FL Hutchinson, KS † 5,500 $115,982.7
Utility Sinovel Wind Co. Ltd. Beijing, China n/a 180 $337.1
Small Southwest Windpower* Flagstaff, AZ Flagstaff, AZ 80 $12.1
Utility Suzlon Wind Energy A/S Pune, India Pipestone, MN 3,500 $1,738.4
Utility Medium
Turbowinds Inland Bruxelles, Belgium n/a n/a n/a
Small Ventera Energy Inc.* Duluth, MN Duluth, MN 4 $0.2
Utility Vestas Wind Systems A/S Randers, Denmark Windsor, CO 20,829 $5,566.0
Pueblo, CO Brighton, CO † Houston, TX †
Small Wind Turbine Industries* Prior Lake, MN Prior Lake, MN 3 $3.5
† Facility locations expected to open in 2009/2010
* Companies involved in small-scale, residential wind turbine manufacturing
Source: CGGC, based on AWEA, company websites, D&B Selectory, Hoovers, OneSource
Table 9 provides a similar list of companies involved in component manufacturing, assembly, or R&D activities for the wind power industry. These firms range from large multinational
corporations such as Vestas Wind Systems A/S, Siemens Power Generation, and GE Energy to smaller U.S.-based firms. The United States is currently the fastest growing wind power market, and about 50% of components for large wind turbines are manufactured domestically. In 2009, there were roughly 120 manufacturing plants producing wind turbines or turbine components in the United States (Daly, 2009). The companies presented in this table are merely representative and do not reflect the full extent of the component supply base.
30 Table 9. Wind Power Selected Component Manufacturing Firms
Company Name Headquarters
U.S. Manufacturing, Assembly, and R&D Locations Total Company Employees Total Company Sales (USD mil) Blade and Rotor Manufacturers
A&C Green Energy Dallas, TX Plano, TX n/a n/a
CAB Inc. Buford, GA Nacogdoches, TX 65 $100.0
Gamesa Corporación Tecnológica S.A.
Vitoria-Gasteiz, Spain Fairless Hills, PA 7,187 $5,135.2
K&M Machine Fabrication Cassapolis, MI Cassapolis, MI 250 $30.0
Knight & Carver Wind Group National City, CA Howard, SD 150 $22.8
LM Glasfiber Kolding, Denmark Grand Forks, ND 4,771 $848.7
Little Rock, AK Molded Fiber Glass
Companies
Ashtabula, OH Aberdeen, SD 1,917 $144.5
Gainesville, TX Ashtabula, OH
Polymarin LB Hoorn, The Netherlands Little Rock, AK † n/a n/a
Siemens Power Generation Orlando, FL Fort Madison, IA 83,000 $115,982.7
Suzlon Chicago, IL Pipestone, MN 3,500 $1,738.4
TPI Composites Warren, RI Warren, RI 100 n/a
Newton, IA
Vestas (U.S. Division) Portland, OR Windsor, CO 6,000 $56.9
Brighton, CO †
Wausaukee Composites Wausaukee, WI Wausaukee, WI 3,368 $415.5
Cuba City, WI Gillett, WI
Generator and Power Electronics Manufacturers
Advantech Milpitas, CA Irvine, CA 1,360 $505.7
Cincinnati, OH
Brad Foote Cicero, IL Cicero, Il 1,050 $17.3
Brevini Vernon Hills, IL Muncie, IN † 347 $248.2
Danotek Canton, MI Plymouth, MI † 20 $2.0
Canton, MI
K&M Machine Fabrication Cassapolis, MI Cassapolis, MI 250 $30.0
Moventas Cambridge, ON, Canada Faribault, MN † 50 $9.0
Siemens Power Generation9 Orlando, FL Elgin, IL † 5,500 $115,982.7
Winergy Drive Systems10 Elgin, IL Elgin, IL 83,000 $115,982.7
9
Siemens Power Generation is a subsidiary of Siemens AG.
10
31
Company Name Headquarters
U.S. Manufacturing, Assembly, and R&D Locations Total Company Employees Total Company Sales (USD mil) Nacelle and Controls Manufacturers
Acciona Energy Chicago, IL West Branch, IA 40,000 $4,067.50
Beckhoff Automation Burnsville, MN n/a 557 $2,505.0
CAB Inc. Buford, GA Nacogdoches, TX 65 100.0
Clipper Windpower Carpinteria, CA Cedar Rapids, IA 62 $23.8
CTC/DeWind Irvine, CA Irvine, CA 186 7.8
Gamesa Corporación Tecnológica S.A.
Vitoria-Gasteiz, Spain Fairless Hills, PA 7,187 $5,135.2
GE Energy Tehachapi, CA Newport Beach, CA 322,980 182,515.0
St. Petersburg, FL Greenville, SC Emergya Wind Technologies Schoondijke, The
Netherlands
Little Rock, AK † n/a n/a
Fuhrlander AG Waigandshain, Germany Butte, MT † n/a n/a
Molded Fiber Glass Companies
Ashtabula, OH Opp, AL 1917 $144.5
Nordex Energy GmbH Norderstedt, Germany Jonesboro, AK † 1,885 $1,591.9
Nordic WindPower Berkeley, CA Pocatello, ID 10 $11.5
NRG Systems Hinesburg, VT Hinesburg, VT 108 $59.0
Second Wind Inc. Somerville, MA Somerville, MA 34 $4.7
Siemens Power Generation Orlando, FL Hutchinson, KS † 5,500 $115,982.7
TPI Composites Warren, RI Warren, RI 100 $137.2
Newton, IA
Vestas Wind Systems A/S Ringkobing, Denmark Brighton, CO † 20,829 $5,566.0
Wind & Water Technologie Schoondijke, The Netherlands
Little Rock, AK † n/a n/a
Wausaukee Composites Wausaukee, WI Wausaukee, WI 3,368 $415.5
Cuba City, WI Gillett, WI
Tower and Tower Component Manufacturers
Aerisyn Chattanooga, TN Chattanooga, TN 150 $10.1
American Tower Company Shelby, OH Shelby, OH 11 $1.3
Ameron Pasadena, CA Rancho Cucamonga,
CA
2,800 $667.5
Avanti Wind Systems New Berlin, WI New Berlin, WI 83 $4.4
Barr Fabrication Brownwood, TX Brownwood, TX 50 $6.4
Beaird Industries Shreveport, LA Shreveport, LA 300 $27.8
Bergen Southwest Steel Canutillo, TX Canutillo, TX 140 $24.9