Funding Modes of German Banks: Structural Changes
and their Implications
Lars Norden&Martin Weber
Received: 18 October 2006 / Revised: 09 April 2010 / Accepted: 13 April 2010 / Published online: 5 May 2010
#The Author(s) 2010. This article is published with open access at Springerlink.com
Abstract We investigate the funding modes of German banks and the implications for lending and profitability during 1992–2002. We find that at many banks, deposits from customers decrease in relative terms while interbank liabilities increase as a source of funding. We cannot detect a negative impact of the relative decline in deposits on lending. The decreasing ability of banks to collect deposits and the substitution of deposits by interbank liabilities unfavorably affects the net interest result of banks that exhibit a deposit deficit, especially savings banks. Our findings indicate a structural lengthening of the intermediation chain, which has broader implications for the functioning and stability of the financial system.
Keywords Universal banking . Deposit taking . Interbank markets
JEL classification G21
1 Introduction
Deposit taking and lending represent key activities of universal and commercial banks. Qualitative asset transformation, comprising lot size, maturity, and risk transformation, are defining characteristics of these banks. In this paper, we investigate the funding modes of
L. Norden (*)
Department of Finance, Rotterdam School of Management, Erasmus University, Burgemeester Oudlaan 50, 3000 DR Rotterdam, the Netherlands
e-mail: [email protected] M. Weber
University of Mannheim, Mannheim, Germany e-mail: [email protected] M. Weber
banks and the implications for lending and profitability. To do so, we take a micro perspective to identify structural changes in banks’ balance sheets that influence the intermediation chain in a financial system.
This topic is part of the broader literature on the role of banks. Long before the financial crisis of 2007–2009, financial intermediaries were subject to considerable structural changes, so there has been much discussion about the future of banks (Boyd and Gertler
1995; Edwards and Mishkin1995; Rajan1996; Miller1998; Allen and Santomero 2001; Bossone2001). Banks have been facing challenges arising from globalization, liberaliza-tion, consolidaliberaliza-tion, disintermedialiberaliza-tion, and financial innovations. These long-run develop-ments indicate that financial intermediation is subject to substantial changes. Surprisingly, other than anecdotal statements, there is relatively little empirical evidence for the impact of these developments on banks’funding modes (Schmidt et al. 1999). For example, some researchers state that the structurally declining role of deposits represents a future critical issue, because deposits were the most important funding source of German banks in the past and have contributed significantly to their net interest income (Hackethal2004).
In a preliminary analysis based on banking sector data from the 30 OECD countries over the past 25 years, we find that in Germany, Greece, Italy, Portugal, Spain, and Switzerland, deposits relative to total bank assets have steadily lost ground, but in Australia, Japan, Netherlands, and the United States they have been stable. In Belgium, France, Hungary, and Poland, deposits have even slightly gained in importance. The evolution of deposits is somewhat ambiguous in the remaining countries of Europe.
In our analysis, we focus on the evolution of the funding structure of German banks over the period 1992–2002. Germany, which has one of the world’s largest banking systems, represents an interesting opportunity to study banks’funding modes for several reasons: it provides a typical example for a bank-based financial system. More importantly, like U.S. banks, German banks rely heavily on deposits as a funding mode. In addition, the Financial Sector Assessment Program (FSAP) report from the International Monetary Fund has initiated a new debate on the future of Germany’s three-pillar banking system (Brunner et al.
2004). The three-pillar system’s diversity, which includes the two-tier structure with group-central banks in the savings banks and cooperative sector, makes it possible for us to study the funding modes of a wide range of different banks. To the best of our knowledge, although Salas and Saurina (2002) provide evidence from Spain that the institutional form clearly matters for the lending behavior of commercial and savings banks, ours is the first study to differentiate between both deposit types and the institutional form of banks. Moreover, our results are based on a micro data set that has not been used before to investigate the funding modes of banks. Further, with the financial crisis that began in 2007, it has become evident that banks’funding modes have broader implications for the functioning and stability of the entire financial system.
We address the following three questions: How can we characterize the evolution of deposits taken by German banks? What is the relation between deposits from customers and other funding modes? What is the impact of potential changes of the liability structure on the asset structure and bank profitability? Rather than explaining the evolution of deposits or explicitly analyzing the effects of competition, we take the evolution of deposits as given and examine its consequences for funding modes, lending, and profitability at the level of the individual bank. This assumption makes it possible for us to analyze the interplay of different types of funding modes, which would not have been possible if we had assumed loan demand as exogenous.
Our paper relates to the studies that analyze financial systems (e.g., King and Levine
example, Domanski’s (1997) analysis of aggregate data for the German financial system during 1970–1995 indicates a decline in the relative importance of deposits from customers while the lending business does not decrease in relative terms. Schmidt et al. (1999) investigate whether there is a trend towards disintermediation in Germany, France, and the United Kingdom during the period 1982–1996. They find evidence that the ability of banks to collect deposits from customers has declined because the intermediation chain has been lengthened by mutual funds, and banks seem to specialize in lending while other nonbank financial intermediaries specialize in providing investment products. Furthermore, Dinger and von Hagen (2005) study the liberalized banking systems in Eastern Europe and find that incumbent banks are able to generate higher profits than new entrants due to their strong position in deposit markets. Additionally, these authors show that interbank borrowing banks have a lower profitability than do those that rely on deposits from customers as main funding mode.
Our paper also relates to the basic financial intermediation literature, especially to those studies that focus on the deposit-taking role of banks. Early theoretical papers such as those by Diamond and Dybvig (1983) and Calomiris and Kahn (1991) provide rationales for the existence of banks that hinge on deposit taking and the beneficial implications of banks being exposed to runs. More recently, some empirical studies analyze the link between deposit taking and lending. For example, there is evidence from the U.S. that core deposits, i.e., deposits with inelastic interest rates, represent an important basis for relationship lending (Berlin and Mester1999). Alternative explanations for the coexistence of lending and deposit taking are based on information or liquidity synergies (e.g., Black1975; Fama1985; Kashyap et al.2002; Mester et al.2007; Norden and Weber2010). Other recent research examines the role of funding strategies on bank risk and return (e.g., Demirgüç-Kunt and Huizinga2009; Huang and Ratnovski2009).
The paper is organized as follows. In Section2we propose a set of hypotheses, present the institutional characteristics of the German banking system, and describe the data. In Section 3 we outline the empirical method, report our main results for the multivariate hypothesis tests, and analyze the robustness of our findings. Section4concludes.
2 Hypotheses, institutional background, and data
2.1 Hypotheses
We propose four hypotheses on the relation between bank funding modes, bank lending and bank performance. All four hypotheses are motivated by, and relate to, the question of whether there are structural changes on the liability side of bank balance sheets and if so, what the potential consequences are. These changes might result from the interplay between the growth of bank lending and difficulties in collecting deposits from households. All our hypotheses refer to the individual bank level, not to the entire banking system. As noted beforehand, we assume the evolution of deposits as given and analyze its consequences. This assumption is supported by the structure of the German banking system, in which there are many banks and bank branches and relatively low interest rates on standard savings deposits, and also by overall trends in the allocation of savings by households in Germany. Moreover, this assumption is rooted in the historical evolution of commercial banking, implying that banks first collect deposits and then lend to firms. Alternatively, it is possible to assume that loan demand is exogenous, while loan supply is endogenous. Such an assumption would make all types of banks’ funding modes endogenous and cannot
explain structural changes between different funding modes over time. Since the latter is the main objective of our study, we do not make this alternative assumption.
In contrast to their traditional purpose, interbank liabilities might serve not only as a temporary buffer for asset-liability imbalances, but might also fill structural funding gaps. However, interbank liabilities can only serve as a resource for some banks, not for the whole system. In Germany, permanent funding with interbank liabilities seems particularly attractive for institutions that belong to two-tier systems, such as the savings bank sector or the cooperative sector. For example, savings banks can rely on borrowing from their regional group-central banks (Landesbanks) while the Landesbanks rely on bonds, debentures, and borrowing from other specialized banks as a major source of funding. A similar two-tier structure applies to the cooperative sector. This reasoning implies that banks that have difficulty collecting deposits tend to become net interbank borrowers, while others become net interbank lenders. This trend indicates an increasing degree of vertical specialization in the banking system. Therefore, we expect a significant negative relation between changes in interbank liabilities and changes in deposits from customers, especially at savings banks and credit cooperatives.
H1 (Substitution hypothesis) The growth of interbank liabilities is negatively related to the growth of deposits from customers.
If a bank cannot compensate for a decline in deposit taking by using other funding modes, then we expect to find a significant positive relation between changes in deposits and changes in loans to customers. This situation may hold for a bank which has already fully drawn down its credit lines in the interbank market or from the group-central bank and no longer has sufficient borrowing capacity. Consequently, under the “bottleneck hypothesis,” funding problems translate directly into lending problems, i.e., the bank is forced to grow at a slower rate or, in the extreme case, to reduce lending. Alternatively, a bank might respond to funding problems by reconfiguring its asset-side structure. Under the bottleneck hypothesis, we should not observe a reconfiguration of the asset structure, but a negative impact on lending. Given the two-tier structure of the savings banks and cooperative sector, we expect that it is less likely to observe a bottleneck for savings banks and credit cooperatives, because, unlike commercial banks, savings banks and credit cooperatives rely on funding from group-central banks.
H2 (Bottleneck hypothesis) The growth of lending to customers is positively related to the growth of deposits from customers.
Furthermore, a decline of deposits may lower a bank’s net interest result (e.g., Demirgüç-Kunt and Huizinga 2009). In Germany, interest expenses on deposits from customers tend to be lower than interest paid on interbank liabilities.1 Therefore, the net interest income of a bank might be reduced if a decrease in deposits from customers is offset by an increase in wholesale funding. This is because the new funding mix, given a particular asset structure, will result in higher interest expenses. This reasoning only holds if the deposits that decline in importance bear lower interest rates than do the interbank liabilities. Most important, compared to funds borrowed from group-central banks or other
1
Deposits from customers are generally considered as a relatively cheap funding mode (e.g., Ianotta et al.
banks at money-market rates, this condition is met for the savings deposits that represent the key source of funding of savings banks.
H3 (Performance impact) Changes of the net interest income are positively related to the growth of deposits from customers.
Finally, we assume that a bank’s net position with customers will have a significant impact on its net interbank position. We define surplus banks as institutions in which deposits from customers exceed loans to customers, and deficit banks as those banks in which loans to customers exceed deposits from customers. Given this imbalance in lending and deposit taking opportunities, deficit banks partially use funding from other banks to take fully advantage of their lending potential. If it becomes economy-wide more difficult to gather deposits from households, which is by definition harder for deficit banks than for surplus banks, deficit banks face a stronger need for alternative funding modes because they are more likely to maintain their lending volume than surplus banks. Such a situation might be more realistic for deficit banks in the two-tier systems, and would lead to an overall lengthening of the intermediation chain. A structural change in a bank’s net customer position, e.g., a decreasing ability to collect deposits, could affect the net interbank position, non-deposit funding modes, and the corresponding growth rates. Therefore, we expect stronger effects at deficit banks than at surplus banks.
H4 (Difference between surplus and deficit banks) Changes in funding modes are stronger at deficit banks than at surplus banks.
2.2 Institutional characteristics of the German banking system
The German banking system is a typical universal banking system (Hackethal 2004; Brunner et al.2004; Fitch Ratings2005). There are three major pillars: private commercial banks, including the four big banks; state-owned savings banks, including the Landesbanks; and credit cooperatives, including the cooperative central banks. These three sectors comprise a large number of legally independent banking firms; although they do not represent banking groups or bank holding companies, they may include some. The structure of the banking system reflects the federalist-decentralized structure of the German political and economic system. Although private commercial banks are very different in terms of size, geographic coverage, and activity, the savings banks and credit cooperatives sectors are more homogeneous.
The savings bank sector has a three-layer pyramidal structure. The top layer consists of one group-central bank that mainly provides the entire savings bank sector with payment, brokerage, and investment banking services. The intermediate layer comprises 12 Landesbanks that serve as money center banks for savings banks from the same and/or neighbored regions. The bottom layer comprises roughly 500 savings banks that traditionally focus on deposit taking and lending. All banks in this sector are state-owned. The cooperative sector has two layers. The top layer, the cooperative central banks, consists of two institutions. Like the Landesbanks, the cooperative central banks focus on commercial and real-estate lending, and serve as money center banks for the credit cooperatives. The bottom layer, comprising the credit cooperatives, focus on deposit taking and lending. Because of mergers and acquisitions, their number decreased from more than 3,000 in 1992 to 1,300 in 2002. Cooperative banks are not publicly listed. They are privately owned by their members.
In Germany, there is a mandatory“regional principle”for both savings banks and credit cooperatives. The charters of these banks include a clause that restricts their banking activities to a specific region, thus avoiding competition with institutions from the same sector. The regional principle leads to a geographic specialization of the retail institutions. All banks are subject to federal banking regulations and supervision. Moreover, deposits at commercial banks are directly insured up to a fixed amount while deposits at savings banks and credit cooperatives are fully insured by the sector-specific banking associations. Another distinguishing feature is that less than 1% of all banks are publicly listed. Furthermore, the banking system is characterized by a large number of banks and their branches, but only a small number of inhabitants per bank branch. In 2001, there were 1,880 inhabitants per branch, in 2003, 2,113 inhabitants per branch. Therefore, Germany has often been called “overbanked” and “overbranched” (Deutsche Bundesbank 2002; Deutsche Bundesbank2004; Fitch Ratings2005). The Herfindahl-Hirschman Index (HHI) for the German banking market is relatively small, indicating a low degree of concentration (Hempell2002). However, market concentration statistics should be interpreted carefully: the degree of concentration is clearly higher at local levels because of the regional principle. Moreover, Germany faces an increasing intrasector consolidation in the cooperative and savings bank sector (see, e.g., Elsas 2004). Consequently, the absolute number of independent banking firms (bank branches) decreased by roughly 43% (25%) between 1992 and 2002. Finally, the savings banks sector is changing, because in July 2005, European Union law abolished all kinds of public guarantees for savings banks and Landesbanks, considering them to be illegal state aid. This development unfavorably affects the funding costs of the Landesbanks because a deterioration of their credit ratings increases the credit spreads of newly issued bonds and debentures, while savings banks do not face higher funding costs since they rely on fully insured deposits. However, these institutions are confronted with an ongoing debate about ownership and governance, risk taking, and cross-sector or cross-border mergers and acquisitions (Hackethal2004; Brunner et al.2004; Gropp et al.2009).
2.3 The data
To investigate the evolution of banks’ funding modes, we analyze data for all German banks, provided by the Deutsche Bundesbank. The data we use are the bank balance sheet statistics (publicly available aggregate data, 1970–2002, monthly); bank balance sheet statistics (not publicly available, anonymous bank-level data, 1992–2002, monthly); and bank income statement statistics (not publicly available, anonymous bank-level data, 1992– 2002, yearly). Since both balance sheet and income statement statistics reflect the entire German banking system, we do not have selection problems and sampling errors. Figure1
displays the evolution of German banks’ funding items relative to total assets over the period 1970–2002.
It can be seen that the ratio of deposits from customers to total assets declines from above 50% in the late 1980s to below 40% in the late 1990s. The spike in some curves in 1990 is due to the effects of the German unification. During the period from 1970 to 2002, deposits from banks rise from 20% to almost 30% of total assets (Ehrmann and Worms
2001). In addition, the share of bonds relative to total assets increases. We note that the mean equity ratio of German banks has been relatively stable during the entire period (Kleff and Weber2008; Heid et al.2004).
Figure2differentiates the evolution of deposits by bank categories. During the 1990s, there is a clear decrease in deposits from customers relative to total assets for all three bank
categories, indicating a general trend. Because we calculate the time series in Figs.1and2
as percentages of total assets from the same period, they are not biased by Germany’s inflation rate. We note that this evolution does not necessarily imply that the absolute stock of deposits from customers is declining, but does at least indicate that it is growing at a
0 10 20 30 40 50 60 1970-011972-07197 5-01 197 7-07 1980-011982-071985-011987-071990-011992-07199 5-0 1 199 7-07 2000 -01 2002-0 7 % deposits from customers deposits from banks bonds equity
Fig. 1 Funding items to total assets of all German banks (in %). The figure shows the time series of aggregate data from the Deutsche Bundesbank by main funding items during the period from January 1970 to December 2002 0 10 20 30 40 50 60 70 80 90 100 1970 -01 1972 -07 1975 -01 1977 -07 1980 -01 1982 -07 1985 -01 1987 -07 1990 -01 1992 -07 1995 -01 1997 -07 2000 -01 2002 -07 %
savings banks credit cooperatives
big banks
Fig. 2 Deposits from customers to total assets by bank categories (in %). The figure shows the time series of aggregate data from the Deutsche Bundesbank for savings banks, credit cooperatives, and big banks during the period from January 1970 to December 2002
slower rate than other funding items. In other words, assets of retail banks are increasingly funded by means other than deposits from customers.
We categorize the variables in our study as funding modes, bank assets, performance measures, and bank characteristics (see Appendix 1 for definitions). On the one hand, analyzing percentage changes of absolute balance items has the advantage that the variables are not technically related to each other. Examining first differences of ratios can create technical dependencies if we analyze the relation between all variables from the same side of the balance sheet. Further, changes in ratios may be difficult to interpret, since they are driven by changes in both the numerator and the denominator. We note that our variable construction avoids both shortcomings. On the other hand, growth rates refer to levels from different banks and years. Therefore, to confirm our results, we perform robustness tests based on first differences of ratios in Section3.3. Bank characteristics are captured by the following variables:
(1) PROV represents the net change in loan loss provisions. (2) EQRAT represents bank capital.
(3) MERGE, is a dummy variable equal to one if a bank acquires another bank in a particular year.2
(4) EAST is a dummy variable that takes the value one if a bank’s head office is located in Eastern Germany. This variable coincides with the area of business of savings banks and credit cooperatives because of the regional principle. However, it does not reflect the area of business of the big banks because the latter operate nationwide.
(5) CITYSTATE, which is a dummy variable that takes the value of one if a bank’s head office is in the city states of Berlin, Hamburg, or Bremen.3
(6) SIZE represents the log of total assets.
(7) GROWTH represents the growth rate of total assets.
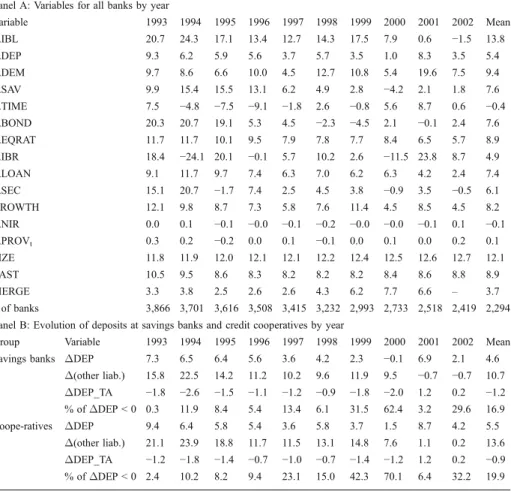
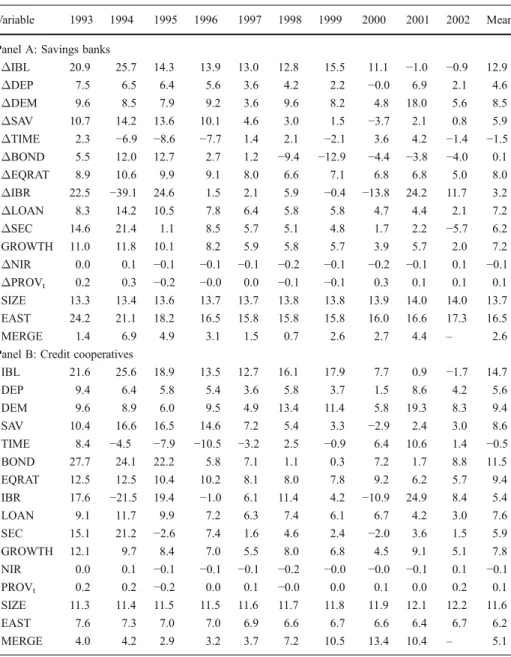
Table 1 reports the cross-sectional means of the percentage changes of absolute balance sheet items and bank characteristics for all banks. Appendix2 provides separate tables for savings banks and credit cooperatives. Panel A includes the variables for all banks by year. Panel B focuses on the evolution of deposit taking by savings banks and credit cooperatives. Panel A shows that the mean deposit growth rate (ΔDEP) is lower than the mean growth rate of interbank liabilities (ΔIBL) in each of the years except 2001 and 2002. The overall arithmetic mean ofΔDEP is 5.4% (per bank-year observation) and 13.8% (per bank-year observation) forΔIBL. When we differentiate by deposit types we find that the evolution of deposits is heterogeneous. Although time deposits exhibit considerable decreases over 1993–1999, savings deposits increase in the first half of the sampling period and decrease in the second half. Demand deposits exhibit higher growth rates (9.4%) than do savings deposits (7.6%) and time deposits (−0.4%).
2
Although most of the bank mergers occur in the cooperative sector, the objectives for mergers are much the same across banks, i.e., they exploit economies of scale and scope, and credit portfolio restructuring. Moreover, the overall mean of MERGE is 5.1% for credit cooperatives (maximum: 13.4% in 2000) and 2.6% for savings banks (maximum: 6.9% in 1994).
3
This variable captures differences between banks with head offices located in some big cities and banks from the rest of Germany. Differentiating all federal states by the average number of inhabitants per square kilometer over the sampling period indicates that city states, which have populations of 2,592 inhabitants/ square kilometer, exhibit a more concentrated population than do non-city states, which have populations of 225 inhabitants/square kilometer. We know that other big cities such as Munich, Frankfurt, and Cologne are not covered. In addition, there is only small number of commercial banks that have their head office in the city states. Since we do not know the headquarters of each bank inside a federal state, we cannot mark all large cities, but only those which are federal states.
On the asset side, we observe a relatively even increase in lending withΔLOAN ranging between 6% and 11% in most of the years. The evolution ofΔIBR tends to be irregular: in some years there are increases in interbank receivables, but decreases in others. In terms of performance,ΔNIR exhibits a negative sign in seven out of 10 years and a negative mean growth rate over the sampling period, indicating a general deterioration of German banks’ net interest income (Organisation for Economic Co-operation and Development2001). We note that the interpretations given above also hold for geometric means of annual growth rates instead of the arithmetic means shown in the rightmost columns. Panel B confirms these developments and is consistent with Fig. 2. These results indicate that there is a considerable fraction of banks in both groups that exhibit negative growth rates in deposits.
Table 1 Summary statistics. This table reports mean percentage changes of absolute balance sheet and income statement items (Panel A), exceptΔNIR andΔPROV which are measured in percentage points. The variables are IBL: interbank liabilities, DEP: deposits from customers, DEM: demand deposits, SAV: savings deposits, TIME: time deposits, BOND: bonds issued by banks, EQRAT: equity over total assets, IBR: interbank receivables, LOAN: total loans to customers, SEC: security holdings, GROWTH: percentage change of total assets, NIR: net interest result, PROV: loan loss provisions, SIZE: total assets, EAST: indicator variable which is one for banks with a head office in eastern Germany, and MERGE: indicator variable that is one for the acquiring bank in the year of a merger or acquisition. Detailed definitions are given in Appendix1.ΔDEP_TA is the first difference in percentage points of the ratio“deposits to total assets”in each group (Panel B)
Panel A: Variables for all banks by year
Variable 1993 1994 1995 1996 1997 1998 1999 2000 2001 2002 Mean ΔIBL 20.7 24.3 17.1 13.4 12.7 14.3 17.5 7.9 0.6 −1.5 13.8 ΔDEP 9.3 6.2 5.9 5.6 3.7 5.7 3.5 1.0 8.3 3.5 5.4 ΔDEM 9.7 8.6 6.6 10.0 4.5 12.7 10.8 5.4 19.6 7.5 9.4 ΔSAV 9.9 15.4 15.5 13.1 6.2 4.9 2.8 −4.2 2.1 1.8 7.6 ΔTIME 7.5 −4.8 −7.5 −9.1 −1.8 2.6 −0.8 5.6 8.7 0.6 −0.4 ΔBOND 20.3 20.7 19.1 5.3 4.5 −2.3 −4.5 2.1 −0.1 2.4 7.6 ΔEQRAT 11.7 11.7 10.1 9.5 7.9 7.8 7.7 8.4 6.5 5.7 8.9 ΔIBR 18.4 −24.1 20.1 −0.1 5.7 10.2 2.6 −11.5 23.8 8.7 4.9 ΔLOAN 9.1 11.7 9.7 7.4 6.3 7.0 6.2 6.3 4.2 2.4 7.4 ΔSEC 15.1 20.7 −1.7 7.4 2.5 4.5 3.8 −0.9 3.5 −0.5 6.1 GROWTH 12.1 9.8 8.7 7.3 5.8 7.6 11.4 4.5 8.5 4.5 8.2 ΔNIR 0.0 0.1 −0.1 −0.0 −0.1 −0.2 −0.0 −0.0 −0.1 0.1 −0.1 ΔPROVt 0.3 0.2 −0.2 0.0 0.1 −0.1 0.0 0.1 0.0 0.2 0.1 SIZE 11.8 11.9 12.0 12.1 12.1 12.2 12.4 12.5 12.6 12.7 12.1 EAST 10.5 9.5 8.6 8.3 8.2 8.2 8.2 8.4 8.6 8.8 8.9 MERGE 3.3 3.8 2.5 2.6 2.6 4.3 6.2 7.7 6.6 – 3.7 # of banks 3,866 3,701 3,616 3,508 3,415 3,232 2,993 2,733 2,518 2,419 2,294
Panel B: Evolution of deposits at savings banks and credit cooperatives by year
Group Variable 1993 1994 1995 1996 1997 1998 1999 2000 2001 2002 Mean
Savings banks ΔDEP 7.3 6.5 6.4 5.6 3.6 4.2 2.3 −0.1 6.9 2.1 4.6
Δ(other liab.) 15.8 22.5 14.2 11.2 10.2 9.6 11.9 9.5 −0.7 −0.7 10.7 ΔDEP_TA −1.8 −2.6 −1.5 −1.1 −1.2 −0.9 −1.8 −2.0 1.2 0.2 −1.2 % ofΔDEP < 0 0.3 11.9 8.4 5.4 13.4 6.1 31.5 62.4 3.2 29.6 16.9 Coope-ratives ΔDEP 9.4 6.4 5.8 5.4 3.6 5.8 3.7 1.5 8.7 4.2 5.5 Δ(other liab.) 21.1 23.9 18.8 11.7 11.5 13.1 14.8 7.6 1.1 0.2 13.6 ΔDEP_TA −1.2 −1.8 −1.4 −0.7 −1.0 −0.7 −1.4 −1.2 1.2 0.2 −0.9 % ofΔDEP < 0 2.4 10.2 8.2 9.4 23.1 15.0 42.3 70.1 6.4 32.2 19.9
To test H4, we calculate the yearly net deposit position of each bank. We note that the surplus and deficit banks switch their net position very infrequently, indicating a robust classification over time. To check the robustness of our results, instead of the year-specific net deposit position we use the mean and median net deposit position over the full sample period to define surplus and deficit banks, which excludes the possibility that banks switch between categories, and obtain similar results.
In the group of credit cooperatives, the relative frequencies are 52% for surplus banks and 48% for deficit banks. In contrast, there are only 12% surplus banks but 88% deficit banks in the savings banks sector. Based on this information, we examine the link between a bank’s net customer position and its interbank position. We find that the net customer position, LOAN minus DEP, is significant and negatively related to its net interbank position. The correlation ranges between −0.70 for savings banks and credit cooperatives and−0.63 for all other banks. Probit models with the net interbank position as a dependent variable and the net customer position and various bank characteristics as explanatory variables, confirm our findings from the univariate correlation analysis. We obtain qualitatively similar results if we analyze the relation between changes of the net positions. These findings imply that the interbank position follows from imbalances in the retail business. The relation between the net customer position and the net interbank position is more pronounced for savings banks and credit cooperatives because they benefit from special relationships with group-central banks.
Our analysis indicates a structural change in the funding structure of retail banks in Germany. It is remarkable that at some banks, deposits from customers are no longer as important for funding as in former times. This change has also taken place in other large countries.
3 Analyzing the impact of declining deposit growth
3.1 Method
To test H1, we analyze how the growth rate of interbank liabilities relates to growth rates of various other funding modes. We control for the individual bank characteristics MERGEt, EASTt, CITYSTATEt, SIZEt, and GROWTH, because we include growth rates of absolute balance sheet items and not ratios. We also add year dummy variables to control for macroeconomic effects and time series trends, using 1993 as our reference year. We cannot include bank-individual loan and deposit interest rates because there is no such micro data set for German banks. The alternative, i.e., calculating average interest rates from interest expenses/income and loan/deposit volume, would be imprecise, because it would presume the same level of interest rates for all kinds of deposits.
According to H1, the growth of interbank liabilities should be negatively related to the growth of deposits from customers in Model 1, that isβ2<0. In all models, we substitute ΔDEP withΔDEM,ΔSAV, andΔTIME to test whether the hypothesis holds for different types of deposits and bank groups. We also include changes in the volume of issued bonds (ΔBOND) and the growth of interbank receivables (ΔIBR) to take into account the evolution of a bank’s net interbank position.
$IBLit¼aþb1$IBRitþb2$DEPitþb3$BONDitþdBank characteristicsit
To test H2, we analyze the impact of changes in interbank receivables, security holdings, and various funding modes on changes in lending to customers. To do so, we use the Model 2. If the bottleneck described by H2 exists, then we would expect a significantly positive coefficientβ3but no significant coefficientsβ1,β2,β4andβ5in Model 2. Ifβ1orβ2are significantly negative and/orβ4orβ5are significantly positive, then a bank’s loan growth is also funded by an asset reconfiguration and/or by non-deposit funding modes, i.e., there is no bottleneck. We cannot carry out a conditional analysis that differentiates between constrained and unconstrained banks because of data limitations. Nonetheless, the aggregate findings for each of the groups have implications for the general importance of this effect.
$LOANit¼aþb1$IBRitþb2$SECitþb3$DEPitþb4$IBLitþb5$BONDit þdBank characteristicsitþmYear dummiestþ"it ð2Þ H3 suggests that a decline of deposits affects a bank’s interest income unfavorably. Therefore, we test whether changes in the funding structure, i.e., the change of the ratio of deposits to interbank liabilities,ΔDEP_IBL, affect changes in the net interest income. To do so, we control for simultaneous changes of the asset structure (ΔLOAN_IBR). If the estimation yields a significantly positive coefficient β1, then our empirical results corroborate H3. In addition, we expect the coefficients β2 and β3 to be significantly positive. We note that the explanatory variables in this model indicate structural changes on the liability and asset side, because they measure the change in the reciprocal importance of two variables.
$NIRit¼aþb1$DEP IBLitþb2$DEP BONDitþb3$LOAN IBRit
þdBank characteristicsitþmYear dummiestþ"it ð3Þ with
ΔDEP IBLt¼ðDEPt=IBLtÞ ðDEPt1=IBLt1Þ
ΔDEP BONDt¼ðDEPt=BONDtÞ ðDEPt1=BONDt1Þ
ΔLOAN IBRt¼ðLOANt=IBRtÞ ðLOANt1=IBRt1Þ:
We test H4 by using univariate Wilcoxon rank sum tests and separately re-estimating Models 1–3 for surplus and deficit banks.
3.2 Results
For Models 1–3, we present results from separate cross-sectional time-series pooled estimations for commercial banks, savings banks, and credit cooperatives.4
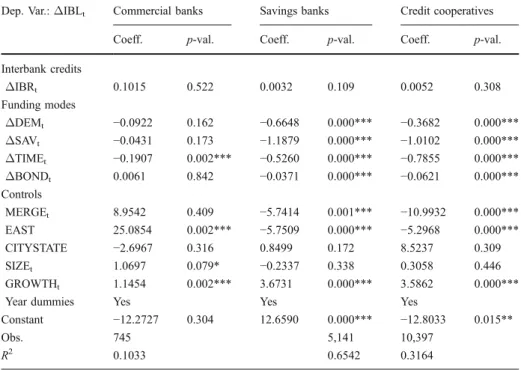
Table2includes results from the estimation of Model 1.
The table shows that DEMt,ΔSAVt,ΔTIMEtare significant and negatively related to changes in interbank liabilities at savings banks and credit cooperatives. The effect is strongest for savings deposits in both groups. We also find a negative coefficient for ΔTIMEtat commercial banks. In terms of goodness-of-fit, the model explains the structural relations for savings banks and credit cooperatives well, and almost as well for commercial banks. These findings represent strong support for H1 for savings banks and credit 4
We also estimate the corresponding fixed and random effects panel models, but do not show the results as they yield outcomes similar to those reported here.
cooperatives, and partially for commercial banks. Moreover,ΔBONDtis significantly and negatively related toΔIBLtbut the economic magnitude of the link is much smaller than in the case of deposits from customers. However, the coefficient ofΔIBRtis not significant, i.e., banks do not simultaneously increase interbank credits and deposits. Instead, a decline in deposits is balanced by an increase in interbank liabilities.
Furthermore, considering the control variables, the coefficient of MERGEt is highly significant for savings banks and credit cooperatives, since most of all bank mergers in Germany happened in these groups. There are various explanations for the negative coefficient of MERGE. This finding is consistent with the fact that the interbank liabilities of the acquirer may be diluted because the target has a smaller volume of interbank liabilities. Moreover, acquiring banks might reduce borrowing from other banks precisely because they get external cash inflows, as well as to comply with regulatory capital requirements when implementing a takeover. The indicator variable EAST is significantly negative for savings banks and credit cooperatives, and significantly positive in case of commercial banks. These results suggest that the reliance on interbank liabilities is smaller for savings banks and credit cooperatives in eastern Germany compared to the same banks in western Germany but the commercial banks in eastern Germany clearly rely more on wholesale funding. The coefficient of CITYSTATE is not significant in any of the three regressions, indicating that if we compare banks from some big cities with the rest of
Table 2 Regression results for interbank liabilities (ΔIBL). Results are based on a cross-sectional time-series pooled estimation with data from the period 1993–2002. The dependent variable is the percentage change of a bank’s absolute volume of interbank liabilities. Explanatory variables are percentage changes in the absolute volume of interbank receivables, funding modes, and control variables. All regressions include year dummies with 1993 as reference year, which are not shown here. We take into account the clustering of observations at the bank level and reportp-values calculated from Huber-White robust standard errors
Dep. Var.:ΔIBLt Commercial banks Savings banks Credit cooperatives Coeff. p-val. Coeff. p-val. Coeff. p-val. Interbank credits ΔIBRt 0.1015 0.522 0.0032 0.109 0.0052 0.308 Funding modes ΔDEMt −0.0922 0.162 −0.6648 0.000*** −0.3682 0.000*** ΔSAVt −0.0431 0.173 −1.1879 0.000*** −1.0102 0.000*** ΔTIMEt −0.1907 0.002*** −0.5260 0.000*** −0.7855 0.000*** ΔBONDt 0.0061 0.842 −0.0371 0.000*** −0.0621 0.000*** Controls MERGEt 8.9542 0.409 −5.7414 0.001*** −10.9932 0.000*** EAST 25.0854 0.002*** −5.7509 0.000*** −5.2968 0.000*** CITYSTATE −2.6967 0.316 0.8499 0.172 8.5237 0.309 SIZEt 1.0697 0.079* −0.2337 0.338 0.3058 0.446 GROWTHt 1.1454 0.002*** 3.6731 0.000*** 3.5862 0.000***
Year dummies Yes Yes Yes
Constant −12.2727 0.304 12.6590 0.000*** −12.8033 0.015**
Obs. 745 5,141 10,397
R2 0.1033 0.6542 0.3164
Germany, then the relation between deposits and interbank liabilities is not different, i.e., the variable cannot sharply discriminate between urban and rural areas. SIZEtis positively related to changes in interbank liabilities at commercial banks, but not for the two other groups. This result indicates stronger cross-sectional differences in the group of commercial banks compared to small local banks. GROWTHt is significantly positive in all groups, showing that an increase in total assets is at least partially funded by an increase in interbank liabilities. Our analysis shows that there is a significantly negative relation between all kinds of deposits from customers and interbank liabilities for savings banks and credit cooperatives, but not for commercial banks.
An alternative explanation for these findings could be based on the link between the
“regional principle” and regional economic activity. The“regional principle” prescribes a particular geographic area in which savings banks are allowed to operate. It also applies to credit cooperatives. Therefore, regional economic activity might lead to a higher share of surplus than deficit banks in certain areas because of the heterogeneous regional patterns of households and industrial clusters. This point is a major difference between these banks and commercial banks since the latter are not subject to geographic constraints.
However, there are several arguments against this alternative explanation. We document a clear decline in deposit taking in all three groups (savings banks, credit cooperatives, and big banks), as shown by Fig. 2. This result rules out that increasing difficulties in mobilizing deposits are due to geographic constraints for savings banks. Moreover, we find an increase in interbank liabilities at the vast majority of savings banks, indicating a general effect and the importance of the two-tier structure within this sector. We obtain significant coefficients for the funding mode variables in the savings banks and cooperative sector although we include the variables EAST and CITYSTATE in all our regression analyses to control for differences in regional economic activity. In unreported analyses by federal state, we confirm that the uncovered structural changes are not unique to certain regions. Furthermore, the distribution of regional economic activity in Germany is relatively homogenous, and, unlike banks’funding modes, it has not much changed over time in the western part of Germany.
Thus, our results support H1 and are consistent with the importance of the two-tier structure for interbank activities in the savings banks and cooperative sector.
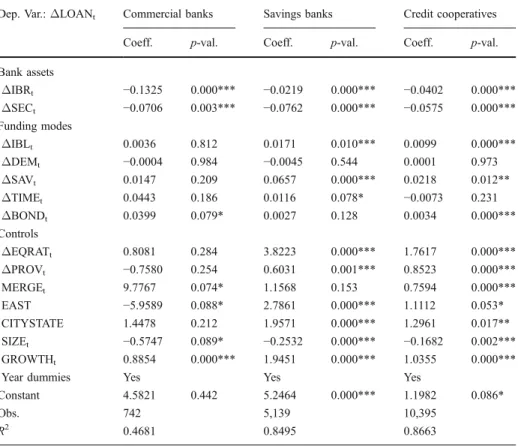
The findings on our test of H2 by using Model 2 are shown in Table3.
We obtain two main results. First, that the growth rates of interbank receivables (ΔIBRt) and security holdings (ΔSECt) are significantly and negatively associated with loan growth (ΔLOANt) for all three groups, providing evidence that there are substitution relations between bank assets.
Second, the growth rates of savings deposits (ΔSAVt) and interbank liabilities (ΔIBLt) have a significantly positive impact on loan growth at savings banks and credit cooperatives. For time deposits, we obtain a significantly positive coefficient only for savings banks. In other words, both deposit taking and borrowing from other banks fund lending to customers. However, demand deposits that are mainly held for payment purposes have no significant impact in either group. In addition, another funding mode,ΔBONDt, is significantly positive for commercial banks and credit cooperatives.
When we examine the control variables, we find that changes of the capital ratio are significantly and positively related toΔLOANtat savings banks and credit cooperatives. Banks must increase their equity if they intend to increase lending and still maintain the same internal and/or regulatory capital ratio. One explanation for why we find a significant effect only for savings banks and credit cooperatives is that these banks are more constrained, because to increase equity, they must retain earnings. This constraint leads to a
relatively strong relation between changes of the capital ratio and lending. In addition, ΔPROVt displays a positive coefficient for savings banks and credit cooperatives, indicating that an increase of loan loss provisioning goes hand in hand with an increase in lending. Moreover, MERGEt, and especially EASTt, exhibit a positive impact on loan growth. However, unlike the results in Table2, CITYSTATE is now highly significant and positive for savings banks and credit cooperatives. This result shows that loan growth at these banks is higher in large cities compared to the rest of Germany, despite the fact that we cannot perfectly discriminate between urban and rural areas. The consistently negative coefficient of SIZEt indicates that larger banks exhibit a lower growth of loans to customers. GROWTHt has a significantly positive impact on ΔLOANt, which is also economically significant.
Although we find thatΔSAVt, and partly ΔTIMEt, have a positive influence on loan growth, we cannot conclude that these empirical findings provide support for H2. Such a conclusion would ignore the fact that there is a significantly negative link between growth rates of banks assets (ΔLOANtcompared toΔIBRtorΔSECt) and a significantly positive Table 3 Regression results for loans to customers (ΔLOAN). Results are based on a cross-sectional time-series pooled estimation with data from the period 1993–2002. The dependent variable is the percentage change of a bank’s absolute volume of loans to customers. Explanatory variables are percentage changes in the absolute volume of bank assets, funding modes, and control variables. All regressions include year dummies with 1993 as reference year, which are not shown here. We take into account the clustering of observations at the bank level and reportp-values calculated from Huber-White robust standard errors Dep. Var.:ΔLOANt Commercial banks Savings banks Credit cooperatives
Coeff. p-val. Coeff. p-val. Coeff. p-val. Bank assets ΔIBRt −0.1325 0.000*** −0.0219 0.000*** −0.0402 0.000*** ΔSECt −0.0706 0.003*** −0.0762 0.000*** −0.0575 0.000*** Funding modes ΔIBLt 0.0036 0.812 0.0171 0.010*** 0.0099 0.000*** ΔDEMt −0.0004 0.984 −0.0045 0.544 0.0001 0.973 ΔSAVt 0.0147 0.209 0.0657 0.000*** 0.0218 0.012** ΔTIMEt 0.0443 0.186 0.0116 0.078* −0.0073 0.231 ΔBONDt 0.0399 0.079* 0.0027 0.128 0.0034 0.000*** Controls ΔEQRATt 0.8081 0.284 3.8223 0.000*** 1.7617 0.000*** ΔPROVt −0.7580 0.254 0.6031 0.001*** 0.8523 0.000*** MERGEt 9.7767 0.074* 1.1568 0.153 0.7594 0.000*** EAST −5.9589 0.088* 2.7861 0.000*** 1.1112 0.053* CITYSTATE 1.4478 0.212 1.9571 0.000*** 1.2961 0.017** SIZEt −0.5747 0.089* −0.2532 0.000*** −0.1682 0.002*** GROWTHt 0.8854 0.000*** 1.9451 0.000*** 1.0355 0.000***
Year dummies Yes Yes Yes
Constant 4.5821 0.442 5.2464 0.000*** 1.1982 0.086*
Obs. 742 5,139 10,395
R2 0.4681 0.8495 0.8663
influence ofΔIBL andΔBONDton loan growth. Thus, even if deposits are declining in relative importance, banks have two further options to avoid a reduction in lending. They can reconfigure the asset side, which seems to be the typical reaction of commercial banks. Or, in a reaction that is typical for savings banks and credit cooperatives, banks can rely increasingly on non-deposit funding modes to fill the funding gap. Given these results, we must reject Hypothesis H2. We do not observe a bottleneck effect, because there is no negative impact on lending due to a decline of deposits from customers.
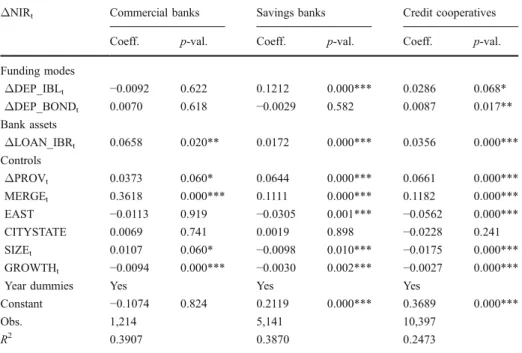
To test H3, we investigate if and how structural changes in funding modes affect bank profitability as measured by changes of the ratio of net interest income to total assets, calculated before write-offs, depreciation, and loan loss provisions. Given the context of this study, we focus on the net interest result because this measure depends on a bank’s funding mix, ceteris paribus. We control for the influence of default risk on loan rates and the net interest result by including the change in loan loss provisions (ΔPROV).
Table 4 shows that the ratio of deposits from customers to interbank liabilities (ΔDEP_IBLt) has a highly significant and positive influence on the ΔNIRt of savings banks. In other words, the higher the share of deposits from customers relative to interbank liabilities, the more profitable a savings bank.5
We find qualitatively the same evidence for credit cooperatives, but the effect is weaker in terms of statistical and economic significance. Moreover, changes of the ratio of loans to customers to interbank receivables (ΔLOAN_IBRt) exhibit a significantly positive impact onΔNIRtfor all bank groups. This effect is strongest for commercial banks and lowest for savings banks. One explanation for this finding may be that because commercial banks have a more risk-sensitive loan pricing policy, they benefit from higher margins in loan rates than do savings banks. Furthermore, for credit cooperatives, structural shifts between deposits and bonds (ΔDEP_BONDt) have a significant, but small, profitability impact.
Among the control variables,ΔPROV displays a significantly positive coefficient in all three groups. If a bank faces an increase of the default risk in lending (for which we use the increase in loan loss provisions as our proxy), then loan rates will go up as well but deposit rates will typically exhibit either a very slow increase or no increase at all. This effect explains the short-run increase in the net interest result. The coefficient of MERGEt is significantly positive for all groups and ranges from 0.11 to 0.36. This result indicates an additional net interest income for the acquirer in the year of a takeover. Alternatively, acquiring banks might have funded the transaction with liquid assets that are replaced by a more profitable loan portfolio, increasing the relative net interest result. The variables EASTt (for savings banks and credit cooperatives only) and GROWTHt display a significantly negative coefficient, but CITYSTATEt has no significant influence. SIZEt has a negative coefficient for savings banks and credit cooperatives, which indicates the higher share of expensive wholesale funding relative to less expensive deposits from customers at large banks in these groups, and a weakly positive coefficient for commercial banks, which might be due to the higher loan margins realized by these banks.
Consistent with Hackethal (2004), we find evidence in favor of H3 for German savings banks and a weaker but still significant effect for credit cooperatives: a decrease in deposits 5
However, this finding holds only for the net interest result, not for the overall profitability of savings banks. In general, there may be two contrarian effects. On the one hand, it is plausible to assume that a savings bank pushes its customers to invest, for example, in mutual funds to generate income that may reduce the growth of deposits. On the other hand, if the same bank has a steady growth in loan demand, it must find alternative funding modes that might turn out to be more expensive than the previous ones. We also note that during our sampling period, the average net interest result of savings banks is five times larger than the net non-interest result.
from customers is compensated for by an increase in interbank borrowing, which unfavorably affects the net interest result. We note that our regression results are based on data from 1992–1993, which were years with relatively high interest rates and an inverse term structure that is shifting to a normal one, as well as years with relatively low interest rates and a normal term structure. The year dummies, which are not shown in Table 4, exhibit significantly negative coefficients for savings banks and credit cooperatives in nearly all of the years. Accordingly, a decrease of the interest income from security holdings may be an additional explanation for the observed decrease of the net interest income. The significance and the magnitude of the year dummies reflect the different impact of the level and term structure of interest rates on each group that is caused by different asset and funding structures.
We empirically test H4 by adding another dimension, the net deposit position with customers to our analysis. Table5reports the median growth rates of funding modes and bank assets for deficit and surplus banks by group, as well as results from nonparametric rank sum tests.
The analysis in Table 5 provides additional insights. First, demand deposits grow steadily at relative high rates in all groups and they do not differ significantly between surplus and deficit banks. Hence, demand deposits are not in general decline and represent a relatively stable source of funds. Second, that in both groups the growth of savings and time
Table 4 Regression results for the net interest result (ΔNIR). Results are based on a cross-sectional time-series pooled estimation with data from the period 1993–2002. The dependent variable is the change of a bank’s net interest result (relative to total assets). Explanatory variables are changes in the ratio of deposits-to-interbank liabilities, deposits-to-bonds, loans to customers-deposits-to-interbank receivables, and control variables. All regressions include year dummies with 1993 as reference year, which are not shown here. We take into account the clustering of observations at the bank level and reportp-values calculated from Huber-White robust standard errors
ΔNIRt Commercial banks Savings banks Credit cooperatives Coeff. p-val. Coeff. p-val. Coeff. p-val. Funding modes ΔDEP_IBLt −0.0092 0.622 0.1212 0.000*** 0.0286 0.068* ΔDEP_BONDt 0.0070 0.618 −0.0029 0.582 0.0087 0.017** Bank assets ΔLOAN_IBRt 0.0658 0.020** 0.0172 0.000*** 0.0356 0.000*** Controls ΔPROVt 0.0373 0.060* 0.0644 0.000*** 0.0661 0.000*** MERGEt 0.3618 0.000*** 0.1111 0.000*** 0.1182 0.000*** EAST −0.0113 0.919 −0.0305 0.001*** −0.0562 0.000*** CITYSTATE 0.0069 0.741 0.0019 0.898 −0.0228 0.241 SIZEt 0.0107 0.060* −0.0098 0.010*** −0.0175 0.000*** GROWTHt −0.0094 0.000*** −0.0030 0.002*** −0.0027 0.000***
Year dummies Yes Yes Yes
Constant −0.1074 0.824 0.2119 0.000*** 0.3689 0.000***
Obs. 1,214 5,141 10,397
R2 0.3907 0.3870 0.2473
deposits is consistently lower at deficit banks than at surplus banks. The growth rates of time deposits even have a negative sign at savings banks and credit cooperatives with a funding deficit. Third, the analysis shows that the growth rates of interbank liabilities are significantly higher at deficit banks than at surplus banks. For example, it is 11.03% at savings banks with a deposit deficit compared to 7.83% at savings banks with a deposit surplus while the opposite is consistently found for interbank receivables. These findings represent direct evidence in favor of H4 because changes in deposit taking and interbank activities are stronger at deficit banks than at surplus banks. The difference between surplus and deficit banks is statistically and economically significant for growth rates of savings and time deposits, but there is no such difference in demand deposits, indicating that the function of deposits matters.
We also examine the question of if and how institutional features in the three sectors of the German banking system matter, and specifically whether the way in which retail banks respond to the decline in deposit taking relates to the organizational structure of the three sectors. Two important features that differentiate the savings banks and cooperative sector from commercial banks are the regional principle and the two-tier structure. Most of Germany’s commercial banks, particularly the big banks, operate nationwide and do not have group-central banks. Thus, we compare whether the evolution of the net interbank position differs between the savings banks sector and the big banks.
Figure3illustrates two important findings. First, that the absolute net interbank position of savings banks, which is defined by the black line, and Landesbanks, the dark gray line, are negatively related, indicating that savings banks partially compensate for the decline in deposit taking by borrowing from Landesbanks. The correlation of the time series in Fig.3
is −0.86. We obtain a similar value if we compare the ratio of the net interbank position over total assets for savings banks and Landesbanks. Second, that the net interbank position of big banks, depicted by the light gray line, which operate nationwide and have no particular money center bank in their sector, develops in a way that is similar to that of savings banks. This finding indicates that all retail banks respond to the decline in deposit taking by either reducing interbank lending and/or increasing interbank borrowing. Thus, the type of the reaction of retail banks is not only a consequence of sector-specific institutional features such as the regional principle and the existence of group-central banks.
Table 5 Comparison of banks’funding modes and assets by net deposit position. This table reports changes in funding modes and bank assets for savings banks and credit cooperatives differentiated by the net deposit position, i.e., deficit banks compared to surplus banks
Net deposit position Savings banks Credit cooperatives
Deficit Surplus Deficit Surplus
Funding modes ΔDEM 6.68 6.64 7.16 7.31 ΔSAV 4.16 7.68*** 5.04 7.16*** ΔTIME −2.21 0.19*** −2.19 −0.78*** ΔIBL 11.03 7.83*** 10.73 8.55*** Bank assets ΔIBR 2.29 9.88*** −1.48 10.14*** ΔLOAN 5.43 6.03** 6.04 5.64***
*** , **, * indicate significant differences at the 0.01, 0.05, and 0.10-level based on a non-parametric Wilcoxon rank sum test
The figure also shows that there is a structural change, in the sense that interbank funding has gained considerably in importance since the early to mid 1990s. These findings are consistent with the view that we observe an increasing specialization between retail banks and wholesale banks, which lengthens the intermediation chain within the banking sector. 3.3 Tests of robustness
To study the robustness of our results, we first re-estimate Models 1–3 with balance-sheet items deflated by the German CPI and GDP, i.e., with real variables. We note that the impact of inflation during 1992–2002 is low, since the results from the estimation with deflated variables are similar. Since neither the significance nor the signs of all coefficients change, and because the magnitude of the coefficients varies in a small range of ±0.02, we do not report details here.
Second, to check whether the results are not driven by our measurement technique, we use a different way to transform the data. Instead of taking the percentage changes of absolute balance sheet items, we repeat the multivariate tests of H1 and H2 with first differences of ratios to shed further light on the substitution patterns. We do not repeat the test of H3, because this analysis is already carried out in first differences. Table6summarizes the estimation results. In Table6, Panel A corresponds to Table2and Panel B to Table3. In Table6, Panel A confirms our previous results for H1 for savings banks and credit cooperatives. The coefficients of the funding modes are significantly negative and slightly below one for these banks, indicating close substitution patterns. In contrast to Table2, the same coefficients for commercial banks are now significantly negative, but the R2 of the regression model is substantially lower compared to the other groups. The main reason for
-250 -200 -150 -100 -50 0 50 100 1970-0 1 1972 -07 1975 -01 1977-0 7 1980-0 1 1982 -07 1985 -01 1987-0 7 1990 -01 1992 -07 1995 -01 1997-0 7 2000 -01 2002 -07 Billion EUR
big banks Landesbanks savings banks
Fig. 3 Absolute net interbank position by bank type (in billion EUR). The figure shows the time series of aggregate from the Deutsche Bundesbank for big banks, Landesbanks, and savings banks during the period from January 1970 to December 2002. The net interbank position is defined as the difference between interbank lending and borrowing
Table 6 Regression results based on balance sheet ratios. Results are based on a cross-sectional time-series pooled estimation with data from the period 1993–2002. The dependent variables are first differences of interbank liabilities-to-total assets (Panel A) and loans-to-total assets (Panel B). Explanatory variables are first differences of bank asset and funding mode ratios and control variables. Regressions include year dummies with 1993 as reference year, which are not shown here. We consider the clustering of observations at the bank level and reportp-values calculated from Huber-White robust standard errors
Dep. Var.:ΔIBL_TAt Commercial banks Savings banks Credit cooperatives Coeff. p-val. Coeff. p-val. Coeff. p-val. Panel A: Results for interbank liabilities relative to total assets (ΔIBL_TAt)
Interbank credits ΔIBR_TAt 0.1242 0.001*** 0.0048 0.258 0.0094 0.003*** Funding modes ΔDEM_TAt −0.7761 0.000*** −0.9694 0.000*** −0.8777 0.000*** ΔSAV_TAt −0.7569 0.000*** −0.9776 0.000*** −0.8916 0.000*** ΔTIME_TAt −0.7089 0.000*** −0.9379 0.000*** −0.8755 0.000*** ΔBOND_TAt −0.7440 0.000*** −0.9481 0.000*** −0.8965 0.000*** Controls MERGEt −2.7991 0.057* −0.3312 0.011** −0.4513 0.000*** EAST −0.2368 0.899 −0.3938 0.000*** −0.0033 0.907 CITYSTATE 0.1674 0.506 0.1821 0.119 0.5200 0.226 SIZEt 0.0143 0.739 0.1005 0.314 −0.0231 0.055* GROWTHt 0.0998 0.000*** 0.0113 0.001*** 0.0143 0.000***
Year dummies Yes Yes Yes
Constant −0.9827 0.170 −0.2349 0.104 −0.2289 0.110
Obs. 745 5,141 10,397
R2 0.5130 0.8974 0.8452
Panel B: Results for loans to customers relative to total assets (ΔLOAN_TAt) Bank assets ΔIBR_TAt −0.7685 0.000*** −0.7358 0.000*** −0.8097 0.000*** ΔSEC_TAt −0.7243 0.000*** −0.7387 0.000*** −0.8116 0.000*** Funding modes ΔIBL_TAt 0.5228 0.000*** 0.1899 0.000*** 0.3697 0.000*** ΔDEM_TAt 0.5552 0.000*** 0.2008 0.000*** 0.3159 0.000*** ΔSAV_TAt 0.3922 0.000*** 0.2492 0.000*** 0.3543 0.000*** ΔTIME_TAt 0.5604 0.000*** 0.2341 0.000*** 0.3317 0.000*** ΔBOND_TAt 0.4704 0.000*** 0.2761 0.000*** 0.3586 0.000*** Controls ΔEQRATt 0.5042 0.000*** 0.6314 0.000*** 0.2136 0.019** ΔPROVt 0.0518 0.651 0.2788 0.000*** 0.0998 0.051* MERGEt 1.4696 0.099* 0.0026 0.988 0.1037 0.067* EAST 0.7062 0.488 1.1596 0.000*** 1.3488 0.000*** CITYSTATE 0.1347 0.418 0.4863 0.000*** 0.0827 0.398 SIZEt −0.0607 0.095* −0.0567 0.000*** −0.0308 0.000*** GROWTHt −0.0199 0.031** 0.0062 0.184 −0.0044 0.012**
these findings is that bank size varies a lot for commercial banks and very little for the other groups. Therefore, normalizing the changes in funding modes by total assets leads to different results for these banks. Moreover, beyond the cross-sectional variation in bank size, commercial banks are also more likely to issue bonds, and to specialize in wholesale banking and in mortgage lending. Thus, they might begin to consider traditional deposit taking as a secondary business, which leads to a less pronounced substitution patterns for this group.
In Panel B, there are significantly negative coefficients for interbank receivables and security holdings, but positive coefficients for the interbank liabilities and deposit items. Similar to the analysis in Table 3, these results represent no support for H2 because we observe a strong negative link on the asset side in all groups, indicating substitution effects that offset the positive link between deposit taking and lending.
Third, to test for intertemporal dependencies and endogeneity problems between balance-sheet items, we include lags of the dependent and explanatory variables in the models. The estimation leads to slightly higher values for the adjustedR2for all models. For Model 1, the coefficients ofΔDEMt,ΔSAVt,ΔTIMEt, andΔBONDtdo not change in terms of significance and only a little in magnitude, indicating a robust negative impact on ΔIBLt. Moreover,ΔDEMt-1andΔSAVt-1do not exhibit significant coefficients for either group. For ΔTIMEt-1, we obtain positive but economically small coefficients for savings banks and credit cooperatives that are significant at the 1% level. For Model 2, if we include lags of the dependent and explanatory variables, then we find estimation results for the impact on ΔLOANtsimilar to those in Table3. The coefficients ofΔIBLt-1at savings banks and credit cooperatives are significantly positive, showing that in these groups, loan growth is partially funded by an increase in interbank liabilities. This finding is additional evidence against the bottleneck theory in H2. When we test Model 3, we confirm our main finding that the coefficient ofΔDEP_IBLthas a strong positive impact onΔNIRtfor savings banks. In addition, we find a significantly positive but economically small coefficient of ΔDEP_IBLt-1 for savings banks and credit cooperatives, which further supports H3. Thus, we conclude that our basic models are robust to the consideration of intertemporal dependencies because our main findings hold in an extended model specification.
Finally, we re-estimate Models 1–3 for deficit and surplus banks separately. Doing so makes it possible for us to study the robustness of previous findings for H4. For Model 1, we obtain a far better fit for deficit banks (R2=0.59) than for surplus banks (R2=0.26). This result is consistent with the highestR2for savings banks for Model 1, because this sector exhibits the highest share of deficit banks. Moreover, the coefficient ofΔSAVtbecomes significantly negative for commercial banks with funding deficits. For Model 2, we do not find noteworthy differences to the basic model estimation results shown in Table3. Our re-estimation of Model 3 for deficit banks uncovers a significantly positive impact of ΔDEP_IBLtonΔNIRtin all groups. For surplus banks, the same coefficient is significant Table 6 (continued)
Dep. Var.:ΔIBL_TAt Commercial banks Savings banks Credit cooperatives Coeff. p-val. Coeff. p-val. Coeff. p-val. Constant 0.5566 0.401 1.5348 0.000*** 0.4821 0.000***
Obs. 742 5,139 10,395
R2 0.7091 0.7589 0.8049
and positive only for savings banks. These results are different from our earlier findings for H3: we observe a negative impact of changes of deposits on the net interest result at deficit banks in all groups. However, for savings banks, the impact exists even at surplus banks. This finding corroborates the evidence for H3 reported in Section3.2. We note that these results for Germany are consistent with the findings on bank profitability in Eastern Europe (Dinger and von Hagen2005).
4 Conclusions
In this paper, we investigate the structural changes in banks’ funding modes and the implications for lending to customers and the effect on bank profitability. Our empirical evidence is based on a micro data set for all German banks that we obtain from the Deutsche Bundesbank for the period 1992–2002.
First, we find that growth of interbank liabilities is negatively related to the growth of deposits from customers at savings banks and credit cooperatives. The effect is strongest at savings banks. Thus, we provide empirical evidence for a structural change on the liability side of these banks’balance sheets. This finding indicates an increasing specialization of retail and wholesale banks in the same sector, and it is consistent with an overall lengthening of the intermediation chain and with financial deepening of the economy (King and Levine1993). Banks facing a funding deficit become net interbank borrowers, while others that benefit from a stable funding surplus become net interbank lenders.
Second, we do not detect a negative impact of the relative decline in deposits on lending to customers. Instead, lending slightly gains in relative importance over time.
Third, the decreasing ability of banks to collect deposits from customers and the substitution of deposits by interbank liabilities represents one explanation for the declining net interest result for German savings banks and other retail banks with a funding deficit. The implications of our analysis are first, that the example of Germany supports the view that the function of deposits matters (Merton1995). On the one hand, following demand-side arguments, checking accounts are unlikely to be affected by the structural change because these products are unique means of payment (Kashyap et al.2002; Bossone2001). Demand deposits are provided exclusively by banks and represent a significant feature of banks’ specialness. Supply-side arguments suggest that demand deposits and checking accounts provide banks with proprietary information that can be used for monitoring borrowers (Mester et al.2007; Norden and Weber2010). Consequently, there are liquidity and informational synergies between deposit taking and lending. On the other hand, banks, non-bank financial intermediaries, and financial markets also offer financial products with an investment function. Our data indicate that savings deposits steadily decrease in relative importance, which leads to structural changes in bank funding modes and to a lengthening of the intermediation chain for investment products. Second, given the relative change of funding structures and the simultaneous growth in lending, there is a strategic need for alternative funding modes for retail banks. Relying on demand deposits is clearly not sufficient in the long run, and wholesale funding has its own limitations (e.g., Demirgüç-Kunt and Huizinga2009; Huang and Ratnovski2009), as illustrated by the market freeze during the financial crisis of 2007–2009. More flexible rules for bond and commercial paper issuances, as well as asset securitization, might be ways to deal with strategic imbalances between the lending and deposit taking of surplus and deficit banks. Third, the structural lengthening of the intermediation chain implies that financial intermediaries have become more connected, which has implications for financial deepening and growth of the
economy but also increases the risk of contagion effects. Therefore, we believe that central banks, financial markets- and bank supervisors should carefully monitor the evolution of domestic and international wholesale markets and its impact on systemic liquidity and financial stability.
Acknowledgments We are grateful to the editor Haluk Ünal and an anonymous referee for helpful comments. In addition, we thank Hans Degryse, Ralf Elsas, Daniel Foos, Hendrik Hakenes, Peter Nippel, Steven Ongena, Zacharias Sautner, participants at the 13th Annual Meeting of the German Finance Association in Oestrich-Winkel (October 2006), 10th Symposium on Finance, Banking, and Insurance in Karlsruhe (December 2005), participants at the Banking Workshop in Münster (July 2005), and research workshop participants from the Centre for European Economic Research, the Deutsche Bundesbank, and the Goethe University Frankfurt/Main for useful suggestions and discussions. Finally, we are grateful to the Deutsche Bundesbank, in particular Heinz Herrmann and Fred Ramb, for the data access.
Open Access This article is distributed under the terms of the Creative Commons Attribution Noncommercial License which permits any noncommercial use, distribution, and reproduction in any medium, provided the original author(s) and source are credited.
Appendix 1
Table 7 Variable categories and definitions. TheΔ-variables and GROWTH are percentage changes of absolute balance items (exceptΔNIR andΔPROV which are measured in percentage points)
Variable category Variable Definition Units
Funding modes ΔIBL Interbank liabilities (deposits from banks) %
ΔDEP Deposits from customers %
ΔDEM Demand deposits from customers %
ΔSAV Savings deposits from customers %
ΔTIME Time deposits from customers %
ΔBOND Bonds %
Bank assets ΔIBR Interbank receivables (credits to banks) %
ΔLOAN Loans to customers %
ΔSEC Securities holdings %
Bank performance ΔNIR (Net interest income)/(total assets) Percentage points Net interest income = Interest income from
lending, money market transactions, and fixed-income securities—interest expenses on deposits and securities (not included: write-offs, loan loss provisions)
Bank characteristics ΔPROVt Net change in loan loss provisions/(total assets) Percentage points ΔEQRAT Bank capital/(total assets) %
MERGE One if bank is involved in a merger as an acquirer, zero otherwise
Dummy EAST One if bank’s head office is located in
Eastern Germany, zero otherwise
Dummy CITYSTATE One if bank’s head office is located in
Berlin, Hamburg, or Bremen, zero otherwise
Dummy
SIZE Log (total assets) Thousands of EUR
Appendix 2
References
Allen F, Gale D (2000) Comparing financial systems. MIT, Cambridge
Allen F, Santomero AM (2001) What do financial intermediaries do? J Bank Financ 25:271–294 Berlin M, Mester LJ (1999) Deposits and relationship lending. Rev Financ Stud 12:579–607
Table 8 Descriptive statistics by year and group. TheΔ-variables and GROWTH are percentage changes of absolute balance sheet items (exceptΔNIR andΔPROV which are measured in percentage points) Variable 1993 1994 1995 1996 1997 1998 1999 2000 2001 2002 Mean Panel A: Savings banks
ΔIBL 20.9 25.7 14.3 13.9 13.0 12.8 15.5 11.1 −1.0 −0.9 12.9 ΔDEP 7.5 6.5 6.4 5.6 3.6 4.2 2.2 −0.0 6.9 2.1 4.6 ΔDEM 9.6 8.5 7.9 9.2 3.6 9.6 8.2 4.8 18.0 5.6 8.5 ΔSAV 10.7 14.2 13.6 10.1 4.6 3.0 1.5 −3.7 2.1 0.8 5.9 ΔTIME 2.3 −6.9 −8.6 −7.7 1.4 2.1 −2.1 3.6 4.2 −1.4 −1.5 ΔBOND 5.5 12.0 12.7 2.7 1.2 −9.4 −12.9 −4.4 −3.8 −4.0 0.1 ΔEQRAT 8.9 10.6 9.9 9.1 8.0 6.6 7.1 6.8 6.8 5.0 8.0 ΔIBR 22.5 −39.1 24.6 1.5 2.1 5.9 −0.4 −13.8 24.2 11.7 3.2 ΔLOAN 8.3 14.2 10.5 7.8 6.4 5.8 5.8 4.7 4.4 2.1 7.2 ΔSEC 14.6 21.4 1.1 8.5 5.7 5.1 4.8 1.7 2.2 −5.7 6.2 GROWTH 11.0 11.8 10.1 8.2 5.9 5.8 5.7 3.9 5.7 2.0 7.2 ΔNIR 0.0 0.1 −0.1 −0.1 −0.1 −0.2 −0.1 −0.2 −0.1 0.1 −0.1 ΔPROVt 0.2 0.3 −0.2 −0.0 0.0 −0.1 −0.1 0.3 0.1 0.1 0.1 SIZE 13.3 13.4 13.6 13.7 13.7 13.8 13.8 13.9 14.0 14.0 13.7 EAST 24.2 21.1 18.2 16.5 15.8 15.8 15.8 16.0 16.6 17.3 16.5 MERGE 1.4 6.9 4.9 3.1 1.5 0.7 2.6 2.7 4.4 – 2.6
Panel B: Credit cooperatives
IBL 21.6 25.6 18.9 13.5 12.7 16.1 17.9 7.7 0.9 −1.7 14.7 DEP 9.4 6.4 5.8 5.4 3.6 5.8 3.7 1.5 8.6 4.2 5.6 DEM 9.6 8.9 6.0 9.5 4.9 13.4 11.4 5.8 19.3 8.3 9.4 SAV 10.4 16.6 16.5 14.6 7.2 5.4 3.3 −2.9 2.4 3.0 8.6 TIME 8.4 −4.5 −7.9 −10.5 −3.2 2.5 −0.9 6.4 10.6 1.4 −0.5 BOND 27.7 24.1 22.2 5.8 7.1 1.1 0.3 7.2 1.7 8.8 11.5 EQRAT 12.5 12.5 10.4 10.2 8.1 8.0 7.8 9.2 6.2 5.7 9.4 IBR 17.6 −21.5 19.4 −1.0 6.1 11.4 4.2 −10.9 24.9 8.4 5.4 LOAN 9.1 11.7 9.9 7.2 6.3 7.4 6.1 6.7 4.2 3.0 7.6 SEC 15.1 21.2 −2.6 7.4 1.6 4.6 2.4 −2.0 3.6 1.5 5.9 GROWTH 12.1 9.7 8.4 7.0 5.5 8.0 6.8 4.5 9.1 5.1 7.8 NIR 0.0 0.1 −0.1 −0.1 −0.1 −0.2 −0.0 −0.0 −0.1 0.1 −0.1 PROVt 0.2 0.2 −0.2 0.0 0.1 −0.0 0.0 0.1 0.0 0.2 0.1 SIZE 11.3 11.4 11.5 11.5 11.6 11.7 11.8 11.9 12.1 12.2 11.6 EAST 7.6 7.3 7.0 7.0 6.9 6.6 6.7 6.6 6.4 6.7 6.2 MERGE 4.0 4.2 2.9 3.2 3.7 7.2 10.5 13.4 10.4 – 5.1