Classification of Diabetes patient by using Data
Mining Techniques
Nidhi
1, Mukesh Kumar
2, Latika Kakkar
3Chitkara University School of Engineering and Technology, Chitkara University, Himachal Pradesh, India. [email protected] , [email protected]
Abstract - Nowadays, Healthcare sector data are enormous, composite and diverse because it contains a data of different types and getting knowledge from that data is essential. So for this purpose, data mining techniques may be utilized to mine knowledge by building models from healthcare dataset. At present, the classification of diabetes patients has been a demanding research confront for many researchers. For building a classification model for a diabetes patient, we used four different classification algorithms such as decision tree (J48), PART, MultilayerPerceptron and NaiveBayes for diabetes patient dataset which is further taken from National Institute of Diabetes and Digestive and Kidney Diseases. The main objective of this work is to classify that whether a patient is tested_positive or tested_negative for diabetes, based on some diagnostic measurements integrated into the dataset. Keywords: Diabetes patient Dataset, Classification algorithm, RandomForest, NaiveBayes
I.
INTRODUCTION
Data Mining is the known for searching in a large amount of data to mine hidden patterns. Classification algorithms are important parts of data mining. Nowadays, Healthcare sector data are enormous, composite and diverse because it contains data of different types and getting knowledge from that is essential. So for this purpose, data mining techniques may be utilized. Data mining can be used to extract knowledge by creating models from healthcare data such as diabetic patient’s dataset. Classification algorithms are data mining tools that map items into a collection of predefined classes. The classification algorithm plays a crucial role in the analysis of healthcare datasets. Medical diagnosis is dilemmas that are difficult by several factors and affect all human ability, including impulse and unintentional. Diabetes mellitus frequently referred as diabetes, is a situation caused by a decrease fabrication of insulin and because of this, glucose levels in the blood is going to be rise.
Saudi Arabia faces financial challenges due to frequency of diabetes patients. Now the Ministry of Healthcare sector in Saudi Arabia and Institute for Health Metrics and Assessment conducted the burden evaluation based on the direct cost of diabetes from the Integrated Health Information System [2] in 2014. The data mining algorithms assist healthcare researchers to mine knowledge from huge and composite healthcare database. With the maturity of information technology, data mining field is building a priceless involvement to diabetes research, leading to better healthcare, supporting decision-making, and improving disease management [3]. Can you create a
machine learning model to accurately predict if patients have diabetes in the dataset or not?
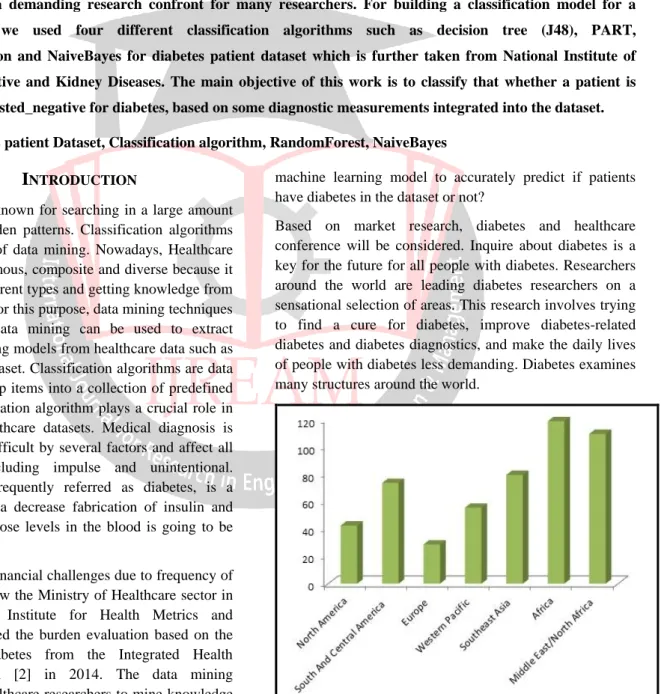
Based on market research, diabetes and healthcare conference will be considered. Inquire about diabetes is a key for the future for all people with diabetes. Researchers around the world are leading diabetes researchers on a sensational selection of areas. This research involves trying to find a cure for diabetes, improve diabetes-related diabetes and diabetes diagnostics, and make the daily lives of people with diabetes less demanding. Diabetes examines many structures around the world.
Figure 1: World Diabetes case expected to jump 55% by 2035
II.
LITERATURE REVIEW
Diabetes is a collection of infections that result high blood sugar. Diabetes is types of disease which increase glucose level in blood. Glucose in our blood comes from diets we take daily. Without sufficient insulin, glucose stays in our blood. Sometimes glucose level is higher than normal in human body but not sufficient to be called as diabetes. But highest glucose in human blood can cause big problems. High glucose level in blood can hurt eyes, kidneys, nerves, heart disease, and stroke. Pregnant women may also refer to diabetes as gestational diabetes. The authors T Daghistani, R Alshammari (2016) in his research paper titled "Diagnosis of Diabetes by Applying Data Mining Classification Techniques, Comparison of Three Data Mining Algorithms" shows that the designs of classifying models for diabetic diagnosis have a dynamic vicinity of researcher since last decade. Most of the models found in the literature are based on classification algorithms. In this study, real health records were calm from MNGHA database which further containing eighteen different attributes. The three different classification algorithms, SOM, C4.5 and RandomForest, were simulated to produce classifier model to classify diabetic patients with real health records [4]. The authors S Lowanichchai, S Jabjone, T Puthasimma, (2012) in his research paper titled ”Knowledge-based DSS for an Analysis Diabetes of Elder using Decision Tree”. In his research conclusion they found that RandomTree classification algorithm has the maximum accuracy up to 99.60% as compared to NBTree classification algorithm which has minimum accuracy 70.60%. [5]. The authors Y Guo, G Bai, Y Hu (2010) in his research paper titled, "Using Bayes Network for Prediction of Type-2 Diabetes". In his result they said that getting knowledge from healthcare databases is essential to formulate an effective medical diagnosis. They used dataset of PIMA database for their implementation in WEKA. They implemented NaiveBayes classification algorithm to classify a model with the highest accuracy up to 72.30% [6].
After analyzing some paper on the classification of diabetes patient’s dataset which is further taken form PIMA dataset, we found the maximum accuracy is 72.30% and need to make some improvement in the classifying model with NaiveBayes.
1. Dataset Description and Techniques used for Classification
The Diabetes dataset used for classification was PIMA dataset which is further collected by the National Institute of Diabetes and Digestive and Kidney Diseases. This diabetes patient’s dataset contains 768 records having eight attributes. The main objectives of this work on diabetes
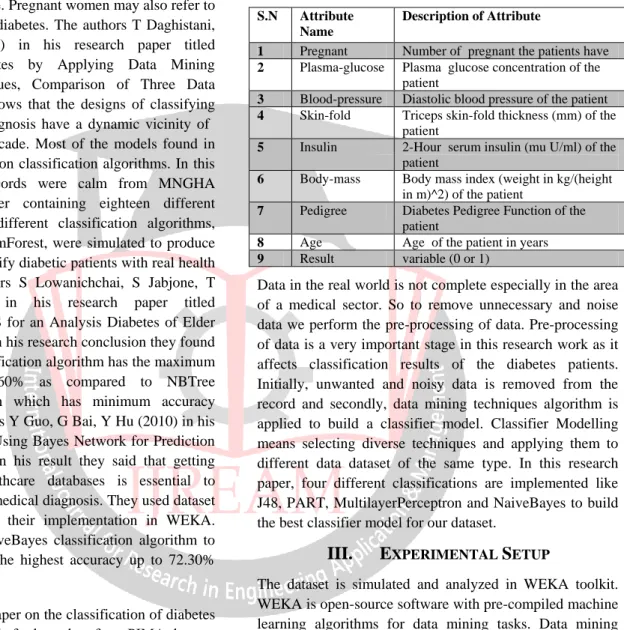
dataset are to classification whether a patient is diabetes or not, based on firm diagnostic measurements integrated in the dataset. In this dataset particularly, patients are females having twenty-one years of age. We are taking this dataset from https://www.kaggle.com/uciml/pima-indians-diabetes-database. Table-1 below gives us all the detail regarding our dataset taken into consideration.
Table 1: Dataset description used to implement classification algorithm
S.N Attribute Name
Description of Attribute
1 Pregnant Number of pregnant the patients have 2 Plasma-glucose Plasma glucose concentration of the
patient
3 Blood-pressure Diastolic blood pressure of the patient 4 Skin-fold Triceps skin-fold thickness (mm) of the
patient
5 Insulin 2-Hour serum insulin (mu U/ml) of the patient
6 Body-mass Body mass index (weight in kg/(height in m)^2) of the patient
7 Pedigree Diabetes Pedigree Function of the patient
8 Age Age of the patient in years 9 Result variable (0 or 1)
Data in the real world is not complete especially in the area of a medical sector. So to remove unnecessary and noise data we perform the pre-processing of data. Pre-processing of data is a very important stage in this research work as it affects classification results of the diabetes patients. Initially, unwanted and noisy data is removed from the record and secondly, data mining techniques algorithm is applied to build a classifier model. Classifier Modelling means selecting diverse techniques and applying them to different data dataset of the same type. In this research paper, four different classifications are implemented like J48, PART, MultilayerPerceptron and NaiveBayes to build the best classifier model for our dataset.
III.
EXPERIMENTAL SETUP
The dataset is simulated and analyzed in WEKA toolkit. WEKA is open-source software with pre-compiled machine learning algorithms for data mining tasks. Data mining helps in finding precious information concealed in enormous amounts of data. For this purpose, we have WEKA toolkit which has the collection of machine learning algorithms for data mining purpose. Here, we have used 10-cross-validation test option to minimize process distortion and recover process efficiency. The four classifiers J48, PART, MultilayerPerceptron, and NaiveBayes were simulated in WEKA toolkit. The simulation results show that the considered technique performs well in the literature as compared to other similar methods, taking into consideration.
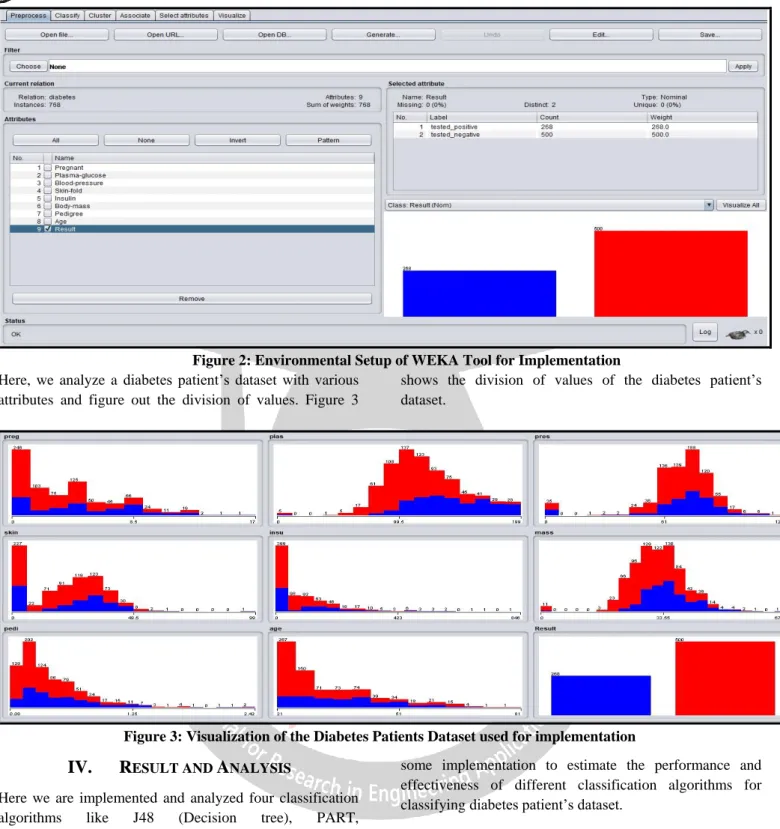
Figure 2: Environmental Setup of WEKA Tool for Implementation Here, we analyze a diabetes patient’s dataset with various
attributes and figure out the division of values. Figure 3
shows the division of values of the diabetes patient’s dataset.
Figure 3: Visualization of the Diabetes Patients Dataset used for implementation
IV.
RESULT AND ANALYSIS
Here we are implemented and analyzed four classification algorithms like J48 (Decision tree), PART, MultilayerPerceptron, and NaiveBayes to build the model for the classification of diabetes patients. In this research paper, we are using 10-fold cross-validation to prepare training and testing dataset. First of all, we check our dataset for baseline accuracy with ZeroR classification algorithm. The baseline accuracy for our dataset is 65.10 %, which implies that we need to do a lot of work to improve the accuracy of our dataset. After data pre-processing, the J48 algorithm is implemented on the dataset using WEKA toolkit which further divided data into "tested positive" or "tested-negative" as two classes.
Table 2 shows the experimental result of different
classification algorithms like J48, PART,
MultilayerPerceptron, and NaiveBayes. We have conceded
some implementation to estimate the performance and effectiveness of different classification algorithms for classifying diabetes patient’s dataset.
Table 2: It shows the performance of different Classifiers used for implementation
Evaluation criteria for classification Algorithm implementation
Classification Algorithm used for Implementation J48 PAR T MP Naive Bayes Timing to build the model
0.01 Sec 0.01 Sec 1.05 Sec 0.00 Sec Correctly classified instances 577 567 577 586 Incorrectly classified instances 191 201 191 182
Accuracy (%) 75.1 302 % 73.8 281 % 75.1 302 % 76.30 21 %
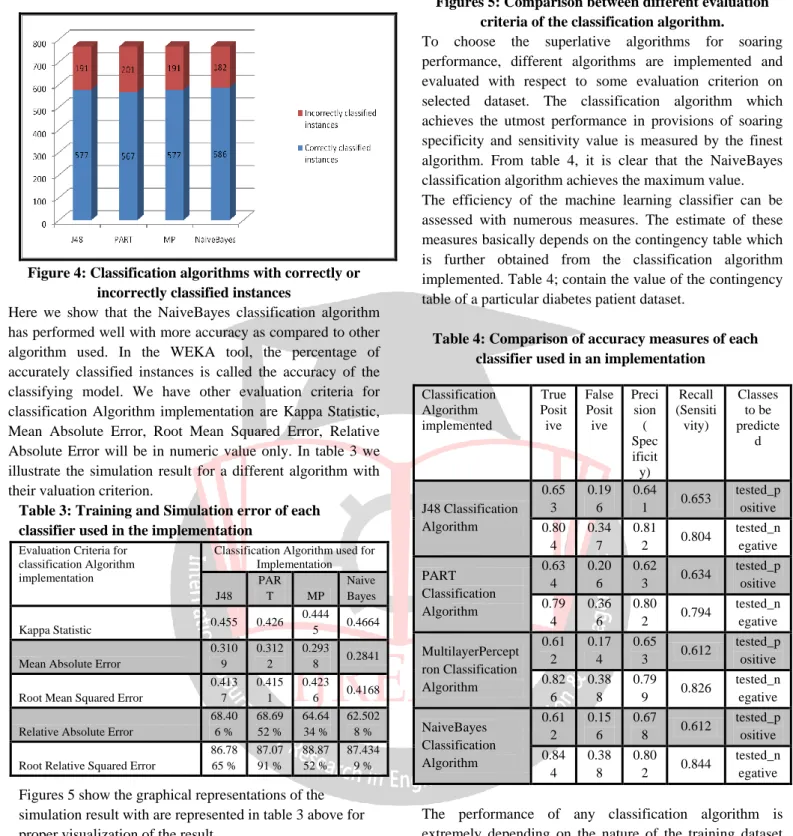
Figure 4: Classification algorithms with correctly or incorrectly classified instances
Here we show that the NaiveBayes classification algorithm has performed well with more accuracy as compared to other algorithm used. In the WEKA tool, the percentage of accurately classified instances is called the accuracy of the classifying model. We have other evaluation criteria for classification Algorithm implementation are Kappa Statistic, Mean Absolute Error, Root Mean Squared Error, Relative Absolute Error will be in numeric value only. In table 3 we illustrate the simulation result for a different algorithm with their valuation criterion.
Table 3: Training and Simulation error of each classifier used in the implementation
Evaluation Criteria for classification Algorithm implementation
Classification Algorithm used for Implementation J48 PAR T MP Naive Bayes Kappa Statistic 0.455 0.426 0.444 5 0.4664 Mean Absolute Error
0.310 9 0.312 2 0.293 8 0.2841 Root Mean Squared Error
0.413 7 0.415 1 0.423 6 0.4168 Relative Absolute Error
68.40 6 % 68.69 52 % 64.64 34 % 62.502 8 % Root Relative Squared Error
86.78 65 % 87.07 91 % 88.87 52 % 87.434 9 %
Figures 5 show the graphical representations of the simulation result with are represented in table 3 above for proper visualization of the result.
Figures 5: Comparison between different evaluation criteria of the classification algorithm.
To choose the superlative algorithms for soaring performance, different algorithms are implemented and evaluated with respect to some evaluation criterion on selected dataset. The classification algorithm which achieves the utmost performance in provisions of soaring specificity and sensitivity value is measured by the finest algorithm. From table 4, it is clear that the NaiveBayes classification algorithm achieves the maximum value. The efficiency of the machine learning classifier can be assessed with numerous measures. The estimate of these measures basically depends on the contingency table which is further obtained from the classification algorithm implemented. Table 4; contain the value of the contingency table of a particular diabetes patient dataset.
Table 4: Comparison of accuracy measures of each classifier used in an implementation
Classification Algorithm implemented True Posit ive False Posit ive Preci sion ( Spec ificit y) Recall (Sensiti vity) Classes to be predicte d J48 Classification Algorithm 0.65 3 0.19 6 0.64 1 0.653 tested_p ositive 0.80 4 0.34 7 0.81 2 0.804 tested_n egative PART Classification Algorithm 0.63 4 0.20 6 0.62 3 0.634 tested_p ositive 0.79 4 0.36 6 0.80 2 0.794 tested_n egative MultilayerPercept ron Classification Algorithm 0.61 2 0.17 4 0.65 3 0.612 tested_p ositive 0.82 6 0.38 8 0.79 9 0.826 tested_n egative NaiveBayes Classification Algorithm 0.61 2 0.15 6 0.67 8 0.612 tested_p ositive 0.84 4 0.38 8 0.80 2 0.844 tested_n egative
The performance of any classification algorithm is extremely depending on the nature of the training dataset used. In WEKA tool, confusion matrices which are generated after simulation of classification algorithm are very constructive for evaluating classifiers. The columns in the confusion matrix represent the predicted classification classes, and the rows represent the actual class.
Table 5: Confusion Matrix of each classifier used in an implementation
Evaluation Criteria for classification Algorithm implementation tested_ positiv e tested_ negativ e Class
J48 Classification Algorithm 175 93 tested_ positive
98 402
tested_ negativ
e
PART Classification Algorithm
170 98 tested_ positive 103 397 tested_ negativ e MultilayerPerceptron Classification Algorithm 164 104 tested_ positive 87 413 tested_ negativ e NaiveBayes Classification Algorithm 164 104 tested_ positive 78 422 tested_ negativ e
Based on the above Figure 4, 5 and Table 2, we noticeably see that the maximum accuracy is 76.30% for NaiveBayes and the minimum accuracy is 73.82% for PART. By applying different classification algorithm, we found that approximately 577 instances out of 768 instances begin to be accurately classified with the maximum score of 586 instances compared to 567 instances, which is the minimum score. The time taken to build the classification model is also an essential parameter. From Table 2, we say that the NaiveBayes algorithm requires the minimum time which is around 0.00 and MultilayerPerceptron algorithm require maximum time which is around 1.05.
V.
CONCLUSION
Different real-life application areas can be helped using various data mining algorithms for decision making. In this research paper, we are considered the dataset of diabetes patients which is further collected at National Institute of Diabetes and Digestive and Kidney Diseases. The dataset has 768 instances with nine different attributes. We are simulated J48, PART, MultilayerPerceptron, and NaiveBayes classification algorithm and found that the NaiveBayes have the maximum accuracy (76.3021%) for classifying the diabetes patients whether they are tested_positive or tested_negative. The constructed model could assist healthcare providers to make better clinical decisions in for Diabetes patients. Additionally, the model could be further developed for patient protection. In the future, the results can be utilized to create a control plan for Diabetes patients because Diabetes patients are normally not identified until a later stage of the disease or the development of complications.
VI.
REFERENCE
[1] Smith, J.W., Everhart, J.E., Dickson, W.C., Knowler, W.C., & Johannes, R.S. (1988). Using the ADAP learning algorithm to forecast the onset of diabetes mellitus. In
Proceedings of the Symposium on Computer Applications and Medical Care (pp. 261--265). IEEE Computer Society Press.
[2] Mokdad AH, Tuffaha M, Hanlon M, El Bcheraoui C, Daoud F, et al. (2015) Cost of Diabetes in the Kingdom of Saudi Arabia, 2014. J Diabetes Metab 6: 575
[3] Yoo, I., Alafaireet, P., Marinov, M., Pena-Hernandez, K., Gopidi, R., Chang, J. F., & Hua, L. (2012). Data mining in healthcare and biomedicine: a survey of the literature. Journal of medical systems, 36(4), 2431-2448.
[4] Tahani Daghistani, Riyad Alshammari "Diagnosis of Diabetes by Applying Data Mining Classification Techniques, Comparison of Three Data Mining Algorithms" (IJACSA) International Journal of Advanced Computer Science and Applications, Vol. 7, No. 7, 2016.
[5] Sudajai Lowanichchai, Saisunee Jabjone, Tidanut Puthasimma, (2012)”Knowledge-based DSS for an Analysis Diabetes of Elder using Decision Tree”.
[6] Yang Guo, Guohua Bai, Yan Hu School of computing Blekinge (2010) Institute of Technology Karlskrona, Sweden, "Using Bayes Network for Prediction of Type-2 Diabetes". [7] X. Wu & V. Kumar, “The Top Ten Algorithms in Data
Mining”, Chapman and Hall, Boca Raton, 2009.
[8] Canivell S, and Gomis R 2014 “Diagnosis and classification of autoimmune diabetes mellitus”, Autoimmunity reviews, vol.13, no.4, pp. 403-407.
[9] Tomar D, and Agarwal S 2013 "A survey on Data Mining approaches for Healthcare". International Journal of Bio-Science and Bio-Technology, vol.5, no.5, pp. 241-266. [10]S. Kumari and A. Singh, "A Data Mining Approach for the
Diagnosis of Diabetes Mellitus", Proceedings of Seventh International Conference on Intelligent Systems and Control, 2013, pp. 373-375
[11]T. Jayalakshmi and Dr. A. Santhakumaran, “A Novel Classification Method for Diagnosis of Diabetes Mellitus Using Artificial Neural Networks”, International Conference on Data Storage and Data Engineering, 2010, pp. 159-163 [12]Ewald N, Kaufmann C, Raspe A, Kloer H.U, Bretzel R.G,
and Hardt P.D 2012 “Prevalence of diabetes mellitus secondary to pancreatic diseases (type 3c)”, Diabetes/metabolism research and reviews, vol.28, no.4, pp. 338-342.
[13]Li, R., Zhang, P., Barker, L. E., Chowdhury, F. M., & Zhang, X. (2010). Cost-effectiveness of interventions to prevent and control diabetes mellitus: a systematic review. Diabetes Care, 33(8), 1872-1894.
[14]Y. Huang, P. McCullagh, N. Black, R. Harper, Feature selection and classification model construction on type 2 diabetic patients’ data, Artificial Intelligence in Medicine 41 (3) (2015) 251–262.
[15]Shivakumar, B. L., & Alby, S. (2014, March). A Survey on Data-Mining Technologies for Prediction and Diagnosis of Diabetes. In Intelligent Computing Applications (ICICA), IEEE 2014 International Conference on (pp. 167-173).