EN
EN
EUROPEAN
COMMISSION
Brussels, 18.3.2015
SWD(2015) 35 final/2
CORRIGENDUM
This document corrects document SWD(2015) 35 final of 26.02.2015
Replacement of wrong table on page 43
The text shall read as follows:
COMMISSION STAFF WORKING DOCUMENT
Country Report Luxembourg 2015
{COM(2015) 85 final}
This document is a European Commission staff working document . It does not
constitute the official position of the Commission, nor does it prejudge any such position.
CONTENTS
Executive summary 1
1. Scene setter: economic situation and outlook 3
2. Structural issues 10
2.1. Fiscal framework, long-term sustainability, pension and healthcare 11
2.2. Taxation system 15
2.3. Banking and financial stability 18
2.4. Competitiveness, business environment and diversification of the economy 20
2.5. Labour market, education and social policies 24
2.6. Environment, Energy and Transportation 29
A. Overview Table 31
B. Standard Tables 37
LIST OF TABLES
1.1. Key economic, financial and social indicators 8
1.2. The MIP scoreboard 9
B.1. Macroeconomic indicators 37
B.2. Financial market indicators 38
B.3. Taxation indicators 39
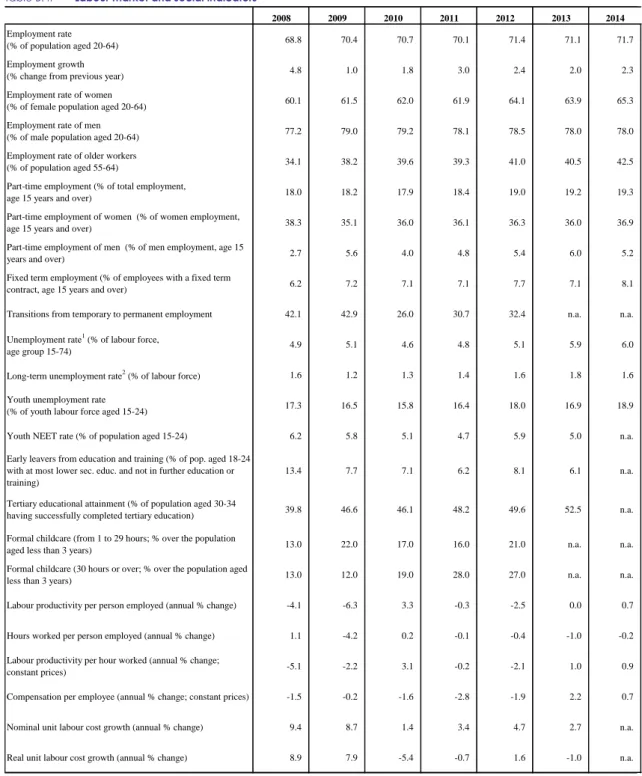
B.4. Labour market and social indicators 40
B.5. Expenditure on social protection benefits (% of GDP) 41
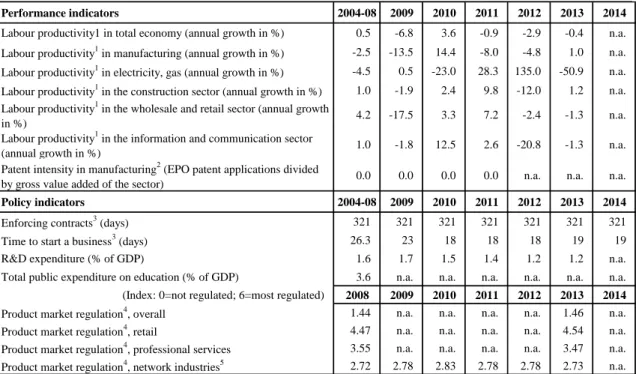
B.6. Product market performance and policy indicators 42
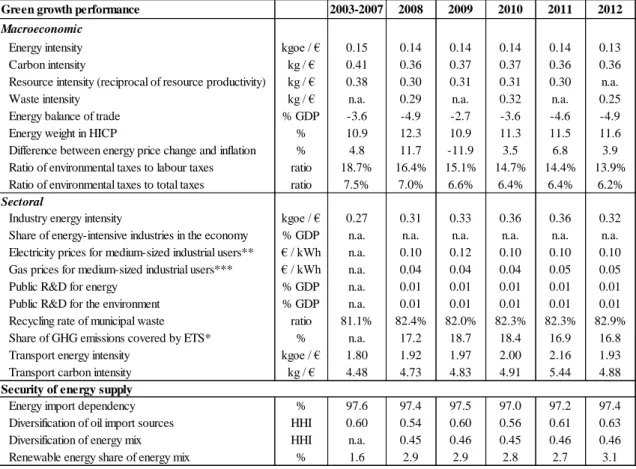
B.7. Green growth 43
LIST OF GRAPHS
3
1.2. Decomposition of the current account balance 4
1.3. Investment funds – Net assets under management (billions of euro) 5
1.4. Trend in Gross Fixed Capital Formation, index 2000=100 5
1.5. Decomposition of debt 6
1.6. Sector breakdown of general government balance 6
2.1.1. Effective retirement age versus legal threshold, life expectancy 12
2.1.2. New pensions 13
2.2.1. Progression of e-VAT revenues 15
2.2.2. Property taxation as % of GDP 16
2.2.3. Recurrent property taxation, % of GDP 17
2.3.1. Share of Domestic Banks (as % of Total Assets) 18
2.3.2. Diversification of the financial sector 19
2.4.1. Productivity and wage evolution 2009-2013 (2009=100) 20
2.4.2. Real compensation per employee versus real productivity per person employed 20
2.4.3. Labour productivity per sector 21
2.4.4. Luxembourg rank across topics 23
2.5.1. Employment rates by age group (%) 24
2.5.2. Unemployment traps by wage and family composition 26
2.6.1. Gap between 2020 Greenhouse Gas Emissions (GHG) projections and 2020 targets 30
LIST OF BOXES
1.1. Economic surveillance process 7
EXECUTIVE SUMMARY
The financial sector remains Luxembourg's main growth engine. The strength of the sector has allowed the country to create and sustain a generous welfare state without jeopardising public finances, while keeping public debt at a low level. According to the Commission's winter 2015 economic forecast, economic activity is projected to continue expanding this year with GDP growth reaching 2.6%, slightly below the 2014 level. The main contribution to growth will come from domestic demand, notably investment. Unemployment is expected to peak in 2015, before to inch down in 2016, although it remains markedly low compared with the EU average. Concerning public finances, in 2014 the general government surplus is set to have declined marginally to 0.5% of GDP from 0.6% in 2013. In spite of the envisaged fiscal consolidation effort, public finances are expected to deteriorate in 2015, mostly as a result of the VAT revenue shortfall that has followed this year's change in the regulation related to e-commerce. In spite of the 2 percentage points increase in VAT rates that came into effect on 1 January 2015, inflation is set to remain subdued, in line with a negative output gap and the sustained weakening of oil prices. The recently announced quantitative easing decision by the European Central Bank is expected to introduce upward pressure on prices, especially in 2016.
This Country Report assesses Luxembourg's
economy against the background of the
Commission's Annual Growth Survey which recommends three main pillars for the EU's economic and social policy in 2015: investment, structural reforms, and fiscal responsibility. In line with the Investment Plan for Europe, it also explores ways to maximise the impact of public resources and unlock private investment. The main observations and findings of the analysis are:
Public finances remain sound, underpinned by a strong policy framework. In view of the expected deterioration of the fiscal balance in 2015, the government has embarked on a series of corrective measures, targeting both the expenditure and revenue side, to maintain the country's Medium-Term Objective throughout the programming period. An ambitious fiscal consolidation plan, including VAT rate increases, more rationalised expenditures and other measures, is expected help to improve the
state budget by around 2% of GDP during the
period 2015-18. Moreover, the recent
introduction of a multi-annual framework will contribute to smooth the impact of the economic cycle on public finances and reduce the volatility and exposure of revenues to exogenous factors, such as the evolution of financial markets. While limited progress has
been made in the area of pensions,
Luxembourg continues to face challenges in terms of the long-term sustainability of its public finances. Although the recent VAT reform is set to at least partially offset the drop in consumption tax revenues from the change in regulation related to e-commerce, there is scope for further broadening the tax base, given the ongoing wide use of reduced rates and for revisiting the currently low taxation on housing property. Finally, there is a potential to raise revenues from alternative growth-friendly sources, including environmental taxation.
The economy is heavily dependent on the financial sector. Efforts to foster investment in sectors with high gross value added are worth being pursued, in the search for alternative sources of growth. The government is directly promoting investment in high quality infrastructure with the potential to contribute to higher productivity, particularly in the network industry and transport sectors. While the Investment Plan put forward by the new Commission could help in this endeavour,
Luxembourg's deteriorating cost
competitiveness would need to be reversed. Ensuring that wages evolve in line with
productivity would help to improve
Luxembourg's external position. Nevertheless, the low level of cooperation between firms and public research institutions and the sharp drop in business R&D intensity (from 1.5% in 2000 to 0.7% in 2013) reveal the current weakness of Luxembourg’s research and innovation system.
Despite overall well performing labour
markets and high tertiary education
attainment rates, employment rates are comparatively low for older workers, women and low-skilled young people. There are institutional obstacles to effective activation policies. Disincentives to work exist largely arising from the 'joint taxation' system and
Executive summary
2 from the design of the social benefit system.
Finally, the rate of those at-risk-of-poverty and social exclusion is rising among children,
single-parent households and migrants,
although from low overall levels.
Luxembourg is currently not on track in reducing the level of greenhouse gas emissions - in sectors not covered by the EU’s Emissions Trading System - by 20% between 2005 and 2020. According to the latest projections, however, the country will not achieve that Europe 2020 target, largely because of the cross-country fuel purchase induced by the country's relatively low taxes on petrol and diesel. The government announced that results from a feasibility study on the impact of a reform of energy taxation will be released in the course of 2015. Results from the study could feed in the envisaged general fiscal reform that is currently under preparation.
Overall, Luxembourg has made limited
progress in addressing the country-specific recommendations issued by the Council in 2014. Although substantial progress has been achieved as regards the situation of the public finances in the short- to medium-term and in the area of strengthening fiscal governance, there has been limited progress concerning the sustainability of public finances in the long-term. Indeed, the 2012 reform of the pension system was not ambitious enough and age-related liabilities remain a looming risk in the long-term, also in light of stalled progress in long-term care reform. Efforts to reduce unemployment, notably among low-skilled young people, have been intensified and point to some progress in this area. Conversely, progress with raising the employment rate among older workers, including by improving their employability through lifelong learning, has been limited. Finally, Luxembourg has made limited progress in strengthening
vocational education by promoting
apprenticeship and training. No progress however was made as to the general reform of secondary education. No progress either was made as regards the improvement of cost
competitiveness and the reduction of
Greenhouse Gas emissions, where a focus on
concrete and ambitious measures is still missing.
The Country Report reveals the policy challenges stemming from the analysis, namely:
The long-term sustainability of public
finances is threatened by the growth of pension expenditure, despite the recent reform of the system, and by the steady increase in long-term care outlays. A review is only scheduled for 2016.
The cost competitiveness of the
Luxembourg's economy has been eroded over the last decade by nominal unit labour costs rising faster than in trading partners, broadly as a result of stagnating labour productivity and steadily increasing nominal wages. Meanwhile, the heavy reliance of the economy on the financial sector implies an inherent structural risk indicative of the need for economic diversification, including through
higher investment in research and
development.
Education outcomes remain unsatisfactory
despite high tertiary attainment rates, and alleviating the situation of people with a migrant background and low-skilled young people remains difficult. Labour market supply challenges persist related to institutional factors and to the design of the social benefit system. Also the poverty situation and social exclusion, including housing accessibility for low-income groups, requires attention.
Luxembourg faces the challenge of
transforming itself into a low-carbon and resource-efficient economy. A comprehensive framework of concrete policy measures could help the authorities achieve both environmental and economic targets.
1.
SCENE SETTER: ECONOMIC SITUATION AND OUTLOOK
RECENT MACRO-ECONOMIC DEVELOPMENTS AND OUTLOOK
In 2014 economic growth accelerated, after two years of relatively low growth. In particular, in the third quarter output increased by 2.3% quarter-on-quarter, after 1.0% and 0.5% in the first two quarters of 2014. As a whole, GDP growth is expected to come out at 3.0% in 2014, after 2.0% in 2013 and a relatively small contraction of 0.2% in 2012.
From a sectorial perspective, the recent increase in output is explained by a more benign than expected performance of the financial sector, while the services-to-business sector continues to prove its overall strength. In particular, the resilience of credit activities and an attempt to reverse, since the beginning of 2014, of the downward trend of deposits in the banking sector might point to a successful adaption of the financial sector to the challenges arising from the wave of new international regulations (CRR/CRD IV (1)). The diversification of the sector (see section 2.3), combined with the recent recovery of financial markets, is likely to be behind its resilience. Looking into the near future - and on the basis of its diversification and the proactive behaviour of sectoral and national authorities - the financial sector is expected to return to a position of contributing positively to economic growth.
While the recovery is indeed gaining
momentum, it is unlikely that the economy will return to the growth levels of the period before-the-crisis, when output growth averaged 4¾% over the period 2000-07. According to the most recent estimate, potential growth has been revised down compared with the period before the crisis and would currently just attain 2%, dragged down by the drop in the labour contribution, and by the contribution of total factor productivity that turned negative since 2009. The difficulties encountered by the country to further increase productivity might reflect a lower outlook for productivity in the financial sector, where the potential has been dented by the rather strict regulatory framework that has been recently put in place. As GDP is
(1) "CRR/CRD IV" is a comprehensive set of reform measures
to strengthen the regulation, supervision and risk management of the banking sector.
projected to grow above 2% in upcoming years the negative output gap, built up during the crisis, is forecast to narrow.
Graph 1.1: Decomposition of potential growth
-8.0 -6.0 -4.0 -2.0 0.0 2.0 4.0 6.0 8.0 10.0 00 01 02 03 04 05 06 07 08 09 10 11 12 13 Labour contribution Capital
TFP Potential growth Actual GDP growth
Source: European Commission
The labour market has shown a remarkable
resilience throughout the crisis. Without
achieving the rate recorded before the crisis, the pace of job creation remained sustained at 2.0% in 2013 and accelerated in 2014. Apart from the industrial sector where overall employment still continue to contract, all sectors recorded positive growth in 2013, including the financial sector as a whole, where employment grew by 0.9%. The outlook for employment growth over the coming years remains positive, though a slow-down in the pace of job creation is expected, in line with GDP projections.
In spite of job creation remaining dynamic,
unemployment increased over the recent years.
These decoupling trends hint at concerns regarding a smooth transition from school to work for the resident population, but also at the possible existence of financial disincentives to take up a job. Overall, unemployment nevertheless remains low in comparison with the euro area. The relatively high youth unemployment rate must also be seen in the light of the overall low activity rate of this age cohort as the absolute number of young people unemployed remains small in absolute terms. The measures recently introduced or in the pipeline with a view to increasing the participation
1. Scene setter: economic situation and outlook
4 of older workers in the labour market (among the
lowest in the EU), could also bring about an increase in the unemployment rate if not counterbalanced by decisive active labour market policies aiming at increasing the employability of the people concerned.
Labour productivity levels remain among the highest in the euro area, though its growth rate has stagnated in recent years. This is partly
explained by labour hoarding practices,
encouraged by public support schemes. A specific feature of the country is the sizeable divergence of labour productivity across economic sectors, with the financial sector posting by far the highest level.
Stagnation of labour productivity and the steady increase in nominal wages, partly related to the automatic indexation of wages have led to an increase in nominal unit labour costs over the last decade. Unit labour costs rose by 56.8% in Luxembourg between 2000 and 2013, more than twice as fast as the euro area 19 average of 26.0% and compared with 12.5% in Germany over the same period.
In line with plummeting oil prices, inflation fell sharply in the last part of 2014. In December, it became negative for the first time since October 2009. As a whole, inflation came out at 0.7% in 2014, down from 1.7% in 2013. Core inflation (which excludes unprocessed food and energy), also went down, but it is estimated to have settled at 1.7% on average in 2014. The low inflation environment is likely to limit the impact of the 2 percentage point increase in VAT rates and to postpone the adaptation of wages, comforting the government's decision to not maintain the temporary adjustment mechanism for wage indexation.
EXTERNAL DEVELOPMENTS
The current account balance remains in surplus, though lower than the average surplus of around 10% of GDP recorded during the period 2001-07. It lost some ground afterwards and the surplus is projected to shrink even further - below 6% (2) of GDP from 2015 - as VAT on e-
(2) Relevant threshold in the context of the Macro-economic
imbalance procedure.
commerce, paid to the countries of residence of consumers, will be discounted from the export of services. This large and persistent current account surplus is mostly driven by financial services and shelters a persistent and gradually increasing deficit in the trade balance for goods. The latter stems more from weak export growth than from an increase in imports as is also reflected in the significant loss in export market share for goods, which even accelerated in the aftermath of the financial crisis.
Graph 1.2: Decomposition of the current account balance -60 -40 -20 0 20 40 60 00 01 02 03 04 05 06 07 08 09 10 11 12 13 % o f GD P
Secondary income balance Primary income balance Trade balance - services Trade balance - goods Trade balance
Current account balance (CA)
Source: European Commission
This trend is likely to reflect not simply the increasing "tertiarisation" of the economy, but also a more structural loss of cost competitiveness, which has mostly penalised sectors exposed to international competition that are rather price-takers than price-makers. The share in the economy of the industrial sector, in terms of gross value added, has almost halved, while the decline in the euro area has been more moderate and limited to just over 10%.
The current account surplus is also dragged down by the widening deficit on the primary income balance. This net outflow increased to 31% of GDP in 2012 (from 14.8% of GDP in 2002), mirroring the increasing success of the financial services industry in placing its products abroad and the large number of foreign workers.
1. Scene setter: economic situation and outlook
THE FINANCIAL SECTOR
The financial sector in Luxembourg is very large relative to the size of the economy. Performances have been unequal across a rather diversified financial sector. The fund industry has profited from the favourable orientation of the financial markets and has increased the amount of assets under management, also thanks to new subscriptions. By end of 2014, investment funds had more than EUR 3 trillion of net assets under management, a figure that has doubled since the trough of the financial crisis (see Graph 1.3).
Graph 1.3: Investment funds – Net assets under management (billions of euro)
0 500 1000 1500 2000 2500 3000 3500 J a n 0 0 J a n 0 1 J a n 0 2 J a n 0 3 J a n 0 4 J a n 0 5 J a n 0 6 J a n 0 7 J a n 0 8 J a n 0 9 J a n 1 0 J a n 1 1 J a n 1 2 J a n 1 3 J a n 1 4
Source: Commission des Surveillance du Secteur Financier
On the other hand, the performance of the more traditional banking sector has been lacklustre, even if the sector appears to have bottomed out and is now on the verge of a consolidation of the efforts carried out in the recent years. Still, in 2014 balance sheets continued to shrink following the decrease in the intermediation activity and lower profitability (3). Insurance sector results are rather stable and show progress mostly in the non-life branch. Recently, the assets-quality review conducted by the European Central Bank and the forward-looking stress tests coordinated by the European Banking Authority confirmed the
(3) See press release of 21 January 2015 of the 'Commission
de Surveillance du Secteur Financier", available at: http://www.cssf.lu/fileadmin/files/Publications/Communiques/
Communiques_2015/CP1507_PP_210115.pdf
robustness and the reliability of Luxembourg's banking sector, which is characterised by a high level of capitalisation.
CREDIT AND INVESTMENT
Lending to non-financial corporation has resumed solidly since the second quarter of 2014 amid an easing of the additional conditions (such as the request for higher collateral) that banks are requesting in order to grant a loan. Medium and small enterprises, for which it is more difficult to tap into alternative sources of finance, were those that benefitted the most as large corporations could already finance their needs directly on the bond market. Since 2000, public investment has regularly stood above the euro area average. The government plans to further increase investment in the next years in order to realise important projects in the area of the transport infrastructure. Overall, investment, has benefitted from favourable lending conditions and has been dynamic over recent years, largely outpacing developments in the euro area or in Germany (see Graph 1.4).
Graph 1.4: Trend in Gross Fixed Capital Formation, index 2000=100 80 90 100 110 120 130 140 150 00 01 02 03 04 05 06 07 08 09 10 11 12 13 LU DE EA-18
Source: European Commission
In the context of the investment Plan for Europe, the government, in consultation with the private sector, has formulated a list of projects that would seem to be eligible. The list includes nine large projects, broken down into 35 single programmes. They cover a rather large scope and
1. Scene setter: economic situation and outlook
6
range from the energy union to social
infrastructures through environment and transport- related projects.
DOMESTIC DEBT IS MAINLY A PRIVATE DEBT CONCERN
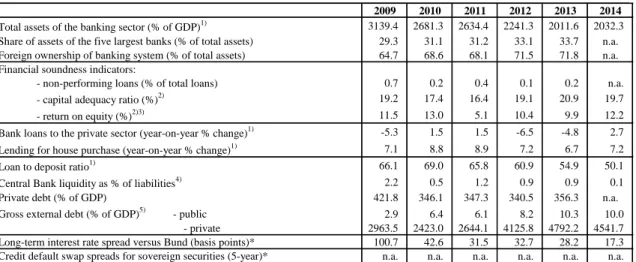
Public debt stood at 23.6% of GDP in 2013, around four times lower than the euro area average (93.3% of GDP). In light of the low level of public debt and its relatively solid economic fundamentals, Luxembourg, together with Germany, is the only country in the euro area still enjoying an "AAA" rating from all three major rating agencies. The level of existing public guarantees amount to 8.8% of GDP, of which 4.9% are related to the financial sector.
Private sector debt, on the other side, is at a level well above the euro area average, see Graph 1.5. It peaked in 2009 at 421.8% of GDP (in gross terms) and since then has decreased substantially to 340.6% in 2012, but in 2013 it rose again to 356.2% of GDP. The high level of private debt mostly belongs to non-financial corporation. It is largely explained by the presence of a high number of multinational corporations that use Luxembourg as a financial hub for their infra-group financing operations.
Graph 1.5: Decomposition of debt
0 50 100 150 200 250 300 350 400 450 500 06 07 08 09 10 11 12 13 % o f GD P
Household Non financial corporations Government Private sector
Source: European Commission
Household debt is on a steadily rising path and is mostly related to real estate investment activities.
At this regard, concerns also refer to the fact that the majority of mortgages are subscribed at variable rates, putting debt service constraints on households should interest rates normalise and align again with historical average levels. In this context it can be noted that the continuous increase in housing prices could represent a nascent threat to the economy. Since 2000 house prices increased, in nominal terms, by 173%, or 8.1% on average annually.
Public finances still sound, in spite of sustained trend in public expenditure
In 2013, Luxembourg preserved its sound fiscal
position. The general government balance
recorded a surplus of 0.6% of GDP in 2013, better than the 0.1% of GDP surplus recorded in 2012. In 2014, the surplus is projected to only marginally decline to 0.5% of GDP.
While these figures are well above the euro area average, they compare with an average surplus of 1.6% of GDP between 2000 and 2013. A breakdown by sectors of the general government accounts reveals that the decline stems from the deterioration of the accounts of the central government that, since the inception of the financial crises, have posted large deficits. At the consolidated level of the general government they are offset by the steady surpluses of the social security sector (see Graph 1.6).
1. Scene setter: economic situation and outlook
Graph 1.6: Sector breakdown of general government balance -3.0 -2.0 -1.0 0.0 1.0 2.0 3.0 4.0 5.0 6.0 7.0 00 01 02 03 04 05 06 07 08 09 10 11 12 13 % o f GD P
Social security funds Local government Central government General government
Source: European Commission
In 2015, a change in the European legislation on VAT on e-commerce that entered into force on 1 January is expected to shave off around 1.5% of GDP in revenues. This loss is expected be only partially counterbalanced by the impact of the consolidation measures adopted in the budget.
The objective of the medium-term budgetary strategy, as outlined in the latest budgetary plans, is to meet the country specific Medium-Term Objective throughout the programming period covering 2015-18. In this regard, last December
the government adopted a multi-annual
programming law that already details most of the measures planned to achieve the target. The consolidation path is however mostly based on additional revenues, while on the expenditure side
efforts to curtail public spending are not solidly underpinned by concrete measures, thereby exposing the public finance targets to risks of slippages.
Box 1.1: Economic surveillance process
The Commission’s Annual Growth Survey, adopted in November 2014, started the 2015 European Semester, proposing that the EU pursue an integrated approach to economic policy built around three main pillars: boosting investment, accelerating structural reforms and pursuing responsible growth-friendly fiscal consolidation. The Annual Growth Survey also presented the process of streamlining the European Semester to increase the effectiveness of economic policy coordination at the EU level through greater accountability and by encouraging greater ownership by all actors.
This Country Report includes an assessment of progress towards the implementation of the 2014 Country-Specific Recommendations adopted by the Council in July 2014. The Country-Specific Recommendations for Luxembourg concerned public finances, the introduction of a medium-term budgetary framework, the use of VAT reduced rates, the pension system, wage setting and the diversification of the structure of the economy, the labour market and a reduction in greenhouse gas emissions.
1. Scene setter: economic situation and outlook
8
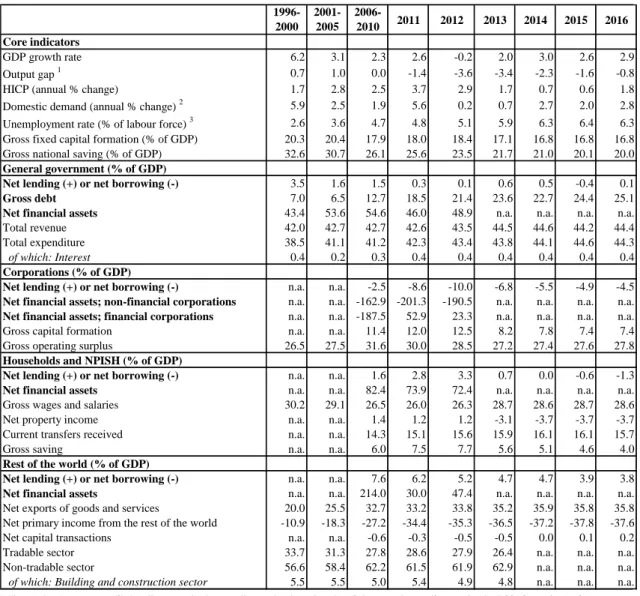
Table 1.1: Key economic, financial and social indicators
2008 2009 2010 2011 2012 2013 2014 2015 2016
Real GDP (y-o-y) 0.5 -5.3 5.1 2.6 -0.2 2.0 3.0 2.6 2.9
Private consumption (y-o-y) 0.0 0.8 2.0 1.2 1.9 1.5 2.5 1.4 2.5
Public consumption (y-o-y) 2.3 4.0 3.1 1.2 3.7 5.0 3.2 2.6 3.0
Gross fixed capital formation (y-o-y) 9.9 -12.2 -0.2 14.4 2.4 -4.5 2.4 2.4 3.0
Exports of goods and services (y-o-y) 7.3 -12.7 8.2 5.0 2.9 5.6 2.4 4.1 5.1
Imports of goods and services (y-o-y) 9.2 -14.0 9.6 6.9 3.8 5.8 2.1 4.2 5.6
Output gap 1.7 -5.4 -2.0 -1.4 -3.6 -3.4 -2.3 -1.6 -0.8
Contribution to GDP growth:
Domestic demand (y-o-y) 2.2 -1.5 1.2 3.0 1.6 0.5 1.7 1.3 1.8
Inventories (y-o-y) -1.2 -1.8 3.1 0.7 -1.5 0.0 0.0 0.0 0.0
Net exports (y-o-y) -0.5 -2.0 0.8 -1.1 -0.3 1.5 1.2 1.3 1.1
Current account balance (% of GDP), balance of payments 6.7 7.5 7.1 5.9 5.8 4.9 . . .
Trade balance (% of GDP), balance of payments 36.4 34.7 33.2 32.3 36.4 38.8 . . .
Terms of trade of goods and services (y-o-y) 1.4 1.6 0.1 0.9 0.3 0.0 0.2 -0.2 0.0
Net international investment position (% of GDP) 158.8 155.1 153.6 191.5 207.2 216.4 . . .
Net external debt (% of GDP) -2517.0*-2938.9*-3193.3*-2484.5*-2269.2* . . . .
Gross external debt (% of GDP) 3786.9 3612.5 3317 2293.2 5493.7 5740.4 . . .
Export performance vs advanced countries (% change over 5 years) 26.7 18.5 8.5 1.9 -2.3 9.5 .
. .
Export market share, goods and services (%) 0.5 0.5 0.4 0.4 0.4 0.5 . . .
Savings rate of households (net saving as percentage of net disposable
income) 9.5 12.1 13.0 13.6 13.7 . . . .
Private credit flow, consolidated, (% of GDP) 18.4 -6.6 -53.3 20.2 0.5 27.8 . . .
Private sector debt, consolidated (% of GDP) 391.4 421.8 346.1 347.3 340.5 356.3 . . .
Deflated house price index (y-o-y) 0.0 -2.2 4.0 1.0 2.6 3.6 . . .
Residential investment (% of GDP) 4.1 3.4 2.6 2.5 3.0 3.1 . . .
Total financial sector liabilities, non-consolidated (y-o-y) -8.6 10.0 14.9 12.6 15.9 8.6 . . .
Tier 1 ratio1 . . . .
Overall solvency ratio2 . . . .
Gross total doubtful and non-performing loans (% of total debt
instruments and total loans and advances)2 . . . .
Change in employment (number of people, y-o-y) 3.3 1.0 1.7 2.7 2.5 1.7 2.0 2.1 2.2
Unemployment rate 4.9 5.1 4.6 4.8 5.1 5.9 6.3 6.4 6.3
Long-term unemployment rate (% of active population) 1.6 1.2 1.3 1.4 1.6 1.8 . . .
Youth unemployment rate (% of active population in the same age group) 17.3 16.5 15.8 16.4 18.0 16.9 18.9 . .
Activity rate (15-64 year-olds) 66.8 68.7 68.2 67.9 69.4 69.9 . . .
Young people not in employment, education or training (%) 6.2 5.8 5.1 4.7 5.9 5.0 . . .
People at risk of poverty or social exclusion (% of total population) 15.5 17.8 17.1 16.8 18.4 19.0 . . .
At-risk-of-poverty rate (% of total population) 13.4 14.9 14.5 13.6 15.1 15.9 . . .
Severe material deprivation rate (% of total population) 0.7 1.1 0.5 1.2 1.3 1.8 . . .
Number of people living in households with very low work-intensity (%
of total population aged below 60) 4.7 6.3 5.5 5.8 6.1 6.6 . . .
GDP deflator (y-o-y) 3.9 1.6 3.7 5.0 3.5 1.4 1.5 0.5 2.1
Harmonised index of consumer prices (HICP) (y-o-y) 4.1 0.0 2.8 3.7 2.9 1.7 0.7 0.6 1.8
Nominal compensation per employee (y-o-y) 2.3 1.4 2.1 2.1 1.5 3.6 2.3 1.6 2.3
Labour productivity (real, person employed, y-o-y) -4.1 -6.3 3.3 -0.3 -2.5 0.0 . . .
Unit labour costs (ULC) (whole economy, y-o-y) 6.6 8.3 -1.1 2.4 4.2 3.6 1.6 1.2 1.6
Real unit labour costs (y-o-y) 2.7 6.5 -4.7 -2.4 0.7 2.2 0.0 0.6 -0.6
REER3) (ULC, y-o-y) 4.4 5.5 -2.8 1.7 0.2 3.6 0.4 -1.2 0.8
REER3) (HICP, y-o-y) 0.3 0.6 -1.9 0.7 -1.2 1.3 1.4 0.1 -0.1
General government balance (% of GDP) 3.3 -0.5 -0.6 0.3 0.1 0.6 0.5 -0.4 0.1
Structural budget balance (% of GDP) . . 0.2 0.9 1.7 2.1 1.3 0.4 0.5
General government gross debt (% of GDP) 14.4 15.5 19.6 18.5 21.4 23.6 22.7 24.4 25.1
Forecast
1 Domestic banking groups and stand-alone banks.
2 Domestic banking groups and stand-alone banks, foreign-controlled (EU and non-EU) subsidiaries and branches. 3 Real effective exchange rate
(*) Indicates BPM5 and/or ESA95
1. Scene setter: economic situation and outlook
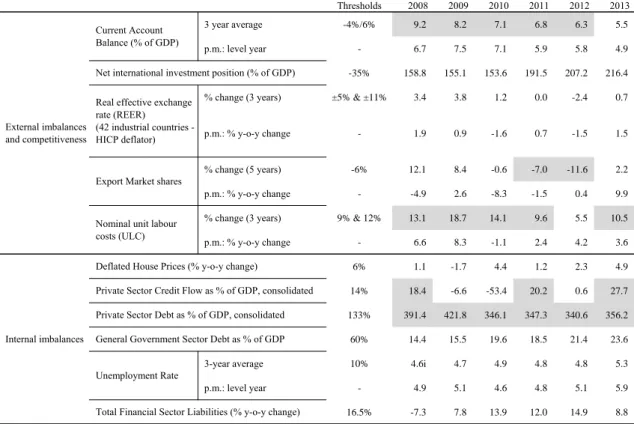
Table 1.2: The MIP scoreboard
Thresholds 2008 2009 2010 2011 2012 2013
3 year average -4%/6% 9.2 8.2 7.1 6.8 6.3 5.5
p.m.: level year - 6.7 7.5 7.1 5.9 5.8 4.9
-35% 158.8 155.1 153.6 191.5 207.2 216.4
% change (3 years) ±5% & ±11% 3.4 3.8 1.2 0.0 -2.4 0.7
p.m.: % y-o-y change - 1.9 0.9 -1.6 0.7 -1.5 1.5
% change (5 years) -6% 12.1 8.4 -0.6 -7.0 -11.6 2.2
p.m.: % y-o-y change - -4.9 2.6 -8.3 -1.5 0.4 9.9
% change (3 years) 9% & 12% 13.1 18.7 14.1 9.6 5.5 10.5
p.m.: % y-o-y change - 6.6 8.3 -1.1 2.4 4.2 3.6
6% 1.1 -1.7 4.4 1.2 2.3 4.9
14% 18.4 -6.6 -53.4 20.2 0.6 27.7
133% 391.4 421.8 346.1 347.3 340.6 356.2
60% 14.4 15.5 19.6 18.5 21.4 23.6
3-year average 10% 4.6i 4.7 4.9 4.8 4.8 5.3
p.m.: level year - 4.9 5.1 4.6 4.8 5.1 5.9
16.5% -7.3 7.8 13.9 12.0 14.9 8.8
Internal imbalances
Deflated House Prices (% y-o-y change)
Private Sector Credit Flow as % of GDP, consolidated Private Sector Debt as % of GDP, consolidated General Government Sector Debt as % of GDP Unemployment Rate
Total Financial Sector Liabilities (% y-o-y change) External imbalances
and competitiveness
Current Account Balance (% of GDP)
Net international investment position (% of GDP) Real effective exchange
rate (REER) (42 industrial countries - HICP deflator)
Export Market shares
Nominal unit labour costs (ULC)
Flags: b: break in time series. na: not available.
"Note: Figures highlighted are the ones falling outside the threshold established by EC Alert Mechanism Report. For REER and ULC, the first threshold concerns Euro Area Member States. (1) Figures in italic are according to the old standards
(ESA95/BPM5). (2) Export market shares data: the total world export is based on the 5th edition of the Balance of Payments Manual (BPM5). (3) Unemployment rate i=Eurostat backcalculation to include Population Census 2011 results. (4)
International investment position data have been revised upwards following methodological changes in the treatment of intragroup loans of SPEs and information from a new collection survey in the financial sector.
2.1. FISCAL FRAMEWORK, LONG-TERM SUSTAINABILITY, PENSION
AND HEALTHCARE
Fiscal framework
In 2013, Luxembourg was the only country still lacking a medium-term budgetary framework underpinning multi-annual fiscal planning. A multi-annual programme existed for investment expenditure but only had an indicative character.
On 12 July 2014, a draft bill (4), aiming to transpose Council Directive 85/2011/EU on budgetary frameworks and the Fiscal Compact, was finally adopted by the national parliament. The adopted law improves the medium-term budgetary framework in line with the EU requirements. It introduces multiannual ceilings in the multi-annual financial programming law that cover the central government sector only.
However, it gives no indication of the
consequences in the event of ceilings being exceeded, nor does it introduce a national expenditure rule to guide the setting of multiannual expenditure targets. It does, however, require that the adjustment path to the medium-term objective be respected. To that end, it includes annual forecasts for the public debt and balance accounts (both in nominal and structural terms), broken down by major subsectors, i.e. central government, social security and local government. For each major budget line, expenditure and revenue projections are to be annexed to the multi-annual
financial programming law. The expected
contribution of planned policies to the achievement of multiannual budgetary targets and a comparison with a no-change policy baseline would also be annexed.
In October 2014, for the first time the government deposited before the Parliament, along with the annual budget, a multi-annual financial programming law covering the period 2014-2018. It detailed plans to achieve the medium-term budgetary objective at the level of general government. In line with the requirements
of Regulation (EU) No 473/2013, the
macroeconomic forecast underlying the draft budget for 2015 has been produced by STATEC, an autonomous administration placed under the authority of the Ministry of Economy.
(4) Draft Law n. 6597 available at: http://www.chd.lu/
The introduction of a structural budget balance rule, also under the adopted bill, further
strengthens the fiscal framework of
Luxembourg. The definition of the rule is clear, referring directly to the medium-term objective and the adjustment path towards it, but the specific action to be taken in case of significant deviation from the rule is specified rather loosely.
The adopted bill also provides for the creation of the Conseil National des Finances Publiques (CNFP), entrusted with the task of the independent monitoring of fiscal rules. At the same time, there is no provision in the bill obliging the Government
to formally respond to the CNFP
recommendations. The CNFP became operational only on 7 November 2014, when its 7 members were appointed, therefore only after publication of the draft budget. Due to the lack of a sufficient time to carry out a proper analysis of the draft budget, the CNFP decided not to provide an opinion on the 2015 draft budget. Luxembourg has significant deficiencies in terms of the regular publication of intra-annual fiscal statistics, which is an essential element for real-time monitoring of budgetary developments and for which minimum standards are established by the Directive. Most notably, Luxembourg is yet to publish monthly cash-based fiscal data for the central government and social security and quarterly cash-based fiscal data for the local government sub-sector.
The government published in the budget, in line with newly adopted provisions, a list of tax expenditure measures. However the publication is not sufficiently informative, as - in the absence of an official definition of fiscal expenditure - the government has chosen a rather narrow approach. In particular, the list includes only measures related to households and no measure about corporations is mentioned. In view of the announced reform of the fiscal system it appears opportune to have a set of information as complete as possible on all elements that could have an impact on the assessment about the distribution of the fiscal burden.
Long-term sustainability
Government debt (23.6% of GDP in 2013 and expected to rise to 25.1% of GDP in 2016) is currently well below the 60% of GDP threshold
2.1. Fiscal framework, long-term sustainability, pension and healthcare
12 laid down in the Treaty. According to the
Commission's calculation (5) based on the Winter 2015 economic forecast, government debt is projected to remain by 2025 under the threshold of 30% of GDP. Risks would be even lower in the event of the structural primary balance continuing to record the high values observed in the past, such as the average for the period 2004-13.(6) Finally, the budgetary impact of an ageing population poses a challenge to long-term fiscal sustainability, in particular in the area of pensions and long-term care.
Pension
Pension expenditure is expected to increase substantially in the coming decades (7), posing some risks as regard the long-term sustainability of the pension system. The last reform of the pension system was introduced in 2012, however it was limited in scope and did not substantially address the threat posed to the long-term sustainability of public finances. The reform addressed only partially the large gap between the statutory and the effective retirement age. Against a background of an effective-retirement age that stood at 58.9 in 2012 compared with the statutory retirement age fixed at 65, the reform maintained the possibility of early retirement at 57 or 60 (see Graph 2.1.1).
(5) Assessing public debt sustainability in EU Member States:
a guide”, European Economy Occasional Paper, no. 200, September 2014” for a presentation of the methodology used.
http://ec.europa.eu/economy_finance/publications/occasion al_paper/2014/op200_en.htm
(6) Eventually debt could be higher than estimated. The
projection is based on the general government deficit, However, in Luxembourg the structural surplus of the social security sector cannot be used to finance the deficit of the other government sub-sectors, meaning that new debt has to be issued even in the situation of primary surplus for the general government.
(7) According to the 2012 Ageing report the increase in
pension related expenditure in Luxembourg is projected to be the highest among all EU countries. Updated projections will be provided in the 2015 Ageing Report to be published in the first half of 2015.
Graph 2.1.1: Effective retirement age versus legal threshold, life expectancy
50 55 60 65 70 75 80 85 90 00 01 02 03 04 05 06 07 08 09 10 11 12 Average effective age of retirement-Women Average effective age of retirement-Men Life expentancy at 65-Total
Legal retirement threshhold
Source: European Commission, Oecd
The 2012 reform strengthened the link between
career length and longevity, proposing a
reduction of benefits in the event of a shortened career. The new calculation method (8), which will be implemented only gradually over the next 40 years, has changed the way the final amount of the pension is estimated, increasing the weight of the component linked to the years of contribution. In the end, jobholders would have to work only three years longer to receive the same benefit. As the replacement rate is very high, even for high wage earners, the incentives provided by the new law are not strong enough to convince people to work longer than the minimum required.
Currently, the short-term financing of the pension system is guaranteed by a low old-age dependency ratio and relies on the contributions paid by relatively young cross-border workers. It also means that with unchanged policies the active population will have to double every 30/40 years to keep the system sustainable.(9) While, the current system presents a lower risk of poverty for retired workers than in other countries, (10) it poses
(8) The retirement benefit is mainly based on two components:
a flat-rate amount contingent on years of coverage and an earnings-related amount.
(9) Opinion of the Trade Chamber of 6 April 2012.
(10) For people aged 65 and over the risk to be at poverty stood
2.1. Fiscal framework, long-term sustainability, pension and healthcare
some questions concerning inter-generational fairness.
The share of people exiting the labour market before reaching the statutory retirement age is rather stable since 2000 and stands at 75% of total number of new pensions (Graph 2.1.2) .
Graph 2.1.2: New pensions
0 1000 2000 3000 4000 5000 6000 7000 8000 9000 00 01 02 03 04 05 06 07 08 09 10 11 12 Old age
Early old age Invalidity
Source: Casse Nationale d'Assurance Pension (CNAP)
In line with the first principles laid down in its December 2013 programme, the government announced that further measures will be taken. In particular, it plans to: (1) provide additional incentives to postpone the retirement age and (2) enable a more gradual transition to retirement. Among other reform efforts, Luxembourg is working on overhauling the pre-retirement system, including by abolishing (11) the 'pre-retraite solidarité' scheme, reforming the reclassification system for people with work disabilities, and aiming at better regulation of supplementary pensions.
In this regard, it is appropriate to point out that pre-retirement is not be confused with early retirement. The early retirement pension is governed by social security law while pre-retirement schemes fall under labour law. Social security legislation and labour law provide for
(11) Measure n. 191 of the list of 258 measures attached to the
2015 consolidation package. .
different possibilities to exit the labour market and to retire before the legal age of 65 (see Box 2.1.1).
The impact of the current project to abolish the 'pre-retraite solidarité' scheme is estimated to be marginal as it involves a limited number of people each year. According to the last budget, savings are estimated at around EUR 5 million a year.
A proposal to reform the work incapacity scheme was introduced before the Parliament in March 2013. It aims, amongst other things, at providing active labour market solutions in contrast to a market exit programme. The proposal also contains provisions to ease the transition between the labour market and retirement. Partial old-age pensions, in combination with income from work, would allow people to make this
transition more flexibly and reduce the
redeployment procedure for early retirement. The financial impact of the reform is however not available.
The government also announced plans to extend the coverage of the occupation pillar scheme by revising the 1999 law regulating supplementary pensions. The extension would
apply to self-employed professional and
independent workers, andr to some categories of employees not affiliated with a company retirement scheme.
Finally, the government decided to advance by one year the monitoring and evaluation provided for under the law. Thus, in 2016, rather than in 2017, the General Social Security Inspectorate, designated as the supervisory authority, will present a new study on the plan’s financial position in the medium term. Based on these findings, other measures for financial consolidation (e.g. an increase in contribution rate or additional adaptation of benefits) could be discussed with the social partners.
2.1. Fiscal framework, long-term sustainability, pension and healthcare
14 Long-term care
Besides pensions, other age-related expenditure is projected to weight on the long-term sustainability of the public finances. Long-term care insurance is likely to be in deficit from 2015 onwards when the reserve is expected to fall below the legal minimum of 10% of the expenses. (12) Total expenses have risen from EUR 482.7 million in 2011 to the budgeted EUR 560 million in 2013.
The sustainability of the long-term care system is endangered by a lack of cost-effectiveness. In 2011, public spending on long-term care accounted for 1.3% of GDP (EU average of 1.9%). The number of dependent persons receiving benefits from the dependency insurance more than doubled
(12) According to the 2012 Ageing Report, the increase in
long-term care expenditure in Luxembourg is projected to be above the euro area average. Updated projections will be provided in the 2015 Ageing Report to be published in the first half of 2015.
from 2000 to 2010. Luxembourg has the highest availability of long-term care beds among all OECD countries. The number of long-term care beds increased by 9 % in the period 2000-11.
The announced reforms of long-term care have not yet been translated into legislation. Following a report in 2013, the government decided to reform long-term care insurance with the aim of providing persons in need of long-term care with an adequate level of services and securing the corresponding financing. To this end the report suggested to standardise the needs assessment procedure, to extend the electronic patient file to long-term care, to redefine the role of informal carers and link cash benefits more clearly with the services provided, to review the financial support for house adaptations and to strengthen the coordination between health and social care. The planned reforms could potentially improve the cost-effectiveness of the long-term care system.
Box 2.1.1: Early retirement schemes
According to the labour law, employees are eligible for pre-retirement under the following conditions:
1. At the end of the pre-retirement period they fulfil the conditions for obtaining the early old age pension or old age pension and,
2. All schemes apply only to the private sector, apart from the ‘Early retirement for shift workers and night workers ’, which also applies to public sector workers. Four types of pre-retirement are listed in the labour law (Article L.581-1 and following):
Pre-retraite solidarité: Under this scheme, the employer breaks the contract of employment with the employee and in return, he engages to pay a pre-retirement pension. The employer may receive a financial contribution from the state on condition of, at least, hiring a job applicant. It is reserved for employees of companies made eligible for early retirement support under a collective agreement or an agreement between the employer and the Minister of Labour and Employment.
Pre-retraite progressive: This scheme applies to employees working full-time. The employer agrees to transform the job from full-time to part-time and to pay some pre-retirement benefits. It is reserved for employees of a company made eligible for gradual early retirement under an express provision of a collective agreement or an agreement with the Minister of Labour and Employment and the company.
Pre-retraite ajustment: This scheme is a social measure; the employer may apply for admission of its staff for pension adjustment in the event of business closure or to avoid redundancies following the loss of jobs resulting from the company’s restructuring or the transformation following technological changes.
Pre-retraite des travailleurs postés et des travailleurs de nuit: This scheme applies to employees both from the private and public sector. It applies to employees justifying 20 years of shift work as part of a work organisation working in shifts or 20 years of work worked during the night.
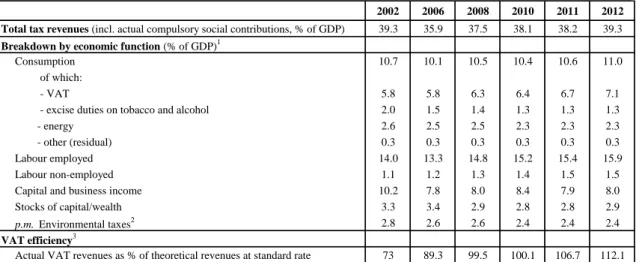
2.2. TAXATION SYSTEM
Features of the taxation system
In 2015, a change in VAT legislation with regard to the place of taxation for activities related to e-commerces entered into force.(13) It is estimated to shave around EUR 700 million or 1.5% of GDP from government revenues. Since 2003, several e-commerce operators have set their European headquarters in Luxembourg, mostly - but not only - to take advantage of its status as the country with the lowest VAT rate in the EU. Since
then, e-commerce business has increased
exponentially, and e-VAT revenues have increased from 0.2% of GDP in 2003 to 2.1% of GDP in 2013, see Graph 2.2.1.
Graph 2.2.1: Progression of e-VAT revenues
0 0.5 1 1.5 2 2.5 0 200 400 600 800 1000 03 04 05 06 07 08 09 10 11 12 13 % of GD P m il li on of e uro
Source: Administration de l'Enregistrement et des Domaines
To at least partially offset the above-mentioned loss, the government has decided to increase all VAT rates by 2 percentage points, except the super-reduced rate of 3%, as of 1 January 2015. (14) Overall, VAT receipts in 2015 are expected to decline by around 1.0% of GDP.
(13) From 1 January 2015, telecommunications, broadcasting
and electronic services will always be taxed in the country where the customer belongs – regardless of whether the customer is a business or consumer – regardless of whether the supplier based in the EU or outside. More information available at:
http://ec.europa.eu/taxation_customs/taxation/vat/how_vat _works/telecom/index_en.htm
(14) Ministry of Finance,
http://www.lequotidien.lu/politique-et-societe/54745.html
The overall proceeds from VAT collection are impacted by the extensive application of reduced rates and exemptions.(15) Findings suggest that the use of reduced VAT rates to achieve redistribution objectives are not an efficient and well-targeted tool to protect vulnerable people.(16) There has been some progress in broadening the tax base, in particular on consumption, given that Luxembourg decided to increase the super-reduced rate of 3% to the standard rate of 17% for all real estate investments, with the exception of the main residence. Moreover, the super-reduced rate of 3% no longer applies to the consumption of alcoholic beverages. Instead, the standard rate of 17% applies. In addition, preparatory work on a comprehensive tax reform (for entry into force in 2017) has been launched. This overall tax reform could contribute to rebalancing the tax base.
Luxembourg is frequently used by
multinational companies to channel tax-driven financial flows to other jurisdictions. Inward and
outward Foreign Direct Investments stock
exceeded 5000% and 6000% (17), respectively expressed as a share of GDP. Based on figures from the OECD (18), it appears that around 95% of the Foreign Direct Investments stocks are handled by special purpose entities (19).
Luxembourg is also characterised by a high private debt-to-GDP ratio, mainly in relation to non-financial corporations. This mainly reflects the presence of a large number of multinational firms that use their branches or subsidiaries in
(15) Luxembourg ranks first in the EU in terms of the number
of categories of goods and services covered by reduced VAT rates.
(16) European Commission (2014), 'The Belgian VAT rate
structure in need of reform', Country focus, available at: http://ec.europa.eu/economy_finance/publications/country_ focus/2014/cf-vol11_13_en.htm
(17) Inward and outward FDI stock amounted respectively to
more than EUR 2.300 billion and EUR 3000 billion in 2013.
(18) Source: OECD FDI Statistics database.
(19) In general terms, SPEs are entities with no or few
employees, little or no physical presence in the host economy, whose assets and liabilities represent investments in or from other countries, and whose core business consists of group financing or holding activities (OECD (2013) Addressing Base Erosion and Profit Shifting, OECD Publishing.)
2.2. Taxation system
16 Luxembourg for intra-group financing operations
(20), in the context of a tax optimisation strategy.
The corporate tax system came under public scrutiny at the end of 2014 in the wake of the
so-called LuxLeaks. This unprecedented
international investigation revealed that over 1 000 companies used complex structures of internal loans and interest payments involving subsidiaries in Luxembourg to reduce their global tax charges. The documents also revealed that 340 companies
had arranged specially designed corporate
structures subject to 'rulings',(21) which led to feeble taxation level. By a Decree adopted in December 2014, the Luxembourg authorities formally included the practice of advance tax rulings in the law to enhance transparency. It clarifies the procedure, including amongst other things, that 'the advance tax confirmations are published on an anonymous basis in the annual report of the direct tax authorities'. The new rules are applied to all applications introduced as from 1 January 2015 and to applications that were introduced before but were still pending on 1 January 2015.
In November 2013, the OECD 'Global Forum on Transparency and Exchange of Information on Tax Questions',(22) classified Luxembourg as 'non-compliant' with its standards regarding application of the international standard on exchange of information on request between tax
administrations. Following Luxembourg's
argument that the report did not take into account recent efforts a second evaluation by the Global Forum is scheduled by July 2015. Luxembourg has also committed to implement the new standard on automatic exchange of information by 2017.
(20) Macroeconomic imbalances - Luxembourg 2014
(COM(2014) provides more in-depth analysis on these issues; available at: http://ec.europa.eu/economy_finance/publications/occasion al_paper/2014/op183_en.htm.
(21) There have been 548 rulings involving 340 companies.
Subsequently, a further list of 35 other companies having concluded tax rulings with Luxemburg authorities was revealed.
(22) It is the multilateral framework within which work in the
area of transparency and exchange of information for tax purposes has been carried out by both OECD and non-OECD economies since 2000
Graph 2.2.2: Property taxation as % of GDP
0.0 0.5 1.0 1.5 2.0 2.5 00 01 02 03 04 05 06 07 08 09 10 11 12 LU EA18
Source: European Commission
Overall receipts from property taxation are lower than in the euro area (see Graph 2.2.2), and they trended down from 1.9% in 2000 to 1.3% in 2012. This is in contrast with the upward developments in the euro area where they increased from 1.7% of GDP to 2.1% of GDP. In particular, revenues from recurrent property taxes (0.1 % of GDP in 2012) are much lower than the +1.2% of GDP average in the euro area, (Graph 2.2.3). Moreover, the series shows a mild downward trend, a strikingly diverging pattern with respect to the (proxy of) the tax base (real estate prices). Indeed, the base on which recurrent property taxes are levied is the unit value of a property, which is still calculated according to a scale that dates back to 1941 and is not aligned with real current rental value. In addition, a low level of recurrent property taxation reduces the financial burden for housing investors to keep unused property and given the limited and constrained supply, it contributes to putting constant pressures on house prices.
2.2. Taxation system
Graph 2.2.3: Recurrent property taxation, % of GDP
0.0 0.2 0.4 0.6 0.8 1.0 1.2 1.4 00 01 02 03 04 05 06 07 08 09 10 11 12 LU EA18
Source: European Commission
Environmental taxation
Luxembourg had environmental tax revenues amounting to 2.4% of GDP in 2012, just in line with the EU-28 average (23), as compared with 3.1% of GDP in 2004. In common with many other Member States there is a lack of indexation of environmental taxes in Luxembourg, which would otherwise help maintain the influence these taxes exert on consumer behaviour and the level of revenue they bring per unit of GDP.(24) On the other hand, it is worth mentioning that revenues from transport fuel taxes are high compared to EU28 (2.2% against 1.4%), and that this is despite the relatively low excise duties (this being of course because of the cross-country fuel purchase).
Luxembourg was recommended to develop a comprehensive framework and take concrete measures to meet the 2020 targets for reducing greenhouse gas emissions from non-ETS activities, especially through the taxation of energy products for transports (see section 2.6). A feasibility study on this latter aspect is expected to be issued in the course of 2015. A general reform of the fiscal system (to be effective from 2017) is being prepared by the government, which shall
(23) EUROSTAT,
http://epp.eurostat.ec.europa.eu/tgm/table.do?tab=table&ini t=1&language=en&pcode=ten00065&plugin=0
(24) Tax Reforms in EU Member States 2014, European
Commission, p.97 & 99
also encompass the taxation of energy products for transport.
Another key challenge consist in the consistency of measures to modify taxation of energy products in line with the current international pressure for the reduction of environmentally harmful subsidies. As for Luxembourg, the main environmentally harmful subsidies to eliminate concerns the relatively low energy taxation duty for diesel and the total tax exemption for natural gas used as motor fuel. The share of new registered diesel cars in total cars is more than 70%, the highest among EU15 & EFTA countries.(25)
(25) Source: European Automobile Manufacturers Association
2.3. BANKING AND FINANCIAL STABILITY
18 Luxembourg’s financial sector weathered the
financial crisis of 2008-09 well, broadly due to the high degree of its diversification and its
limited links with the domestic economy.
Combined with the relatively small scale of the domestic banking sector, these features have helped to shield Luxembourg's financial centre from unfavourable developments in international markets, despite its prominent position.(26) Indeed, the majority of banks in Luxembourg are foreign and have negligible links with the resident
economy as they engage only in fund
administration, private banking, or act as a conduit for lending abroad (Graph 2.3.1).
Graph 2.3.1: Share of Domestic Banks (as % of Total Assets) 0% 10% 20% 30% 40% 50% 60% 70% 80% 90% 100% BE FR LU NL UK DE
% Domestic Banks in Total Assets % Foreign-controlled banks in Total Assets
Source: European Central Bank
As a result, the effect of the crisis on credit to the private sector has been largely contained. While access to private sector credit in the euro area was hindered in the aftermath of the financial crisis, no credit rationing was experienced in Luxembourg. Luxembourg's position as an important financial centre favours good financing
(26) Judged by the size of the total bank assets as a percentage
of GDP, Luxembourg’s financial sector (one-quarter of GDP) is the largest in the euro area and appears as an outlier. In absolute terms, however, the aggregate size of the banks’ balance sheets is smaller than in other European countries, such as the UK or Belgium.
conditions for enterprises, including SMEs, as reflected in the fact that smaller loans under EUR 1 million (taken out almost exclusively by SMEs) are the least expensive in the EU. Similarly, credit to households, mainly for housing acquisition purposes, has resumed its upward trend.
One prominent feature of Luxembourg's financial sector, which has contributed to its
exceptional performance, is its deep
diversification (Graph 2.3.2). Although the country is famous for its sophisticated and robust banking system, which displays healthy financial
soundness indicators, the asset management
industry is one of the largest specialisations of the financial sector. Indeed, the country has succeeded in establishing itself as one of the main providers
of fund domiciliation services worldwide,
generating huge positive externalities for the domestic economy. Moreover, the country is seeking to expand further the fund domiciliation
business by promoting European funds
internationally and by profiting from the internal market benefits inside the European Union. Although such actions might preserve the Luxembourg's leadership in this area, they are not likely to contribute to further promoting the diversification of the financial sector. In December 2012, Luxembourg was the first Member State to offer a regulatory framework for family offices targeted at developing this private banking activity.
The push for more transparency and the introduction of the automatic exchange of information are likely to weigh on private banking, but steps have been taken to support developments of this activity. Indeed, the sector is gradually adjusting to regulatory changes and increased competition from international financial
centres. Various initiatives indicate that
Luxembourg is becoming increasingly aware of the need to adjust its economic interests and national choices in line with international expectations. In 2009, Luxembourg signed up to the OECD standards on the exchange of financial information on request by competent foreign authorities. In April 2013, 10 years after the adoption of Directive 2003/48/EC on the taxation of interest income from savings, the authorities decided to end the transition period and to introduce, as of 1 January 2015, the automatic exchange of information in tax matters with