Procedia Computer Science 83 ( 2016 ) 1090 – 1095
1877-0509 © 2016 The Authors. Published by Elsevier B.V. This is an open access article under the CC BY-NC-ND license (http://creativecommons.org/licenses/by-nc-nd/4.0/).
Peer-review under responsibility of the Conference Program Chairs doi: 10.1016/j.procs.2016.04.228
ScienceDirect
The 6th International Symposium on Frontiers in Ambient and Mobile Systems
(FAMS 2016)
Semi-Supervised Statistical Approach for
Network Anomaly Detection
Naila Belhadj Aissa
a*, Mohamed Guerroumi
aa
University of Science and Technology Houari Boumediene, Algiers, Algeria
Abstract
Intrusion Detection Systems (IDS) have become a very important defense measure against security threats. In recent years, computer networks are widely deployed for critical and complex systems, which make them more vulnerable to network attacks. In this paper, we propose a two-stage Semi-supervised Statistical approach for Anomaly Detection (SSAD). The first stage of SSAD aims to build a probabilistic model of normal instances and measures any deviation that exceeds an established threshold. This threshold is deduced from a regularized discriminant function of Maximum Likelihood (ML). The purpose of the second stage is to reduce False Alarm Rate (FAR) through an iterative process that reclassifies anomaly cluster, from the first stage, using a similarity distance and anomaly’s cluster dispersion rate. We evaluate the proposed approach on the well-known intrusion detection dataset NSL-KDD and Kyoto 2006+. The experimental results show that SSAD outperforms the Naïve Bayes methods in terms of Detection Rate and False Positive Rate.
© 2016 The Authors. Published by Elsevier B.V.
Peer-review under responsibility of the Conference Program Chairs.
Keywords: Network Security, Anomaly Detection; Maximum Likelihood; chi-square statistic; NSL-KDD dataset ; Kyoto 2006+ dataset
* Corresponding author. Tel.: +213 554 779 601; fax: +0-000-000-0000 . E-mail address: [email protected]
© 2016 The Authors. Published by Elsevier B.V. This is an open access article under the CC BY-NC-ND license (http://creativecommons.org/licenses/by-nc-nd/4.0/).
1.Introduction
An intrusion is defined as “any set of actions that attempt to compromise the integrity, confidentiality or availability of a resource”1. An Intrusion Detection System (IDS) is a set of components and techniques that aim to
monitor network resources or computer activities in order to detect and react to any suspicious action.
IDSs are usually classified into two categories2, 3: i) Misuse-based and ii) Anomaly-based. Systems that use
misuse-base techniques need a database of known attacks’ signature (description) to match against observed activities or audit data. These systems provide very good detection results for specified well-known attacks. However, their inability to detect the unknown attacks is a major drawback. Anomaly-based systems, rely on models of normal behavior of the protected target, any deviation from this model is considered as suspicious. These systems are able to detect previously unknown attacks. However, the number of their false alarms is still high.
Several methods have been proposed to detect anomalies4
, some are based upon computational intelligence (evolutionary computation5, 6, artificial immune systems7…), others use pattern matching or rely on statistical approaches representing normal behavior8. These methods can be mainly grouped into three approaches: i)
unsupervised approach where intrusions are detected with no prior knowledge of a normal/attack behavior. ii)
Supervised approach where both normal and abnormal behaviors are modeled based on a pre-labeled data tagged as normal or abnormal. iii) In the third semi-supervised approach, only normal behavior is modeled using a pre-labeled data. The challenge of this last approach is to find an optimal discriminant function that can efficiently distinguish the target’s normal behavior from abnormal instances.
In this paper, we propose a two-stage Semi-supervised Statistical approach for Anomaly Detection (SSAD). In the first stage, we build a probabilistic model based on pre-labeled normal instances, and we classify as anomaly any deviation that exceeds a defined threshold. This threshold is deduced from the Maximum Likelihood (ML) function and the p-value of chi-square () distribution. We introduce, for optimization, a variance-covariance matrix‘s regularization coefficient into the ML function. To reduce the false alarm rate, we propose as second stage, an iterative process based on a similarity distance and the dispersion rate of first stage’s output classes.
The remainder of this paper is organized as follows: Section 2 presents some related work on statistical approaches for anomaly detection. Section 3 describes, in details, our proposed approach. Section 4 shows and discusses experimental results. We briefly conclude our work in Section 5.
2.Statistical Approaches for Anomaly Detection
Statistical approaches are commonly based on probabilistic models associated with training data. Several approaches to modeling normal and anomalous data have been applied to intrusion detection: Eleazar Eskin9 presented a mixture model based technique for detecting anomalies within a dataset that contains a large number of normal instances and relatively few anomalies. His approach uses machine-learning techniques to estimate a probability distribution over this dataset and applies a statistical test to detect anomalies. 10 presents an anomaly
detection technique based on a chi-square statistic for intrusion detection into information systems. The authors highlight the great computational cost when using Hotelling’s T² statistic and discussed the use of a distance
measure based on chi-square test statistic instead. Authors in 11 proposed a prototype of a network anomaly
detection system, with hierarchical architecture, that uses statistical models and neural network classifiers to detect intrusions. Data are gathered from network traffic, system logs as well as hardware reports. In 12, authors discussed
the use of a multivariate statistical analysis of audit trails for host-based intrusion detection. They also discussed and compared the performance of Hotelling’s T² test and chi-squared test. 13 proposes a statistical processing unit,
that utilize application specific knowledge of the network services, to detect anomalous network traffic, specifically the less frequent attacks such as R2L and U2R. A metric is developed which allows the system to automatically search identical characteristics of different service requests. Where authors in 14 used Kolmogorov-Smirnov
statistics to model and detect DoS as well as probing attacks. Authors in 15 proposed an approach based on Adaptive
Bayesian Algorithm (ABA) for anomaly intrusion detection and compared it with Naïve Bayesian Algorithm using KDD99 dataset. Krueggel and al. 16 suggested an event classification scheme based on Bayesian networks to
mitigate two main reasons for large false alarm. According to them, the first reason is the simplistic aggregation of model outputs in the decision phase. The second reason is the lack of integration of additional information into the
decision process. The approach in 17 flows multiple steps. First, Kalman filter is performed on raw data. Then a Gaussian Mixture Model (GMM) is built, since authors assumed that the real distribution is a mixture of normal densities. Hidden Markov Model is, after that, applied to find the temporal dependencies above the different Gaussian components. Finally, Viterbi algorithm is used to detect anomalous events.
Our work presented in this paper is strongly related to those cited above to the extent that statistical methods are applied. However, our approach slightly differs from theirs as we build a statistical model from normal instances only and consider instances of the rejected class as attacks. To improve the decision rule, we introduced regularization into the discriminant function of Maximum Likelihood.
3. Proposed approach
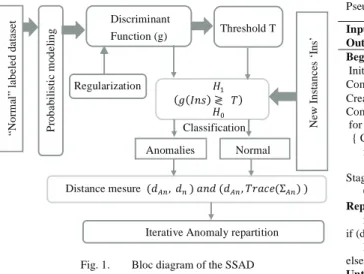
The main idea is to build a model representing the normal instances from which we define a discriminant function. A new instance is identified as anomaly if it does not comply with the predefined pattern under the hypothesis Null Ho and the alternative H1, regarding a threshold T. Instances identified as anomaly are then reclassified under some conditions based on a similarity distance and anomaly class’s dispersion. Fig.I. and pseudocode.1. illustrate the block diagram of the process’s main steps and the corresponding pseudocode.
3.1.Discriminant Function
Let
be an instance featured by n attributes. Attribute’s value of this instance are assumed to be possible values from a random variable whose conditional density function is given by .
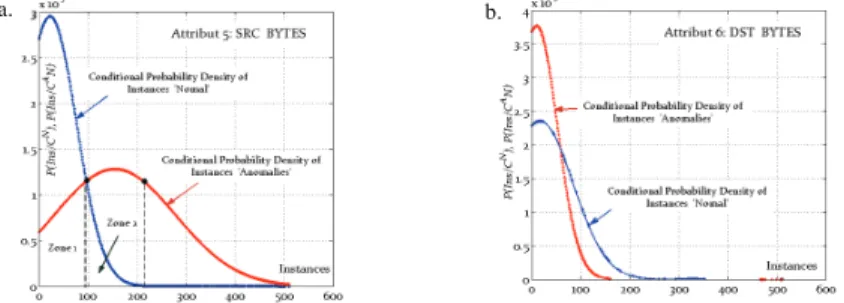
Considering a unidimensional case, Fig.II.a shows the probability density of the attribute “src_bytes” in nsl-kdd dataset. The overlapping zones of the two distributions are indicators of instances’ separability. This overlap is even more pronounced in fig.II.b whose probabilities are calculated on the attribute “dst_bytes” of a subset with higher detection difficulty.
Furthermore, knowing the class , we can calculate the a posteriori probability expressed by
Bayes rule 18 and given as follow : ) (1)
Where is the a priori probability of normal instances.
The posteriori probability gives the likelihood that the instance belongs to the class. In the general case, the
logarithmic expression of is given by:
(2) “N or m al ” la be le d d ata se t Threshold T Discriminant Function (g) Ne w In st an ce s ‘In s’ Anomalies Normal Regularization
Iterative Anomaly repartition Distance mesure P ro ba bi lis ti c m od elin g Classification
Fig. 1. Bloc diagram of the SSAD
Pseudocode.1. SSAD
Input : TrainDatasetNormal, TestDataset Output: TestDatasetLabeled
Begin
Initialize parameters : precision , , Compute ,
Create the Discriminant Function Compute the threshold T
for each instance inst in TestDataset { Compute
if ( inst is labeled “normal” else inst is labeled “anomaly” } Stage 2 :
Compute ,
Repeat
for each instance inst in anomaly cluster
if (d(inst, d(inst, ) && d(inst, ) label inst as « anomaly »
else label inst as « normal » Until number of changed label < 5 End
Where represents the discriminant function.
The decision rule in a multiclass case is as follows:
We assume that the data follows a multivariate Gaussian distribution. In this case, the discriminant function shall be as follows:
Where is mean vector and is the variance-covariance matrix.
To handle non-modeled instances and make the process semi-automatic, we introduce threshold verification in the decision rule. The goal of using threshold is to create an anomaly class with this decision rule:
(4)
From equations 3 and 4, we may put:
The expression follows a chi square distribution with n degree of freedom. Threshold
expression becomes:
(5)
3.2. Regularization
The accuracy of the detection in the first step depends mainly on the discriminant function of normal instances. It relies on the representativeness of the variance-covariance matrix of “normal” cluster. In order to optimize this function, we introduced regularization for with the overall matrix variance-covariance. The regularization
term is given by: , where is a weighting parameter and. Two clusters result from the first detection phase.
3.3. Iterative Anomaly repartition
In order to reduce false alarm rate, we added an iterative process that reclassifies first stage’s anomaly cluster. Each instance in this cluster will either be kept as “anomaly” or relabeled as “normal”.
Let and be the mean of normal and anomaly clusters respectively. is the variance of anomaly cluster. An instance inst is labeled as anomaly if, and only if, distance ( is smaller than distance) and distance (is smaller than trace(). Otherwise, inst is labeled as
normal. The process is repeated until a stable configuration is met (no changing labels). 4. Experimental Results and Discussion
4.1. Datasets
Experiments were carried out using NSL-KDD19 and Kyoto 2006+ 20 datasets.
a. b.
4.1.1. NSL-KDD
NSL-KDD dataset is the refined version of KDDcup99 known for some deficiencies mentioned in 21. It has numerous advantages over the original KDD data set like the absence of redundant records or the estimation of the difficulty level of each instance.
The dataset contains a large volume of network TCP connections, the results of 5 weeks of capture in the Air force network. Each connection consists of 41 attributes plus a label of either normal or a type of attack. Simulated attacks fall into one of the four following categories 5 DOS, U2R, R2L or PROBE.
4.1.2. Kyoto 2006+
Kyoto 2006+ dataset is built on 3 years of real traffic data (from Nov. 2006 to Aug. 2009) which are obtained from diverse types of honeypots in Kyoto University22. It consists of 14 statistical features derived from KDD Cup 99’ dataset as well as 10 additional features to further analyse and evaluate network IDSs23. Traffic was collected to/from 348 honeypots deployed inside and outside of Kyoto University. All traffic was thoroughly inspected using three security softwares: SNS7160 IDS, Clam AntiVirus, Ashula and since Apr.2010, snort was added. We used in our experiments traffic data from 2009 captures.
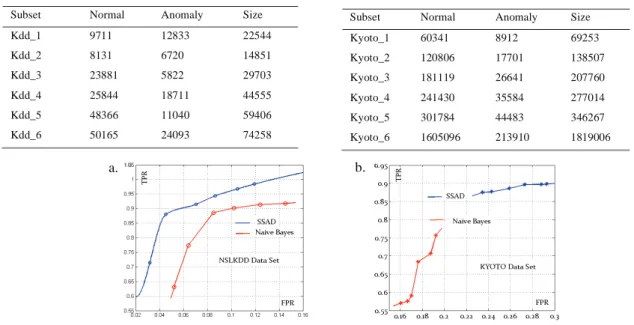
Table.1 and Table.2 describe the composition of multiple subsets, from the data described above, used to test and compare SSAD to other statistical methods.
4.2. Experimental Results
Experiments were carried out using Windows® 8-64 bit operating system with core i7 processor running at 2.40 GHz and 8 GB RAM. The first phase parameters were set to: = 0.8, =0.6, ε (precision) =80%. These values were chosen after several tests and were selected to be those that give the best results.
The accuracy of any intrusion detection system is determined by true positive rate ) and false positive rate ( ). The detection rate is expected to be as high as possible, while the false positive rate is expected to be as low as possible.
As can be seen in fig.III, SSAD outperforms Naïve Bayes in terms of TPR and FPR. Even though, Kyoto 2006+ dataset is more challenging than nslKDD, which was created more than a decade ago.
Table 1. Experimental subsets of NSL-KDD
Subset Normal Anomaly Size
Kdd_1 9711 12833 22544 Kdd_2 8131 6720 14851 Kdd_3 23881 5822 29703 Kdd_4 25844 18711 44555 Kdd_5 48366 11040 59406 Kdd_6 50165 24093 74258
Table 2. Experimental subsets of Kyoto 2006+
Subset Normal Anomaly Size
Kyoto_1 60341 8912 69253 Kyoto_2 120806 17701 138507 Kyoto_3 181119 26641 207760 Kyoto_4 241430 35584 277014 Kyoto_5 301784 44483 346267 Kyoto_6 1605096 213910 1819006 b. a.
5.Conclusion
In this paper, we present a semi-supervised statistical approach for network anomaly detection (SSAD). The first step of the approach is to build a model of normal instances, a threshold is then established and a classification is made based on H0 and H1 hypothesis. A second step is proposed to reduce the false positive rate. It consists on reclassifying anomaly instances (from the first step) using a similarity distance and anomaly class’s dispersion. Comparative tests using nslKDD and Kyoto 2006+ datasets show that this approach has promising results. As future work, we plan to explore other probabilistic distribution, consider the online detection and evaluate our solution using more challenging datasets.
References
1. D.E. Denning, 'An Intrusion-Detection Model', Software Engineering, IEEE Transactions on (1987), 222-32. 2. S. Axelsson, 'Intrusion Detection Systems: A Survey and Taxonomy', (Technical report, 2000).
3. S.H. Amer, and J. Hamilton, 'Intrusion Detection Systems (Ids) Taxonomy-a Short Review', Defense Cyber Security, 13 (2010). 4. A. Mohiuddin, M.A. Naser, and H. Jiankun, 'A Survey of Network Anomaly Detection Techniques', Journal of Network and Computer
Applications, 60 (2016), 19-31.
5. N. Belhadj Aissa, and M. Guerroumi, 'A Genetic Clustering Technique for Anomaly-Based Intrusion Detection Systems', in Software Engineering, Artificial Intelligence, Networking and Parallel/Distributed Computing (SNPD), 2015 16th IEEE/ACIS International Conference on (IEEE, 2015), pp. 1-6.
6. S.X. Wu, and W. Banzhaf, 'The Use of Computational Intelligence in Intrusion Detection Systems: A Review', Applied Soft Computing, 10 (2010), 1-35.
7. J. Kim, P.J. Bentley, U. Aickelin, J. Greensmith, G. Tedesco, and J. Twycross, 'Immune System Approaches to Intrusion Detection–a Review',
Natural computing, 6 (2007), 413-66.
8. M. Markou, and S. Singh, 'Novelty Detection: A Review—Part 1: Statistical Approaches', Signal processing, 83 (2003), 2481-97. 9. E. Eskin, 'Anomaly Detection over Noisy Data Using Learned Probability Distributions', (2000).
10. N. Ye, and Q. Chen, 'An Anomaly Detection Technique Based on a ChiSquare Statistic for Detecting Intrusions into Information Systems',
Quality and Reliability Engineering International, 17 (2001), 105-12.
11. Z. Zhang, J.Li, C. Manikopoulos, J. Jorgenson, and J. Ucles, 'Hide: A Hierarchical Network Intrusion Detection System Using Statistical Preprocessing and Neural Network Classification', in Proc. IEEE Workshop on Information Assurance and Security (2001), pp. 85-90. 12. N. Ye, S.M. Emran, Q. Chen, and S. Vilbert, 'Multivariate Statistical Analysis of Audit Trails for Host-Based Intrusion Detection',
Computers, IEEE Transactions on, 51 (2002), 810-20.
13. C. Krügel, T. Toth, and E. Kirda, 'Service Specific Anomaly Detection for Network Intrusion Detection', in Proceedings of the 2002 ACM symposium on Applied computing (ACM, 2002), pp. 201-08.
14. J.B. Caberera, B. Ravichandran, and R.K. Mehra, 'Statistical Traffic Modeling for Network Intrusion Detection', in Modeling, Analysis and Simulation of Computer and Telecommunication Systems, 2000. Proceedings. 8th International Symposium on (IEEE, 2000), pp. 466-73. 15. D.M. Farid, and M.Z. Rahman, 'Learning Intrusion Detection Based on Adaptive Bayesian Algorithm', in Computer and Information
Technology, 2008. ICCIT 2008. 11th International Conference on (IEEE, 2008), pp. 652-56.
16. C. Kruegel, D. Mutz, W. Robertson, and F. Valeur, 'Bayesian Event Classification for Intrusion Detection', in Computer Security Applications Conference, 2003. Proceedings. 19th Annual (IEEE, 2003), pp. 14-23.
17. J. Ndong, and K. Salamatian, 'A Robust Anomaly Detection Technique Using Combined Statistical Methods', in Communication Networks and Services Research Conference (CNSR), 2011 Ninth Annual (IEEE, 2011), pp. 101-08.
18. R.O. Duda, and P.E. Hart, Pattern Classification and Scene Analysis. Vol. 3 (Wiley New York, 1973). 19. 'The Nsl-Kdd Data Set', <https://web.archive.org/web/20150205070216/http://nsl.cs.unb.ca/NSL-KDD/>2015]. 20. 'Traffic Data from Kyoto University's Honeypots', <http://www.takakura.com/Kyoto_data/data/>2015].
21. M. Tavallaee, E. Bagheri, W. Lu, and A.-A. Ghorbani, 'A Detailed Analysis of the Kdd Cup 99 Data Set', in Proceedings of the Second IEEE Symposium on Computational Intelligence for Security and Defence Applications 2009 (2009).
22. J. Song, H. Takakura, Y. Okabe, M. Eto, D. Inoue, and K. Nakao, 'Statistical Analysis of Honeypot Data and Building of Kyoto 2006+ Dataset for Nids Evaluation', in Proceedings of the First Workshop on Building Analysis Datasets and Gathering Experience Returns for Security (ACM, 2011), pp. 29-36.