________________________________
Impact Evaluation of the Fresh Fruit and Vegetable
Program with Michigan Harvest of the Month
in Schools (Grades K-8)
________________________________
Prepared for the
Michigan Fitness Foundation
byThe Public Health Institute
____________
November 12, 2014
____________
Principle Report Author: Angie Jo Keihner, MS
Acknowledgements: We thank the Michigan Fitness Foundation staff members Dr.
Marci Scott, PhD, RD; Sarah Jones, MS, RD; and Jaime Rahrig, RD for their guidance, coordination and feedback. We also thank Public Health Institute staff Barbara MkNelly, MS; Suzanne Ryan-Ibarra, MS, MPH; Danielle Ewing, MPH; and Sharon Sugerman, MS, RD, FADA for their guidance and feedback.
Funded in part by U.S. Department of Agriculture Supplemental Nutrition Assistance Program (SNAP) through the State of Michigan and the Michigan Fitness Foundation. These institutions are equal opportunity providers and employers. For food help contact the toll free Michigan Food Assistance Program Hotline: (855) ASK-MICH.
TABLE OF CONTENTS _______________________________________________________________________ EXECUTIVE SUMMARY ... 6 INTRODUCTION ... 8 METHODS ... 10 FINDINGS ... 16 STUDENT SURVEY ... 20 PARENT SURVEY ... 31 TEACHER SURVEY ... 34
FRESH FRUIT AND VEGETABLE PROGRAM ADMINISTRATOR SURVEY ... 48
ENVIRONMENTAL ASSESSMENT TOOL ... 52
STUDY STRENGTHS AND LIMITATIONS ... 62
CONCLUSIONS AND RECOMMENDATIONS ... 64
REFERENCES ... 66
TABLE LISTING
TABLE 1: SCHOOL RECRUITMENT ... 11
TABLE 2: TEACHER RECRUITMENT ... 12
TABLE 3: CHARACTERISTICS OF SCHOOLS IN THE INTERVENTION AND CONTROL GROUPS ... 17
TABLE 4: STUDENT RECRUITMENT AND PARTICIPATION ... 18
TABLE 5: CHARACTERISTICS OF 4TH AND 5THGRADE STUDENTS INCLUDED IN THE INTERVENTION AND CONTROL GROUPS ... 19
TABLE 6: FRUIT AND VEGETABLE CONSUMPTION (TIMES/YESTERDAY) AT BASELINE AND FOLLOW-UP ... 20
TABLE 7: PEER AND SOCIAL NORMS,PERCEIVED MODELING,INTENTIONS, AND LIKING FOR FRUIT,MEAN SCORE . 22 TABLE 7A: PEER AND SOCIAL NORMS,PERCEIVED MODELING,INTENTIONS, AND LIKING FOR FRUIT, PERCENT WHO REPORT AGREEING ... 23
TABLE 8: PEER AND SOCIAL NORMS,PERCEIVED MODELING,INTENTIONS, AND LIKING FOR VEGETABLES, MEAN SCORE ... 24
TABLE 8A: PEER AND SOCIAL NORMS,PERCEIVED MODELING,INTENTIONS AND LIKING FOR VEGETABLES, PERCENT WHO REPORT AGREEING ... 25
TABLE 9: PREFERENCES FOR FRUITS AND VEGETABLES,MEAN SCORE ... 26
TABLE 10: FRUIT AND VEGETABLE AVAILABILITY AT HOME,MEAN SCORE ... 27
TABLE 10A: FRUIT AND VEGETABLE AVAILABILITY AT HOME,PERCENT REPORTING ALWAYS ... 27
TABLE 11: FRUITS AND VEGETABLES READY-TO-EAT FOR SNACKS AT HOME,MEAN SCORE ... 28
TABLE 11A: FRUITS AND VEGETABLES READY-TO-EAT FOR SNACKS AT HOME,PERCENT REPORTING EVERY DAY .... 28
TABLE 12: FRUIT AND VEGETABLE BEHAVIORS AT HOME,PERCENT REPORTING YES ... 30
TABLE 13: CHILD FRUIT AND VEGETABLE BEHAVIORS AT HOME REPORTED BY PARENTS ... 31
TABLE 14: PERSONAL FRUIT AND VEGETABLE BEHAVIORS AT HOME REPORTED BY PARENTS ... 32
TABLE 14A: HOUSEHOLD FRUIT AND VEGETABLE BEHAVIOR CHANGES REPORTED BY PARENTS ... 33
TABLE 15: USE OF THE MIHOTMFAMILY NEWSLETTER REPORTED BY PARENTS ... 33
TABLE 16: NUMBER OF MINUTES PER MONTH TEACHERS SPEND USING THE MIHOTMMATERIALS WITH THEIR CLASS ... 35
TABLE 17: NUMBER OF TEACHERS USING MIHOTMACTIVITIES FROM THE EDUCATOR NEWSLETTER AND AVERAGE NUMBER OF FEATURED PRODUCE USED FOR EACH ACTIVITY ... 36
TABLE 18: NUMBER OF TEACHERS FEATURING MIHOTMPRODUCE AND AVERAGE NUMBER OF ACTIVITIES IMPLEMENTED FOR EACH FEATURED PRODUCE ITEM ... 37
TABLE 19: NUMBER OF TEACHERS DISTRIBUTING THE MIHOTMFAMILY NEWSLETTER FOR STUDENTS TO TAKE HOME ... 37
TABLE 20: MIHOTMMATERIALS THAT TEACHERS REPORTED USING IN THEIR CLASS ... 38
TABLE 21: NUMBER OF MINUTES PER MONTH TEACHERS SPEND USING OTHER NUTRITION EDUCATION MATERIALS WITH THEIR CLASS ... 38
TABLE 22: LEVEL OF CONFIDENCE WITH THE MIHOTMPROGRAM AND RESOURCES REPORTED BY INTERVENTION TEACHERS ... 41
TABLE 23: LEVEL OF SATISFACTION WITH THE MIHOTMMATERIALS REPORTED BY INTERVENTION TEACHERS ... 41
TABLE 25: DESCRIPTION OF TEACHER OR SCHOOL POLICY TO GUIDE THE TYPES OF FOODS AND BEVERAGES
GIVEN TO SCHOOL STUDENTS AT CLASS CELEBRATIONS TO ENCOURAGE HEALTHY OPTIONS ... 44
TABLE 26: DESCRIPTION OF HOW TEACHERS ENCOURAGE PARENTS TO BRING FRUITS AND VEGETABLES FOR CLASS CELEBRATIONS ... 44
TABLE 27: ENCOURAGING STUDENTS TO BRING FRUITS AND VEGETABLES AS CLASSROOM SNACKS ... 45
TABLE 28: PROVIDING FOODS OR BEVERAGES TO REWARD STUDENTS OR THE CLASS ... 45
TABLE 29: DESCRIPTION OF THE FOODS OR BEVERAGES THAT TEACHERS GIVE TO STUDENTS OR THEIR CLASS AS REWARDS ... 46
TABLE 30: SCHOOLS WITH A FRUIT OR VEGETABLE GARDEN THAT STUDENTS CAN USE ... 46
TABLE 31: SCHOOL DISTRICTS OR SCHOOLS WITH AN ONGOING SCHOOL WELLNESS COMMITTEE THAT MAKES NUTRITION OR EXERCISE RECOMMENDATIONS FOR STUDENTS ... 47
TABLE 32: DESCRIPTION OF OTHER NUTRITION EDUCATION AND PHYSICAL ACTIVITY PROMOTION MATERIALS THAT MFFCOULD PROVIDE TO ENCOURAGE KIDS TO BE MORE ACTIVE AND EAT MORE FRUITS AND VEGETABLES ... 47
TABLE 33: ROLES FFVPADMINISTRATORS PLAY IN THE GRANT IMPLEMENTATION ... 48
TABLE 34: NUMBER OF ADMINISTRATORS REPORTING THAT SCHOOLS SERVE THE MIHOTMFEATURED PRODUCE AS THE FFVPSNACK ... 50
TABLE 35: NUMBER OF TIMES EACH MIHOTMFEATURED PRODUCE WAS SERVED AS THE FFVPSNACK DURING THE SCHOOL YEAR ... 50
TABLE 36: NUMBER OF SCHOOLS THAT HAVE A SALAD BAR ... 52
TABLE 37: NUMBER OF DAYS PER WEEK THE STUDENTS WERE OFFERED THE SALAD BAR ... 52
TABLE 38: LOCATION WHERE THE FFVPSNACK WAS SERVED TO STUDENTS ... 53
TABLE 39: TYPE OF STAFF SUPPORT FOR SERVING THE FFVPSNACK TO STUDENTS ... 53
TABLE 40: NUMBER OF SCHOOLS WHERE SCHOOL PERSONNEL ENCOURAGE STUDENTS TO EAT THE FVVPSNACKS ... 54
TABLE 41: NUMBER OF SCHOOLS WHERE SCHOOL PERSONNEL ENCOURAGE STUDENTS TO EAT FRUITS AND VEGETABLES IN THE LUNCH LINE ... 54
TABLE 42: NUMBER OF SCHOOLS WHERE SCHOOL PERSONNEL ENCOURAGE STUDENTS TO EAT FRUITS AND VEGETABLES AT LUNCH TABLES ... 54
TABLE 43: NUMBER OF SCHOOLS THAT PROVIDE FRUIT AND VEGETABLE TASTE TESTING IN THE CAFETERIA ... 55
TABLE 44: NUMBER OF SCHOOLS WITH A SCHOOL GARDEN THAT GROWS FRUITS AND VEGETABLES ... 55
TABLE 45: NUMBER OF SCHOOLS WITH A SCHOOL FOOD SERVICE DEPARTMENT ACTIVELY INVOLVED IN THE PLANNING AND DELIVERY OF NUTRITION EDUCATION ... 55
TABLE 46: NUMBER OF SCHOOLS THAT PROMOTED THE MIHOTMFEATURED FRUITS AND VEGETABLES OTHER THAN THE NUTRITION EDUCATION DONE BY TEACHERS IN THE CLASSROOM ... 56
TABLE 47: NUMBER OF SCHOOLS THAT IMPLEMENTED SMARTER LUNCHROOM STRATEGIES IN THE CAFETERIA ... 57
TABLE 48: NUMBER OF SCHOOLS WITH A SCHOOL WELLNESS COMMITTEE ENGAGED IN MAKING NUTRITION RECOMMENDATIONS FOR STUDENTS ... 58
TABLE 49: NUMBER OF SCHOOLS THAT IMPLEMENTED NUTRITION-RELATED RECOMMENDATIONS FOR FRUITS AND VEGETABLES IN THE SCHOOL WELLNESS POLICY ... 58
TABLE 50: NUMBER OF SCHOOLS WITH DINING AREA NUTRITION PROMOTIONS ... 59
TABLE 51: NUMBER OF SCHOOLS WITH NON-DINING AREA NUTRITION PROMOTIONS ... 60
Executive Summary
Background. The Michigan Fitness Foundation (MFF) is collaborating with the
Michigan Department of Education in Fresh Fruit and Vegetable Program (FFVP) school sites to implement the Michigan Harvest of the Month (MiHOTM) program. The MiHOTM and FFVP snack intervention aims to coordinate the delivery of the FFVP snack with nutrition education in schools to increase fruit and vegetable (FV) intake among children in order to promote healthy growth, development, and academic achievement. MiHOTM is funded by USDA’s Supplemental Nutrition Assistance
Program Education (SNAP-Ed) for low-income families. Its primary mandate is to serve families living in households with income at or below 185 percent of the federal poverty level. The current study was designed to evaluate the extent to which participation in the MiHOTM and FFVP snack intervention improves FV intake and related psychosocial
factors among 4th and 5th grade students attending low-resource public schools,
compared to students in similar control schools. The intervention took place in 14 schools in Michigan and consisted of teacher-administered nutrition education activities in classrooms, cafeteria-based promotions, and parent education materials.
Study Methods. A quasi-experimental intervention/control design was used to evaluate
the impact of the MiHOTM and FFVP snack intervention among 4th and 5th grade
students. The primary outcome was FV intake. Schools eligible to participate in the study met the following criteria: 1) 50 percent or more students enrolled in the free and reduced-price meal program; and 2) were not participating in any other SNAP-Ed nutrition intervention programs. During the 2013 to 2014 school year, 18 schools serving grades K-8 (14 intervention schools; 4 control schools) from six school districts
in Michigan with 68 4th and 5th grade classrooms (49 intervention; 19 control)
participated in the study. A sample size of 25 schools with 100 classrooms per group was needed to detect a 0.4 times per day difference in the change in FV consumption between the control and intervention groups. The final student sample included 1,062
4th and 5th grade children (683 intervention; 379 control).
Compensation (from private funds) was offered to key stakeholders who participated in the study. All teachers were provided with nutrition education materials valued up to $50 following the study. Teachers who complete all of the activities in their commitment letter were also entered into a drawing to receive a $100 gift card. FFVP Administrators who worked with intervention schools and families who completed and returned the Healthy Homework assignment (parent survey) were entered into a drawing to win a $25 gift card.
The following methods and study instruments were used to collect data:
Student Survey: A 4-page pre/post Scantron® survey was administered to
students that included questions on FV consumption, intentions, preferences, liking, peer and social norms, perceived modeling, home activities, and
individual-level demographics (age, gender, and race/ethnicity). Students were surveyed at baseline (December 2013 to February 2014) and again following the intervention (May to June 2014).
Parent Survey: Parents were surveyed retrospectively (April to June 2014)
through a take-home, paper Scantron® survey (called Healthy Homework) to
determine any changes that occurred at the family/household level including perceived FV intake; snack choices; cooking and shopping practices; use of nutrition labels; and availability of FV in the home.
Teacher Survey: All teachers were asked questions about nutrition education
practices in the classroom and nutrition policies and practices at the school (May to June 2014). Intervention teachers were also asked about the implementation of MiHOTM nutrition education in the classroom.
FFVP Administrator Survey: FFVP Administrators for intervention schools
participating in this study were asked questions about the administration of the FFVP snack, coordination with MiHOTM nutrition education, and related school practices (June 2014).
Environment Assessment Tool: Food and nutrition factors related to the school
environment were observed and a school administrator was asked questions about school policies and practices in both the intervention and control schools (March to June 2014).
All data analyses were performed using SAS 9.3/9.4 and SPSS 22. Multivariate linear and logistic regression models were used and cluster design effects and demographic factors were controlled for in the analyses. Means, standard deviations, and frequencies were also computed.
Main Findings. Students who participated in the MiHOTM and FFVP snack intervention
reported a non-significant increase in FV consumption of 0.08 times per day more at follow-up than control students, whose intake decreased from baseline to follow-up. For students participating in the MiHOTM and FFVP snack intervention there was a
significant increase in peer norms for eating fruit. The MiHOTM and FFVP snack intervention also appeared to improve children’s confidence with respect to preparing fruit with intervention students reporting that they prepared recipes with fruit at home.
Conclusions. MiHOTM and FFVP snack intervention had a limited impact on children’s
daily FV consumption, but improved peer norms for eating fruit and promoted the preparation of recipes with fruit at home. These findings indicate that MiHOTM and FFVP snack intervention has beneficial impacts on the psychosocial factors that
mediate FV intake. More research is needed on strategies for engaging and supporting school staff to deliver effective nutrition education interventions that complement the FFVP snack.
Introduction
Background and Significance
School-aged children in the U.S. eat an abundance of nutrient-poor, energy-dense
foods, and few consume adequate amounts of FV and other nutrient-rich foods.1,2 The
USDA Dietary Guidelines call for a shift to a diet that focuses on nutrient-rich foods such
as FV, rather than energy-dense, nutrient-poor foods.3 These guidelines promote
improving the overall nutritional quality of individuals’ diets, ultimately lowering total caloric intake. The USDA’s Fresh Fruit and Vegetable Program (FFVP) works to address the inadequate consumption of FV among children by providing free fresh FV
snacks during the school day at low-resource schoolsserving grades K-8. Coupling this
direct access to fresh FV with nutrition education is essential for children in order for them to understand and establish lifelong healthy eating habits. Interventions designed to improve children’s nutrition knowledge, attitudes, and behaviors are critical since poor eating behavior is an underlying cause of obesity, the nation’s greatest public health threat. Schools offer many opportunities to provide children with the education they
need to establish lifelong healthy behavior patterns.4
The Michigan Fitness Foundation (MFF) is collaborating with the Michigan Department of Education in Fresh Fruit and Vegetable Program (FFVP) school sites to implement the Michigan Harvest of the Month (MiHOTM) program. This collaboration reached approximately 80,000 students during the 2013 to 2014 school year in low-resource schools where at least 80% of the students qualify for the free and/or reduced-price school meal program. During the 2013 to 2014 school year, there were 156 schools awarded to participate in the FFVP, and many of these schools also opted to receive MiHOTM materials for classroom teachers and cafeterias.
An introduction to MiHOTM for FFVP Administrators serving as the food service liaison for the schools (either child nutrition directors or school administrators) took place on
August 19, 2013during MDE’s training of FFVP administrators. The FFVP Administrator
introduction included the expectations for the nutrition directors including 1) to order and distribute monthly packages with MiHOTM resources containing the Educator
Newsletter to all interested classroom teachers in their buildings for use with students, 2) to feature menu items in the cafeteria that relate to the featured fruit or vegetable, 3) to serve the featured fruit or vegetable as a snack option at least one time per month with the funds provided by the FFVP, and 4) to promote the featured fruit or vegetable in the cafeteria with posters and menu slicks. The MiHOTM child nutrition director training guide, “How to Grow Healthy Students,” was available online to provide FFVP
Administrators with ideas on how to implement MiHOTM at schools. A brief online
training was also developed for intervention teachers to provide them with an orientation to the MiHOTM materials and implementation strategies.
This study was funded by the United States Department of Agriculture Supplemental Nutrition Assistance Program Education (SNAP-Ed), Michigan Department of Human Services, through a contract with the MFF and administered by the Public Health Institute in collaboration with MFF.
Purpose of the Impact Evaluation
The purpose of this impact evaluation was to assess the changes in FV intake and related psychosocial factors (intentions, preferences, liking, peer and social norms, perceived modeling, home activities) among 4th and 5th grade students from schools
serving low-income families in Michigan exposed to the FFVP only† and the FFVP
combined with MiHOTM nutrition education compared to similar control students receiving neither FFVP or MiHOTM during the 2013 to 2014 school year. In addition, a take-home retrospective parent survey was used to determine any changes that
occurred at the family/household level including perceived FV intake, snack choices, cooking and shopping practices, use of nutrition labels, and availability of FV in the home.
Research Questions
The primary research question was: do students exposed to MiHOTM and FFVP snack intervention report significantly higher levels of FV consumption compared to those not exposed to the intervention. Also evaluated as secondary outcomes were psychosocial factors (intentions, preferences, liking, peer and social norms, and perceived modeling)
known to mediate FV consumption among children,5 and supportive family and
household nutrition practices (snack choices, cooking and shopping practices, and availability of FV in the home) that promote FV intake. We hypothesized that implementing MiHOTM and FFVP snack intervention would improve perceived modeling, dietary intentions, norms, liking, preferences for FV, as well as family and household nutrition practices; which in turn would lead to increased FV consumption by children.
Intervention Components
The FFVP with MiHOTM intervention schools were provided with a list of intervention expectations to complete in order to participate in the study. These intervention components included the following. The FFVP with MiHOTM intervention schools
received fresh FV as a snack option at least twice a week with the funds provided by the FFVP and packages from MFF with monthly MiHOTM resources featuring a specific fruit or vegetable for all classroom teachers in their school. Each teacher MiHOTM packet included: an Educator Newsletter (1), Family Newsletters (35), Botany
worksheets (35), Nutrient Facts Labels (35), and Student Sleuth Answers (1) for use with their students. In addition, school cafeterias aimed to serve menu items that featured the MiHOTM fruit or vegetable at least one time per month and promoted the featured produce in the cafeteria with posters and menu slicks. The final component of the intervention was serving the MiHOTM featured fruit or vegetable as the FFVP snack option at least one time per month with the funds provided by the FFVP. (Note: No SNAP-Ed funding was used to purchase the featured produce).
Compensation (from private funds) was offered to teachers, FFVP Administrators, and parents who participated in the study. All participating teachers in both the control and intervention schools were provided with nutrition education materials valued up to $50 at the end of the study as a thank you for taking part in the evaluation. Teachers who completed all of the activities outlined in their commitment letter were also entered into a drawing to receive a $100 gift card. FFVP Administrators who worked with
intervention schools and families in both the control and intervention schools that completed and returned the Healthy Homework assignment (parent survey) were entered into a drawing to win a $25 gift card.
Methods
Study Design
The study design was a quasi-experimental intervention/control design to assess the impact of the FFVP and the FFVP implemented in conjunction with the MiHOTM
nutrition education program on student FV intake and related factors during the 2013 to 2014 school year. It was conducted with 4th and 5th grade children in the school
setting. The original design aimed to examine two intervention groups: the FFVP snack only group and the FFVP with MiHOTM group, which included classroom based
nutrition education activities, cafeteria based promotions, and parent education
materials. However, theFFVP snack only group was excluded due to inadequate
sample (only one school). The final sample was 1,062 4th and 5th grade students and
430 parents from a convenience sample of 18 Michigan schoolsserving grades K-8 (14
FFVP with MiHOTM intervention; 4 control) serving low-resource families.
Sample Selection and Recruitment
In total, approximately 999 schools (50 percent or more students enrolled in the free and reduced-price meal program) serve predominately low-resource families in Michigan (Michigan Department of Education, October 2012) and were eligible to participate in the evaluation. Of the total schools, approximately 15 percent (156
schools) received the FFVP in the 2013 to 2014 school year, and the remaining schools did not implement the program (not awarded FFVP or did not apply). A subset of the 156 schools receiving the FFVP also opted to receive MiHOTM. The recruitment goal for this study was to obtain an equal number of schools in the three study groups: FFVP, FFVP with HOTM, and control to obtain a total of 75 schools (25 FFVP, 25 FFVP with HOTM, and 25 control) to reach a total of 300 classrooms (100 FFVP, 100 FFVP with HOTM, and 100 control).
In October 2013, the MDE provided the MFF with a list of the 156 Michigan schools participating in the FFVP during the 2013 to 2014 school year. Schools were screened and excluded from the study if they were currently conducting any nutrition education initiatives or programs that specifically target FV intake (such as PE-Nut –Physical Education and Nutrition Education Working Together). For school recruitment, the initial contact was made by sending an email recruitment letter from MFF to qualifying
nutrition education materials to implement in conjunction with the FFVP snack. In addition, schools were sent a MOU and Commitment Agreement for the participating principals and teachers to sign and fax back to MFF. The FFVP Administrators for intervention schools were also asked to complete a Commitment Agreement for the study and return it to MDE.
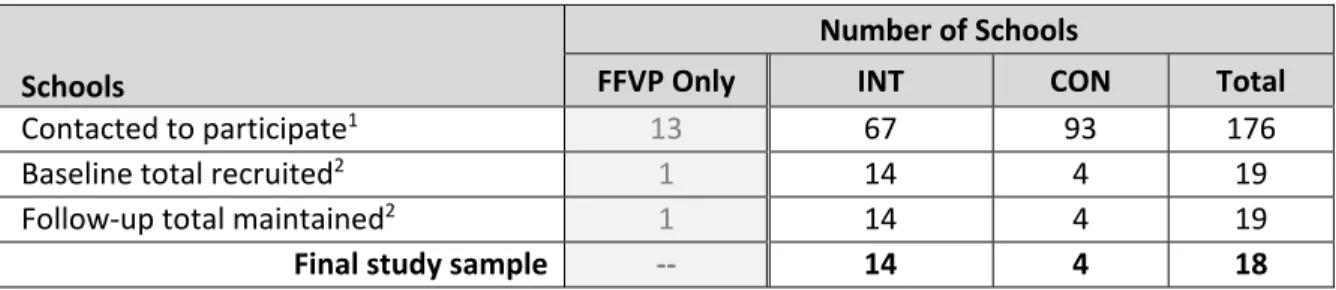
MFF conducted school recruitment in an effort to reach the sample size targets of 25 schools (with 100 classrooms) per study group (see Power Calculation below). Out of the 999 eligible schools, MFF contacted 176 schools to participate in the evaluation: 13 as FFVP snack only schools, 67 as MiHOTM and FFVP snack schools, and 93 as control schools (Table 1). MFF faced significant challenges in recruiting schools to participate in the FFVP snack only and control groups. When MFF contacted the FFVP snack only schools and described the study, many of the schools expressed an interest in administering MiHOTM as well. As a result, only one school remained in the FFVP snack only group. MFF also had difficulty recruiting eligible schools to participate in the control group that met eligibility guidelines for the study. In the end, only 4 out of the 93 control schools contacted were eligible based on the study design and agreed to
participate in the study.
TABLE
1:
School
Recruitment
Schools
Number of Schools
FFVP Only INT CON Total
Contacted to participate1 13 67 93 176
Baseline total recruited2 1 14 4 19
Follow‐up total maintained2 1 14 4 19
Final study sample ‐‐ 14 4 18 1 Data obtained from Michigan Fitness Foundation.
2 Data obtained from school building recruitment file.
INT=Intervention (FFVP w/ MiHOTM), CON=Control.
By January 2014, MFF recruited a total of 19 Michigan schools into the study. All
recruited schools met the following eligibility requirements: 1) 50 percent or more of the student population was enrolled in the free and reduced-price meal program, and 2) the schools confirmed that they were not participating in other SNAP-Ed nutrition
interventions during the 2013 to 2014 school year. The final sample represented eleven school districts in Michigan. The majority of the districts had only one school in the study, except for the Detroit City School District where nine schools participated, all in the intervention group. Although data collection occurred at 19 schools, the FFVP snack only group was excluded from the analysis because there were too few schools in this group to draw meaningful comparisons. The final study sample included 14 MiHOTM
and FFVP snack intervention schools and 4 control schools.Throughout the tables in
this report, INT signifies the MiHOTM and FFVP snack intervention group and CON signifies the control group. When feasible, data tables present the FFVP only group too.
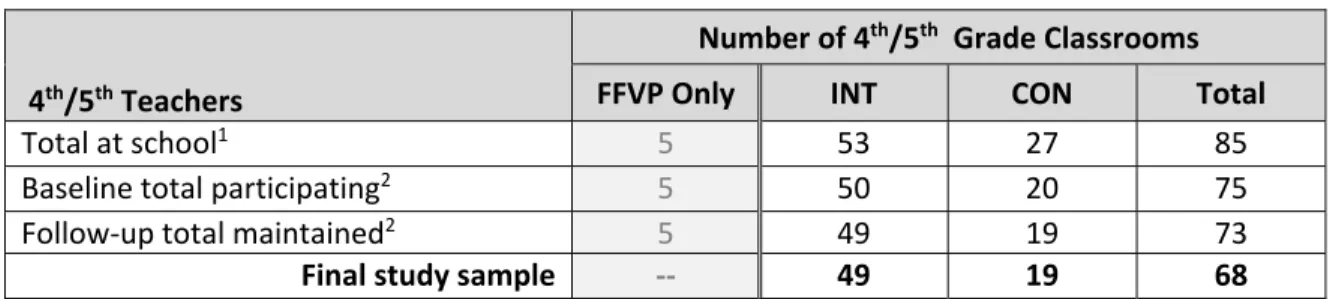
Nearly all of the 4th and 5th grade teachers (50 of 53, 94.3%) in intervention schools and
study (Table 2). At the end of the study, only one additional teacher dropped from each
group. In total, 68 4th and 5th grade classrooms participated with 49 in the intervention
group and 19 in the control group.
TABLE
2:
Teacher
Recruitment
4th/5th Teachers
Number of 4th/5th Grade Classrooms
FFVP Only INT CON Total
Total at school1 5 53 27 85
Baseline total participating2 5 50 20 75
Follow‐up total maintained2 5 49 19 73
Final study sample ‐‐ 49 19 68 1 Data obtained from Michigan Fitness Foundation.
2 Data obtained from school building recruitment file.
INT=Intervention, CON=Control.
Power Calculation
To ensure that the impact evaluation would have adequate power to detect potential intervention effects, calculations were used to determine the number of participants for whom data would be needed, and estimates of attrition were used to calculate the starting sample size needed. We estimated that a total of 300 classrooms (100 FFVP, 100 FFVP and HOTM, and 100 Control) with 25 students per classroom would allow us to evaluate a total of 7,500 4th and 5th grade students at baseline, anticipating that 90 percent of the classes would complete follow-up measures. Assuming 4 classrooms per school, this would be 75 schools (25 FFVP, 25 FFVP with HOTM, and 25 Control). With this sample size, we would be able to detect a difference between groups of 0.40
change in "times of daily FV" consumed (assuming a 5% type I error, 80% power, an intra-class correlation of 0.038 and a standard deviation of the change in FV intake of 3.47). The intra-class correlation coefficient and the standard deviation of change statistics were estimated using data from prior HOTM nutrition education evaluations of
children from low-resource schools using the same survey instrument (SPAN).6
Unfortunately, the sample size estimate of 25 schools (with 100 classrooms) per group was not reached in the control group, substantially reducing the power to detect
potential intervention effects in this study.
IRB Approval
A study protocol was submitted and approved by the Human Subjects Institutional Review Board of the Western Michigan University in October 2013. Western Michigan University Human Subjects Institutional Review Board granted MFF an exemption of informed consent for this study (HSIRB #: 13-10-43), based on the fact that the program evaluation assesses a nutrition education program using procedures and methods that are typically employed in the education setting.
Teacher Training
In January 2014, all participating 4th and 5th grade teachers at the 14 intervention schools were forwarded a link from MFF via e-mail to a standardized online training that provided teachers with a brief orientation on how to use the MiHOTM and FFVP snack intervention activities in their classrooms. The training demonstrated the use of the intervention components in the classroom including the student worksheets and
presented the family newsletters to send home with students. FFVP administrators were also available to provide additional guidance. Regional coordinators provided teachers with direction on how to complete the fidelity log to track the implementation of MiHOTM intervention components (intervention teachers only) and other nutrition education offered (intervention and control teachers) during the 2013 to 2014 school year.
Regional Coordinator Training
By November 2013, two regional coordinators were identified to lead the data collection activities at participating schools. MFF trained the regional coordinators using a data collection protocol developed by PHI that included step-by-step administration
procedures for the student survey and the environmental assessment tool. Regional coordinators were trained in how to effectively work with school administrators,
classroom teachers, and 4th and 5th grade students; procedures for obtaining student assent; administration of the instruments; tracking documentation; and study logistics.
Instruments and Administration
Assent Process. Regional coordinators provided a brief description of the study out
loud in class to inform all students about the evaluation, to let the students know that their participation was voluntary, and to provide students the opportunity to decline to participate. Students who declined participation remained in the classroom, but did not take part in the data collection. In total, only a small proportion (7.5%) of students was absent or declined to participate in baseline data collection.
Student Survey. In each classroom, the regional coordinator administered the
30-minute student survey to all participating children in a classroom by reading the instructions and questions aloud. The survey included questions about student’s intentions, preferences, liking, peer and social norms, perceived modeling, home activities, and consumption related to FV and individual-level demographics (age, race/ethnicity, and gender). Students were asked to follow along and complete the questions together. The regional coordinator was available to answer questions. Survey questions were based on pre-existing validated items from the following tools: FV food
frequency from the School and Physical Activity Nutrition Project (SPAN) survey6; FV
availability from the Home Availability Survey7; FV preferences8; Taste of many FV and
tasting new FV (Liking) and teacher/ cafeteria worker social norms for FV from Child
Nutrition Questionnaire9;Want to eat FV (Intentions), FV peer norms (best friends/ most
classmates) and school norms (most classmates think it’s cool) from the ProKids
Survey of Attitude-Social Influence-Self-Efficacy10. The SPAN survey measures FV
exclude fried potatoes. The baseline student survey data were collected between
December 2013 and early February 2014. Follow-up data collection took place between May and June 2014. The student survey and data collection protocol were the same at baseline and follow-up.
Parent Survey. Regional coordinators provided teachers with a set of parent surveys
(Healthy Homework) for their students. Teachers assigned the Healthy Homework by asking students to take it home for their parents to fill in. The parent survey was a
1-page Scantron® that took about 15 minutes to complete. This survey provided a
retrospective examination of changes in student and family behaviors and household nutrition practices based on parents’ observations and experiences over the course of the intervention period. It assessed the perceived changes that occurred in child and parent FV intake; child and parent snack choices; cooking and shopping practices; use of nutrition labels; and availability of FV in the home. This tool was completed once toward the end of the intervention (April to June 2014).
Environmental Assessment Tool (EAT). The Environmental Assessment Tool (EAT)
was completed both by observation of the school cafeteria and other school facilities and through an interview with a school administrator. This tool assessed nutrition variables related to the school environment and school nutrition policies with specific sections designed to collect information about salad bars, FFVP snacks, school vending machines, nutrition promotions in the indoor and outdoor dining areas, and nutrition policies and practices. The last section, school nutritional and wellness policies and practices, was answered by a school administrator. The MFF regional coordinators completed the EAT once at all intervention and control schools during the intervention
period around the time of the follow-up data collection (March to June 2014).
Teacher Survey. Intervention and control teachers were asked to complete an online
survey comprised of 50 questions on classroom practices. MFF sent teachers a link via e-mail to participate in the survey. Unique online surveys were sent to teachers in the intervention group and control group. The survey for the intervention schools included questions on what MiHOTM activities were provided in the classroom, how the nutrition programs were delivered, coordination between MiHOTM and FFVP snack, any training received, and school and classroom policies around nutrition education and bringing foods into the classroom. The survey for the control schools included the identical classroom environment questions, but only a single question about MiHOTM (whether
or not it was implemented).The online teacher survey was completed once during the
intervention period around the time of the follow-up data collection (May to June 2014).
FFVP Administrator Survey. This survey was comprised of 42 questions about school
practices related to MiHOTM and the FFVP snack that FFVP Administrators could complete either online or by telephone interview. MFF sent FFVP Administrators a link through e-mail to review and complete the survey online with an invitation to set up a convenient time for a telephone interview, if preferred. The survey included questions on what MiHOTM activities were provided in the classroom, how the nutrition programs were delivered, coordination between MiHOTM and FFVP snack, and any training
provided.The FFVP administrator interview was completed once during the intervention period around the time of the follow-up data collection (June 2014).
Intervention Fidelity
To ensure that the intervention components were implemented, teacher fidelity logs were created. Intervention information was also collected through the teacher survey (MiHOTM implementation), parent survey (MiHOTM family newsletter activities), and EAT (MiHOTM posters/menu slicks) described above.
Teacher Fidelity Logs. All intervention and control teachers participating in the study were asked to keep a log of the nutrition education activities conducted in the classroom during the intervention. Control teachers recorded the total time they spent delivering nutrition education and what, if any, nutrition education materials they used. Intervention teachers reported which MiHOTM materials they used to provide nutrition education, the time they spent on MiHOTM implementation, whether they sent MiHOTM materials home with students for their parents, and what, if any, other nutrition education materials they used, as well as the time spent on them. Teachers began completing their fidelity logs early in the school year (October to December 2013) and continued documenting their nutrition education activities until the follow-up data collection started (April to June 2014).
Data Processing
Each study instrument was labeled to identify the school and class/teacher, as relevant. For student and parent surveys, unique and anonymous study identification codes were created from the child specific demographic data reported and then concatenated with the school and class/teacher identification codes to create unique student identification numbers. The student identification numbers were used to match the baseline and follow-up surveys. The environmental assessment tool was coded to the school. All of these data were uploaded to box.com by MFF and downloaded by PHI for data
processing and analysis. FFVP Administrator and teacher surveys were collected and analyzed through Survey Monkey. Data from the student surveys, parent surveys, fidelity logs, and environmental assessment tool were entered into SAS/SPSS
databases. As a standard quality control measure, all data from the EAT were double entered to ensure accuracy. Total counts were generated for student surveys, parent surveys, teacher surveys, fidelity logs, FFVP administrator surveys, and the
environmental assessment tool.
Data Analysis
Baseline data on control and intervention groups collected from students (from the Student Survey) as well as school level data from the Michigan Department of Education were compared to assess potential differences between the groups, as random assignment was not feasible as part of the study design (Table 3). Data collected on the school environment (from the EAT) for factors that might affect the intervention impact were also compared between the intervention and control schools.
Data collected on classroom environments that might affect the intervention impact (from the Teacher Fidelity Log and Teacher Survey) were compared between the intervention and control classrooms. When sufficient sample sizes were available, t-tests were used to compare continuous variables and chi-square t-tests were used to compare categorical variables.
The primary outcome variable, FV intake, was examined as a continuous variable (e.g., mean times/day of FV consumed). We assessed the impact on change in the primary outcome as a continuous variable from baseline to follow-up between the control and intervention groups using multivariate regression models. The computed change score acted as the dependent variable in regression models, with “intervention status” as the primary predictor of interest. The baseline value for the outcome was included in each of these models along with potential confounders. We controlled for demographic characteristics as potential confounders (i.e., age, gender, and race/ethnicity) and examined possible interaction effects with intervention status. Adjustments for cluster design effects at the classroom and school level were made using Generalized
Estimation Equation (GEE) techniques.
To assess changes in secondary outcomes (intentions, preferences, liking, peer and
social norms, perceived modeling, home activities,family behaviors, and household
nutrition practices) from baseline to follow-up between the control and intervention groups, we used methods similar to those described above. All analyses were conducted using SAS version 9.3/9.4 and SPSS version 22. A p-value of <0.05 indicates a significant difference between groups for all statistical tests presented.
Findings
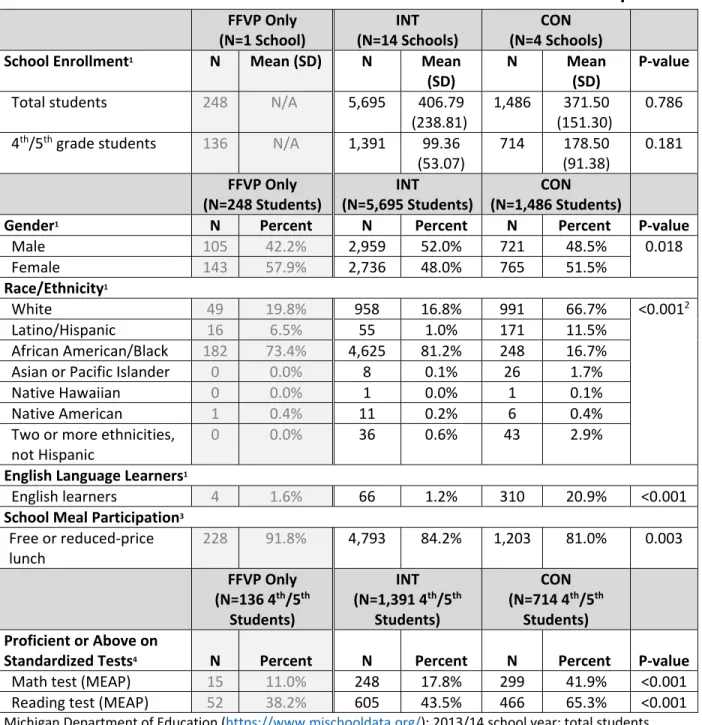
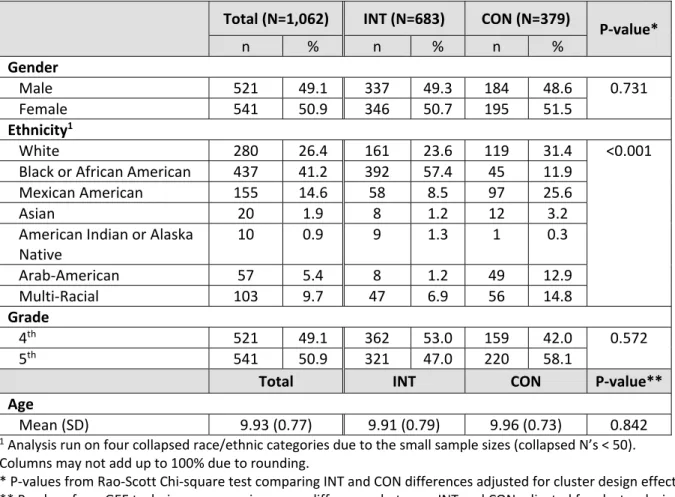
Demographics
Table 3 illustrates the population characteristics of schools in the intervention and control groups, based on information from the Michigan Department of Education and Michigan Great Schools available online (2013 to 2014 school year, when available). Significant differences were found between intervention and control schools in the gender of students (more male students at intervention schools than controls; 52.0%, 48.5%, respectively), in the ethnic/racial distribution of students (more African
American/Black children; 81.2%, 16.7%), percentage of school population that were English Language Learners (fewer English learners; 1.2%, 20.9%), and percentage of the school population enrolled in the free and reduced-price meal program (higher participation; 84.2%, 81.0%), and percentage of the school population that were
proficient or above on the standardized math and reading tests (fewer proficient; 17.8%, 41.9% at math and 43.5%, 65.3% at reading; respectively). Similar distributions of school characteristics by study group is often not achieved without random assignment of schools which was not feasible in this study. Demographic characteristics collected from students were used to control for the demographic variations between groups in the analysis.
TABLE
3:
Characteristics
of
Schools
in
the
Intervention
and
Control
Groups
FFVP Only (N=1 School) INT (N=14 Schools) CON (N=4 Schools)
School Enrollment1 N Mean (SD) N Mean (SD) N Mean (SD) P‐value Total students 248 N/A 5,695 406.79 (238.81) 1,486 371.50 (151.30) 0.786 4th/5th grade students 136 N/A 1,391 99.36 (53.07) 714 178.50 (91.38) 0.181 FFVP Only (N=248 Students) INT (N=5,695 Students) CON (N=1,486 Students)
Gender1 N Percent N Percent N Percent P‐value
Male 105 42.2% 2,959 52.0% 721 48.5% 0.018 Female 143 57.9% 2,736 48.0% 765 51.5% Race/Ethnicity1 White 49 19.8% 958 16.8% 991 66.7% <0.0012 Latino/Hispanic 16 6.5% 55 1.0% 171 11.5% African American/Black 182 73.4% 4,625 81.2% 248 16.7% Asian or Pacific Islander 0 0.0% 8 0.1% 26 1.7% Native Hawaiian 0 0.0% 1 0.0% 1 0.1% Native American 1 0.4% 11 0.2% 6 0.4% Two or more ethnicities, not Hispanic 0 0.0% 36 0.6% 43 2.9%
English Language Learners1
English learners 4 1.6% 66 1.2% 310 20.9% <0.001 School Meal Participation3
Free or reduced‐price lunch 228 91.8% 4,793 84.2% 1,203 81.0% 0.003 FFVP Only (N=136 4th/5th Students) INT (N=1,391 4th/5th Students) CON (N=714 4th/5th Students) Proficient or Above on
Standardized Tests4 N Percent N Percent N Percent P‐value Math test (MEAP) 15 11.0% 248 17.8% 299 41.9% <0.001 Reading test (MEAP) 52 38.2% 605 43.5% 466 65.3% <0.001 1 Michigan Department of Education (https://www.mischooldata.org/); 2013/14 school year: total students. 2 Analysis run on four collapsed race/ethnic categories (White, Latino/Hispanic, African American/Black, Other) due
to the small sample sizes (collapsed N’s < 50).
3 Michigan schools from http://www.greatschools.org/michigan/ for the 2013/14 school year: total students. 4 Michigan schools from http://www.greatschools.org/michigan/ for the 2012/13 school year: 4th/5th grades.
INT=Intervention, CON=Control.
P‐values for INT/CON from T‐Test analysis and Pearson Chi‐Square test. Columns may not add up to 100% due to
rounding.
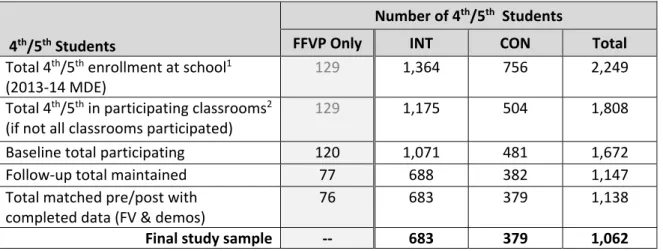
A total of 1,062 students (683 intervention; 379 control) met all of the study criteria for inclusion (Table 4). The final analytic sample included students with complete data for demographic characteristics. In total, nearly two-thirds (63.5%) of the students who provided baseline data also completed the follow-up data collection. Retention from
baseline to follow-up among intervention students (63.8%) was lower than the rate observed among control students (78.8%).
TABLE
4:
Student
Recruitment
and
Participation
4th/5th Students
Number of 4th/5th Students
FFVP Only INT CON Total Total 4th/5th enrollment at school1 (2013‐14 MDE) 129 1,364 756 2,249 Total 4th/5th in participating classrooms2 (if not all classrooms participated) 129 1,175 504 1,808 Baseline total participating 120 1,071 481 1,672 Follow‐up total maintained 77 688 382 1,147 Total matched pre/post with completed data (FV & demos) 76 683 379 1,138
Final study sample ‐‐ 683 379 1,062 1 Data obtained from Michigan Department of Education (2013‐14).
2 Data obtained from Michigan Fitness Foundation.
INT=Intervention, CON=Control.
Table 5 shows the demographic characteristics collected as part of the student survey
from the 4th and 5th grade students participating in the evaluation study and represents
the final sample of students included in the analyses. While there were no significant differences between groups on the distribution of gender, grade, or age; students in the intervention group were significantly more likely to describe themselves as Black or African American at baseline compared to controls (57.4% vs. 11.9%, p<0.001).
TABLE
5:
Characteristics
of
4
th
and
5
th
Grade
Students
included
in
the
Intervention
and
Control
Groups
Total (N=1,062) INT (N=683) CON (N=379)
P‐value* n % n % n % Gender Male 521 49.1 337 49.3 184 48.6 0.731 Female 541 50.9 346 50.7 195 51.5 Ethnicity1 White 280 26.4 161 23.6 119 31.4 <0.001 Black or African American 437 41.2 392 57.4 45 11.9 Mexican American 155 14.6 58 8.5 97 25.6 Asian 20 1.9 8 1.2 12 3.2 American Indian or Alaska Native 10 0.9 9 1.3 1 0.3 Arab‐American 57 5.4 8 1.2 49 12.9 Multi‐Racial 103 9.7 47 6.9 56 14.8 Grade 4th 521 49.1 362 53.0 159 42.0 0.572 5th 541 50.9 321 47.0 220 58.1
Total INT CON P‐value**
Age
Mean (SD) 9.93 (0.77) 9.91 (0.79) 9.96 (0.73) 0.842 1 Analysis run on four collapsed race/ethnic categories due to the small sample sizes (collapsed N’s < 50).
Columns may not add up to 100% due to rounding.
* P‐values from Rao‐Scott Chi‐square test comparing INT and CON differences adjusted for cluster design effects.
** P‐values from GEE techniques comparing mean differences between INT and CON adjusted for cluster design
effects.
Student Survey
Fruit and Vegetable Intake. Results from the analysis of FV intake (times consumed
yesterday) are presented in Table 6. The mean total vegetables consumed was lower among intervention students when compared to control students at baseline (1.35 vs. 1.68 times, p=0.018). Intervention students reported consuming more FV from baseline to follow-up (0.06 times), while consumption among control students decreased (-0.09 times). The observed mean difference in the change in FV intake from baseline to follow-up between the groups was 0.15 times per day (not displayed in table), far below the target change of 0.40 times per day needed to detect significance. As shown in Table 6, after adjusting for cluster design effects and demographics (gender,
race/ethnicity, age, and grade) the adjusted mean difference in change dropped to 0.08 times per day with a p-value of 0.509. The adjusted mean differences will be presented from this point forward. The majority of the difference in FV intake among intervention students came from eating more fruit (adjusted mean difference of 0.07 times), and only a small amount was attributed to the change in vegetable consumption (adjusted mean difference of 0.01 times). In fact, vegetables consumption declined in both groups from baseline to follow-up.
TABLE
6:
Fruit
and
Vegetable
Consumption
(times/yesterday)
at
Baseline
and
Follow
‐
up
Baseline Follow‐up Change INT (N=675) mean (SD) CON (N=376) mean (SD) P‐ value* INT (N=675) mean (SD) CON (N=376) mean (SD) Adjusted Mean Difference P‐ value** Total Fruit 1.58 (1.41) 1.89 (1.42) 0.214 1.72 (1.46) 1.94 (1.46) 0.07 0.447 Total Vegetables 1.35 (1.31) 1.68 (1.44) 0.018 1.29 (1.34) 1.53 (1.40) 0.01 0.909 Total Fruit and
Vegetables 2.93 (2.23) 3.57 (2.45) 0.064 3.00 (2.30) 3.48 (2.42) 0.08 0.509
SCALE: No, I didn’t eat any [fruit/vegetables] yesterday=0; Yes, I ate [fruit/vegetables] 1 time yesterday=1; Yes, 2
times yesterday=2; Yes, 3 times yesterday=3; Yes, 4 times yesterday=4; Yes, 5 or more times yesterday=5.
INT=Intervention, CON=Control.
* P‐values from GEE techniques comparing differences between INT and CON at baseline adjusted for cluster
design effects.
** P‐values from GEE techniques comparing change in INT versus change in CON adjusted for baseline values,
cluster design effects, and demographics (gender, race/ethnicity, age, and grade).
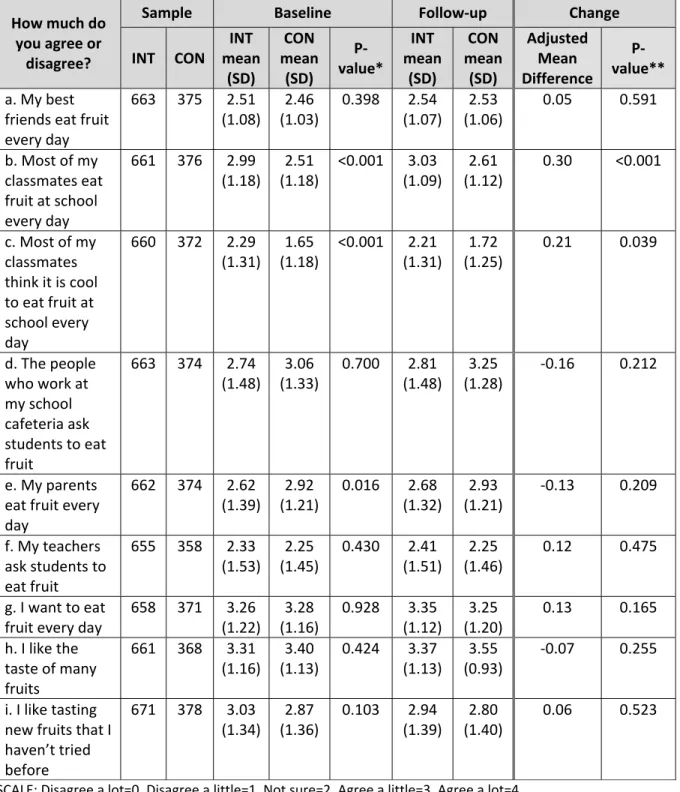
Social Support, Perceived Modeling, Norms, and Enjoyment of Fruits and
Vegetables. Students were asked “How much do you agree or disagree with the
following statements about fruit?” and to choose from the following responses: Disagree a lot, Disagree a little, Not Sure, Agree a little, Agree a lot. Mean scores were computed using a five-point scale. Table 7 shows the change from baseline to follow-up and adjusted mean difference between intervention and control groups. Table 7a shows the proportion of students who agreed, responding “Agree a little” or “Agree a lot,” at each
time point. The baseline assessment showed that intervention students reported higher peer norms, but lower parent modelling for eating fruit compared to control students. For students participating in the MiHOTM and FFVP snack intervention there was a
significant increase in peer norms for eating fruit. Significant changes between
intervention and control groups were found for the following statements on peer norms: “Most of my classmates eat fruit at school every day” and “Most of my classmates think it is cool to eat fruit at school every day.” The adjusted mean differences in scored responses between intervention and control students from baseline to follow-up for these questions were 0.30 (p<0.001) and 0.21 (p=0.039), respectively. Finally, although significant changes were not found in response to some of the other statements
regarding fruit, it is noteworthy that at baseline both groups reported high mean scores for the following questions: “I want to eat fruit every day,” and “I like the taste of many fruits,” indicating that intentions and desire to eat fruit, and liking fruit were already highly endorsed by children at the beginning of the study and prior to the intervention.
TABLE
7:
Peer
and
Social
Norms,
Perceived
Modeling,
Intentions,
and
Liking
for
Fruit,
Mean
Score
How much do you agree or
disagree?
Sample Baseline Follow‐up Change INT CON INT mean (SD) CON mean (SD) P‐ value* INT mean (SD) CON mean (SD) Adjusted Mean Difference P‐ value** a. My best friends eat fruit every day 663 375 2.51 (1.08) 2.46 (1.03) 0.398 2.54 (1.07) 2.53 (1.06) 0.05 0.591 b. Most of my classmates eat fruit at school every day 661 376 2.99 (1.18) 2.51 (1.18) <0.001 3.03 (1.09) 2.61 (1.12) 0.30 <0.001 c. Most of my classmates think it is cool to eat fruit at school every day 660 372 2.29 (1.31) 1.65 (1.18) <0.001 2.21 (1.31) 1.72 (1.25) 0.21 0.039 d. The people who work at my school cafeteria ask students to eat fruit 663 374 2.74 (1.48) 3.06 (1.33) 0.700 2.81 (1.48) 3.25 (1.28) ‐0.16 0.212 e. My parents eat fruit every day 662 374 2.62 (1.39) 2.92 (1.21) 0.016 2.68 (1.32) 2.93 (1.21) ‐0.13 0.209 f. My teachers ask students to eat fruit 655 358 2.33 (1.53) 2.25 (1.45) 0.430 2.41 (1.51) 2.25 (1.46) 0.12 0.475 g. I want to eat fruit every day 658 371 3.26 (1.22) 3.28 (1.16) 0.928 3.35 (1.12) 3.25 (1.20) 0.13 0.165 h. I like the taste of many fruits 661 368 3.31 (1.16) 3.40 (1.13) 0.424 3.37 (1.13) 3.55 (0.93) ‐0.07 0.255 i. I like tasting new fruits that I haven’t tried before 671 378 3.03 (1.34) 2.87 (1.36) 0.103 2.94 (1.39) 2.80 (1.40) 0.06 0.523
SCALE: Disagree a lot=0, Disagree a little=1, Not sure=2, Agree a little=3, Agree a lot=4.
INT=Intervention, CON=Control.
* P‐values from GEE techniques comparing differences between INT and CON at baseline adjusted for cluster
design effects.
** P‐values from GEE techniques comparing change in INT versus change in CON adjusted for baseline values,
TABLE
7a:
Peer
and
Social
Norms,
Perceived
Modeling,
Intentions,
and
Liking
for
Fruit,
Percent
who
Report
Agreeing
How much do you agree or disagree?
Sample Baseline Follow‐up INT CON INT
% Agree CON % Agree INT % Agree CON % Agree a. My best friends eat fruit every day. 663 375 43.4 42.4 47.8 46.4 b. Most of my classmates eat fruit at school every day. 661 376 69.6 50.3 72.6 53.5 c. Most of my classmates think it is cool to eat fruit at school every day. 660 372 41.1 20.2 40.3 22.3 d. The people who work at my school cafeteria ask students to eat fruit. 663 374 62.3 71.1 65.9 77.5 e. My parents eat fruit every day. 662 374 59.2 66.6 61.6 66.8 f. My teachers ask students to eat fruit. 655 358 50.2 45.0 51.5 44.4 g. I want to eat fruit every day. 658 371 80.6 84.4 83.7 83.0 h. I like the taste of many fruits. 661 368 83.4 85.3 84.6 91.3 i. I like tasting new fruits that I haven’t tried before. 671 378 73.6 69.3 72.1 70.4
SCALE: % Agree included Agree a little and Agree a lot.
INT=Intervention, CON=Control.
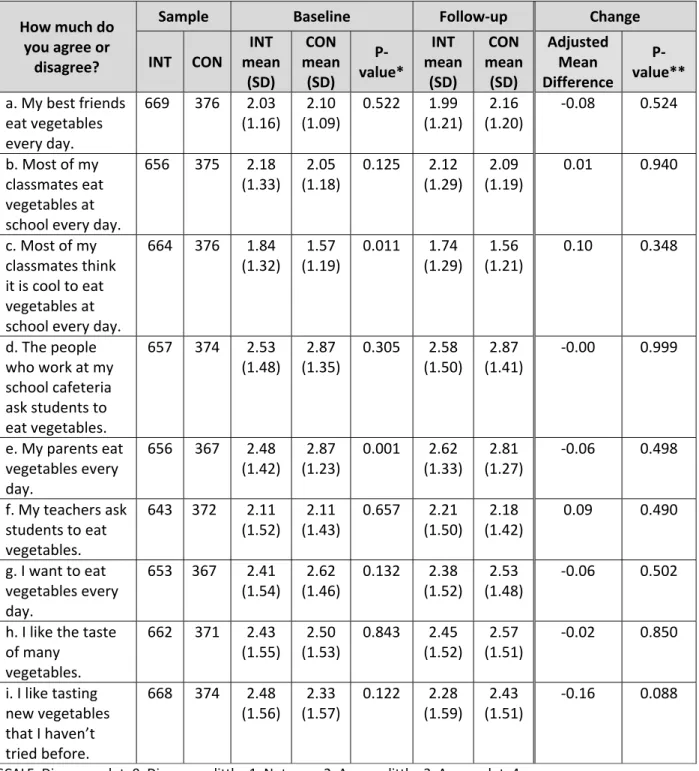
Students were asked the same questions as above for fruits, but with a focus on vegetables. As with the questions on fruit, mean scores for vegetable questions were computed using a five-point scale. Table 8 shows the change from baseline to follow- up and adjusted mean difference between intervention and control groups. Table 8a shows the proportion of students who agreed, responding “Agree a little” or “Agree a lot,” at each time point. Similar to the baseline findings on fruit, intervention students reported higher peer norms, but lower parent modelling for eating vegetables when compared to control students at baseline. For vegetables, changes in peer and social norms, perceived modeling, intentions, and liking were all non-significant.
TABLE
8:
Peer
and
Social
Norms,
Perceived
Modeling,
Intentions,
and
Liking
for
Vegetables,
Mean
Score
How much do you agree or
disagree?
Sample Baseline Follow‐up Change INT CON INT mean (SD) CON mean (SD) P‐ value* INT mean (SD) CON mean (SD) Adjusted Mean Difference P‐ value** a. My best friends eat vegetables every day. 669 376 2.03 (1.16) 2.10 (1.09) 0.522 1.99 (1.21) 2.16 (1.20) ‐0.08 0.524 b. Most of my classmates eat vegetables at school every day. 656 375 2.18 (1.33) 2.05 (1.18) 0.125 2.12 (1.29) 2.09 (1.19) 0.01 0.940 c. Most of my classmates think it is cool to eat vegetables at school every day. 664 376 1.84 (1.32) 1.57 (1.19) 0.011 1.74 (1.29) 1.56 (1.21) 0.10 0.348 d. The people who work at my school cafeteria ask students to eat vegetables. 657 374 2.53 (1.48) 2.87 (1.35) 0.305 2.58 (1.50) 2.87 (1.41) ‐0.00 0.999 e. My parents eat vegetables every day. 656 367 2.48 (1.42) 2.87 (1.23) 0.001 2.62 (1.33) 2.81 (1.27) ‐0.06 0.498 f. My teachers ask students to eat vegetables. 643 372 2.11 (1.52) 2.11 (1.43) 0.657 2.21 (1.50) 2.18 (1.42) 0.09 0.490 g. I want to eat vegetables every day. 653 367 2.41 (1.54) 2.62 (1.46) 0.132 2.38 (1.52) 2.53 (1.48) ‐0.06 0.502 h. I like the taste of many vegetables. 662 371 2.43 (1.55) 2.50 (1.53) 0.843 2.45 (1.52) 2.57 (1.51) ‐0.02 0.850 i. I like tasting new vegetables that I haven’t tried before. 668 374 2.48 (1.56) 2.33 (1.57) 0.122 2.28 (1.59) 2.43 (1.51) ‐0.16 0.088
SCALE: Disagree a lot=0, Disagree a little=1, Not sure=2, Agree a little=3, Agree a lot=4.
INT=Intervention, CON=Control.
* P‐values from GEE techniques comparing differences between INT and CON at baseline adjusted for cluster
design effects.
** P‐values from GEE techniques comparing change in INT versus change in CON adjusted for baseline values,
TABLE
8a:
Peer
and
Social
Norms,
Perceived
Modeling,
Intentions,
and
Liking
for
Vegetables,
Percent
who
Report
Agreeing
How much do you agree or disagree?
Sample Baseline Follow‐up INT CON INT
% Agree CON % Agree INT % Agree CON % Agree a. My best friends eat vegetables every day. 669 376 27.7 31.4 30.2 33.5 b. Most of my classmates eat vegetables at school every day. 656 375 42.4 34.9 41.6 34.7 c. Most of my classmates think it is cool to eat vegetables at school every day. 664 376 28.6 17.6 26.1 18.1 d. The people who work at my school cafeteria ask students to eat vegetables. 657 374 53.9 65.8 58.8 67.7 e. My parents eat vegetables every day. 656 367 54.1 63.5 58.2 61.6 f. My teachers ask students to eat vegetables. 643 372 42.9 41.1 45.6 40.9 g. I want to eat vegetables every day. 653 367 58.2 65.1 57.7 61.3 h. I like the taste of many vegetables. 662 371 59.1 60.9 59.2 62.5 i. I like tasting new vegetables that I haven’t tried before. 668 374 59.6 54.3 53.1 58.6
SCALE: % Agree included Agree a little and Agree a lot.
INT=Intervention, CON=Control.
Preferences for Fruits and Vegetables. Students in the intervention group were
provided with fresh FV snacks every week as part of the MiHOTM and FFVP snack intervention. In addition, MiHOTM materials were made available to schools to feature some or all of the 12 potential produce items. To assess changes in students’
preferences for the MiHOTM featured FV, they were asked “How much do you like these FV?” with the following responses to choose from: I don’t know or never tasted it, I don’t like this, I like this a little, or I like this a lot. Mean scores were computed using a four-point scale. Table 9 shows the change from baseline to follow-up and adjusted mean difference between intervention and control groups. At baseline, preferences for tomatoes, carrots, melon, and potatoes were lower among intervention students when compared to control students; while higher preferences were observed among
intervention students for greens and strawberries. Contrary to expectations, significant decreases in liking apples (adjusted mean difference of -0.06, p<0.001) and melon (adjusted mean difference of -0.17, p<0.001) were found for students participating in the MiHOTM and FFVP snack intervention compared to students in the control group. Changes in preferences for the remaining MiHOTM featured produce items were not significant.
TABLE
9:
Preferences
for
Fruits
and
Vegetables,
Mean
Score
How much do you like…?
Sample Baseline Follow‐up Change INT CON INT mean (SD) CON mean (SD) P‐ value* INT mean (SD) CON mean (SD) Adjusted Mean Difference P‐ value** a. Apples 663 378 2.77 (0.50) 2.80 (0.44) 0.653 2.75 (0.51) 2.79 (0.44) ‐0.06 <0.001 b. Tomatoes 665 376 1.61 (0.86) 1.87 (0.90) <0.001 1.55 (0.82) 1.77 (0.87) ‐0.01 0.770 c. Squash 652 369 0.90 (0.89) 0.87 (0.97) 0.608 0.88 (0.89) 0.90 (0.94) ‐0.04 0.449 d. Carrots 649 370 2.33 (0.74) 2.46 (0.68) 0.019 2.26 (0.78) 2.40 (0.71) ‐0.04 0.324 e. Asparagus 643 372 1.02 (1.13) 1.12 (1.09) 0.757 1.13 (1.10) 1.18 (1.09) 0.13 0.095 f. Berries 658 369 2.62 (0.72) 2.64 (0.72) 0.800 2.61 (0.78) 2.66 (0.71) ‐0.01 0.738 g. Greens 653 375 2.22 (0.88) 2.09 (0.98) 0.040 2.28 (0.85) 2.13 (0.92) 0.07 0.326 h. Melon 651 372 2.41 (0.96) 2.65 (0.73) <0.001 2.50 (0.89) 2.76 (0.60) ‐0.17 <0.001 i. Pears 655 375 2.36 (0.88) 2.22 (0.96) 0.342 2.39 (0.83) 2.26 (0.92) 0.05 0.177 j. Potatoes 651 370 2.51 (0.71) 2.67 (0.61) 0.004 2.51 (0.69) 2.60 (0.64) ‐0.05 0.283 k. Spinach 652 371 1.54 (1.04) 1.49 (1.07) 0.508 1.52 (1.05) 1.53 (1.06) ‐0.03 0.674 l. Strawberries 669 378 2.85 (0.51) 2.80 (0.57) 0.021 2.86 (0.48) 2.79 (0.57) 0.03 0.116
SCALE: I don’t know or never tasted it=0, I don’t like this=1, I like this a little=2, I like this a lot =3.
INT=Intervention, CON=Control.
* P‐values from GEE techniques comparing differences between INT and CON at baseline adjusted for cluster
design effects.
** P‐values from GEE techniques comparing change in INT versus change in CON adjusted for baseline values,
cluster design effects, and demographics (gender, race/ethnicity, age, and grade).
Availability and Accessibility of Fruits and Vegetables at Home. Students were
asked “At your home, do you have [fruits/vegetables] to eat?” and “At your home, do you have the kind of [fruits/vegetables] that you like to eat?” with the following
responses to choose from: Never, Sometimes, and Always. Mean scores were
computed using a three-point scale. Table 10 shows the change from baseline to follow-up and adjusted mean difference between intervention and control grofollow-ups. Table 10a shows the proportion of students who responded “Always” at each time point. The baseline assessment showed that intervention students reported lower availability of fruits and vegetables to eat at home than control students. There was only one
significant change in the availability of FV at home from baseline to follow-up between the study groups, and it was in the opposite direction. A significant decrease in the availability of the kind of vegetables that you like to eat (adjusted mean difference of
-0.09, p=0.030) was found for students participating in the MiHOTM and FFVP snack intervention compared to students in the control group.
TABLE
10:
Fruit
and
Vegetable
Availability
at
Home,
Mean
Score
At your home, do you have…?
Sample Baseline Follow‐up Change INT CON INT mean (SD) CON mean (SD) P‐ value* INT mean (SD) CON mean (SD) Adjusted Mean Difference P‐ value** a. fruits to eat 655 367 1.57 (0.52) 1.69 (0.47) 0.003 1.59 (0.51) 1.70 (0.46) ‐0.05 0.120 b. the kind of fruits that you like to eat 656 364 1.57 (0.53) 1.59 (0.51) 0.499 1.57 (0.55) 1.58 (0.50) ‐0.01 0.830 c. vegetables to eat 631 351 1.61 (0.54) 1.73 (0.46) 0.005 1.64 (0.54) 1.68 (0.47) ‐0.02 0.546 d. the kind of vegetables that you like to eat 619 347 1.31 (0.64) 1.40 (0.57) 0.082 1.26 (0.63) 1.39 (0.57) ‐0.09 0.030
SCALE: Never=0, Sometimes=1, Always=2.
INT=Intervention, CON=Control.
* P‐values from GEE techniques comparing differences between INT and CON at baseline adjusted for cluster
design effects.
** P‐values from GEE techniques comparing change in INT versus change in CON adjusted for baseline values,
cluster design effects, and demographics (gender, race/ethnicity, age, and grade).
TABLE
10a:
Fruit
and
Vegetable
Availability
at
Home,
Percent
Reporting
Always
At your home, do you have…?
Sample Baseline Follow‐up INT CON INT
% Always CON % Always INT % Always CON % Always a. fruits to eat 655 367 58.0 69.8 60.2 70.0 b. the kind of fruits that you like to eat 656