Effectiveness of Advanced and Authenticated Packet Marking
Scheme for Traceback of Denial of Service Attacks
Bilal Rizvi and Emmanuel Fernández-Gaucherand
Department of Electrical & Computer Engineering &Computer ScienceUniversity of Cincinnati Cincinnati, OH 45221-0030 Email: {rizvib,emmaneul}@ececs.uc.edu
Abstract
Advanced and Authenticated Packet Marking (AAPM) [1] scheme is one of the proposed packet marking schemes for the traceback of Denial of Service (DoS) attacks. AAPM uses hash functions to reduce the storage space requirement for encoding of router information in the IP header. In this paper we take the perspective of the attacker and analyze the effects of inserting fake edges against AAPM. Since the AAPM scheme is subject to spoofing of the marking field, by inserting fake edges (corrupting the marking field) in the packets the attacker can impede traceback. In this paper, we show that the attacker can increase this distance by inserting fake edges in packets. Therefore, the attacker can make it appear to the victim that the attack was launched from a node farther away than it actually was, thus maintaining his own anonymity.
1.
Introduction.
Denial of Service (DoS) attacks has been a major threat to the Internet for a long time now. Tracing the source of an attack has been seen as one of the solutions to DoS attacks. Techniques have been proposed to determine the source of a large DoS attack, Probabilistic Packet Marking (PPM) [4], Adjusted Probabilistic Packet Marking scheme (APPM) [6], and AAPM. However, the inherent ability of attackers to spoof the attack packets makes traceback by Packet-Marking-base techniques a major challenge. This is the reason why the Internet community is reluctant to implement these proposed schemes in practice. In this paper we analyze the effectiveness of a packet marking scheme. A critical analysis of this nature is very important to define the practicality of these schemes. Although, these schemes are innovative for traceback, the imperfect nature of the IP protocol prevents these schemes to provide a complete solution to the problem of DoS attacks. In PPM, APPM and AAPM, the attack packets are marked with router information, which when received at the victim’s end, is used to reconstruct the attack path. However, along with spoofing the source address in the attack packets, the attacker can also spoof the marking field in the packets. In PPM, a large fraction of the attack packets reach the victim unmarked. Using these unmarked packets the attacker can hide his identity by inserting fake edges in the attack packets [5]. In this paper, we analyze the
effectiveness of AAPM based on a fixed marking probability (PPM) and on a variable marking probability (APPM). The basic assumption of AAPM is that the victim has a map of upstream routers using which the source of the DoS attack can be traced, hop by hop starting at the router closet to it. However, assuming the attacker has a map of all its upstream routers from the attacking host, the attacker can find routers not present in the actual attack path to the victim. Using this information, the attacker can insert fake edges in the attack traffic. When the traceback of the DoS attack is conducted, the victim would be deceived into tracing the attack to a much greater path length. Using the simulation software tool, Arena 5.0 [9], it will be shown that the number of fake edges reaching the victim is sufficient to make it appear to the victim, that the DoS attack was launched from a node farther away than the actual path length. The paper is organized as follows. We present a background to the problem of traceback by PPM, APPM and AAPM in section 2. In section 3, we present the analysis of the effectiveness of AAPM. In section 4; we use Arena 5.0 to simulate networks of different path length to support our theoretical analysis.
2.
Related Work.
2.1 Probabilistic Packet Marking.
In PPM [4], the router chooses to encode fragments of its IP address in the 16 bit IP identification field of the packet’s header with some fixed probability. The Identification field is divided into a start, end and distance field. When a router decides to mark a packet it encodes its own address in the start field and a zero in the distance field. Otherwise, if the distance field is already zero, it indicates that the packet was marked by the previous router. In this case the router writes its own address into the end field. Finally if the router does not mark the packet it always increments the distance field in the packets. The victim uses the edges in the packets to traceback the attack path.
2.2. Adjusted PPM.
The main idea of APPM [6] is to reduce the computational time for reconstructing the attack path by using a higher marking probability for routers farther away from the
victim. The time for the algorithm to converge mainly depends on receiving samples from the furthest router, which in turn depends on the marking probability. In APPM, the routers mark packets with decreasing probability as the packets traverse towards the destination. Ideally, one would like to receive equal number of marked packets from all routers. To avoid the attacker affecting the marking probabilities of the routers, [6] proposes to mark packets with respect to the distance of the router from the destination. Since the marking probability depends on the distance of the router from the victim, this scheme is not subject to spoofing of the marking field. The routers mark the packets with probability
)
1
/(
1
c
d
vp
. Hered
vis the distance of the router to the victim andc
is a constant. To make(
c
1
d
v)
!
1
, the authors of [6] takec
=30, since most path lengths are bounded by 30. The probability of receiving packets from a router at a distancev
d
from the victim is 1/c. The effectiveness of APPM has been discussed in [10].2.3. Overview of AAPM.
AAPM [1] was proposed with the aim of reducing the computational overhead of traceback. The basic assumption in AAPM is that the victim has a map of upstream [2] routers using which, the victim using the markings in the attack packets, can trace the source of the attack hop by hop, starting at the router closet to it. In AAPM, two independent hash functions
h
andh
'are used to encode routers’ IP addresses into the marking field of the IP header. Bothh
andh
' have 11 bit outputs. Every router marks the packet with a fixed probability p when forwarding the packet. If a routerR
idecides to mark a packet, it writesh
(
R
i)
into the edge field and 0 into the distance field. Otherwise, if the distance is 0 which implies that a previous router has marked the packet, it XORs)
(
'i
R
h
with the edge field value and overwrites the edge field with the result of the XOR. The router always increments the distance field if it decides not to mark the packet. The XOR of two neighboring routers encode the edge between two routers of the upstream router map. All marked packets will contain XOR result of two neighboring routers except for packets marked one hop away from the victim. Sincea
b
a
b
, starting from markings from routers one hop away from the victim, the victim decodes the previous edge. Using independent hash functions it is possible to know the order of the two routers in the XOR result. The victim repeats the steps until it reaches the maximal distance marked in the packets. Thus the victim reconstructs the attack path.3
. Effectiveness of AAPM.
It is know that the attacker cannot fake edges between itself and the victim since routers increment the distance field of packets passing through them. However, the attacker can insert fake edges to make packets appear to have arrived from a distance greater than the actual path length. We assume that the attacker spoofs the marking filed of packets sent in the attack, with router addresses not present in the actual attack path. To illustrate our assumption we consider the network as shown in Figure 1.
Fig1: Network with routers not in attack path
The network consists of an attacker and a victim as shown in the figure. The network also consists of d routers
V
1,...,
V
d1,
V
d between the attacker and the victim and m routersV
d1,
V
d2,…..,V
d
m
at path lengthsd
1
,d
2
,…..,d
m
respectively from the victim. The attacker needs to send packets with distance field0
and an edge value containing the hash of the IP address of the router (V
d1) thus creating a fake edge. If these packets enter the network and arrive at the first router in the attack path (V
d), according to the marking scheme of AAPM, since the distance field is zero, the router will insert the XOR value of the hash of its IP address (V
d) and the hash of the existing value in the edge field of the packet, thus creating an edge betweenAttacker Victim Vd+1 Vd Vd-1 V2 V1 True Attack Path Vd + m
itself (
V
d) and spoofed edge valueV
d1. See Fig 1. Once this edge is created, the attacker needs to create edges betweenV
d1and a routerV
d2at a distance (d+2) from the victim. The attacker inserts fake edges betweenV
d1and
V
d2and inserts 1 in the distance field. The 1 in the distance field indicates that an edge was created between the two previous routers. If this packet is marked, the previous markings will be overwritten. If this packet is unmarked, the routers in the network will at least increment the distance field. With a certain probability these packets will reach the victim unmarked and with a distance field of (d
1
) and an edge value (V
d1,V
d2). The aim of this paper is to show using simulations that the path length can appear to be greater than it actually is using fake edges as explained above. It is shown that the tools for mapping upstream routers can be used against the traceback scheme. Both the fixed probability marking scheme and the variable probability marking scheme are considered in the simulations.The analysis similar to [5] is used for the above network. Let
m
be the fake path length created by the attacker using spoofing. The value ofm
is a function of the fake edgesx
0in the attack packets. We want to maximizem
subject to the constraint that we get packets from the weakest link with edges values (
V
dV
d1) and also the number of each fake edge created is greater than or equal to the number of packets from the weakest link. We assume that all the packets are marked with the spoofing value (V
i,
V
i1),
i
d
1
,
d
2
,....
d
m
. Also, ifd
o
p
N
N
p
n
(
)
D
0(
1
)
is the number of unmarked packets, then(
)
(
p
)
m
d
d
i
s
i
n
p
o
n
¦
, (3.1)where
n
i
s
(
p
)
is the number of packets of each fake edge reaching the victim unmarked.D
i(p) p(1 p)diis the probability of receiving a packet from the ith router in the attack path. If it holds that, the number of packets of each spoofed edge equals the number of marked packets from the first router in the attack path,)
(
...
)
(
)
(
)
(
1 2 1p
n
p
n
p
n
p
n
s m s s (3.2) Then, the attack would appear to have been launched froma distance of
(
d
m
)
. Equating marginal probabilities)
(
...
)
(
)
(
)
(
1 2 1p
p
p
p
s m s sD
D
D
D
(3.3)For the equation 3.4 to hold, it is necessary that the attacker inserts spoofed or fakes edges with a uniform probability.
m
i
V
i
V
x
0
,
1
}
1
/
Pr{
,
i
d
1
,....
d
m
Here, ifD
0is the probability of a packet reaching the victim unmarked andD
1is the probability of a packet reaching the victim marked by the first router and nowhere after the first router, the following the following two cases can be consideredCase I: Fixed Marking Probability: The necessary and sufficient condition for the equation 3.3 to hold is
m
m
(
1
p
)
/
p
1
D
0!
D
(3.4)Using the optimal value of
p
0
.
04
, we havem
24
. From equation 3.4, one would assume that the value ofm
does not in fact depend on distanced
. This implies that, no matter what distance the attacks are carried out from, the attacker will always have the option of including 24 fake edges in the packets.Case II: Decreasing Marking Probability: The necessary
condition for equation 3.4 to hold is
m
D
1D
0!
m
(
1
p
d)
/
p
d (3.5)Here
p
dis the probability of the first router in the attack path, d hops away from the victim to mark the packets. We know thatp
d1
/
c
1
d
.Substituting in the above equation, we have
m
c
d
(3.6) The above result implies that, the number of fake edges reaching the victim depends on the number of routers present on the attack path.4. Simulations Using Arena 5.0.
The simulations are carried out using the simulation software tool, Arena 5.0. Simulations are a very important part of this paper. Using Arena, we could model networks and support the analysis of AAPM in a very easy and effective way. The reason Arena 5.0 was used was because it has a very good Graphical User Interface and complex networks can be easily modeled to illustrate the effectiveness of packet marking schemes. We have simulated networks basically consisting of a Victim and an Attacker and different number of routers in between them. For the case of fixed marking probability, two cases have been considered of different path lengths. The first network is a 5 hop network and the second is a 15 hop network. In both the networks, the packets sent into the network are assigned or inscribed with 24 spoofed edges each of which representing an edge not actually present in the attack path. For the case of variable marking probability, the marking probability is calculated using the
algorithm in section 2.2. We consider a 5 hop network for this case. The count of the fake edges at the victim’s end is a measure of the effectiveness of AAPM.
Case 1: 5 Router Network. The first network consists of 5 routers between the attacker and the victim. The attacker sends all the packets spoofed with 24 different edges. The marking probabilities of all the routers is 4%
Total Number of Packets Sent: 120,000; Number of individual spoofed edges: 120,000 / 24 = 5000; Total Number of Unmarked Packets = 97844; Number of Packets marked by the furthest router from the victim in the attack path = 4076.8; Number of each spoofed edge reaching the victim = 97844/24 = 4076.8;
Simulation Results: Let the 5 Routers in the attack path be named R1, R2, R3, R4 and R5. Let the attacker send 24 fake edges called A, B,…….., X. Table 1 shows the count of unmarked edges and marked packets from the 5 routers. The unmarked packets, consists of different 24 edges and all average around 4070 in number. It is observed that the number of marked packets from R1 which is furthest away from the victim is approximately equal to the number of each unmarked edge. Therefore the simulation results were in agreement with the theoretical results.
Average over 10 Replications Type of Edge Average Count Count A Unmarked 4073.10 Count B Unmarked 4067.40 Count C Unmarked 4073.10 Count D Unmarked 4081.10 Count E Unmarked 4069.00 Count F Unmarked 4072.30 Count G Unmarked 4085.30 Count H Unmarked 4062.70 Count I Unmarked 4076.70 Count J Unmarked 4080.30 Count K Unmarked 4071.70 Count L Unmarked 4074.70 Count M Unmarked 4079.20 Count N Unmarked 4067.60 Count O Unmarked 4069.90 Count P Unmarked 4076.00 Count Q Unmarked 4071.20 Count R Unmarked 4070.60 Count S Unmarked 4074.80 Count T Unmarked 4083.00 Count U Unmarked 4085.90 Count V Unmarked 4064.40 Count W Unmarked 4064.30 Count X Unmarked 4082.00 Record R1 Packets 4072.70 Record R2 Packets 4242.20 Record R3 Packets 4421.50 Record R4 Packets 4659.80 Record R5 Packets 4827.50
Table 1: Count of Marked and Unmarked Packets for Network with 5 routers
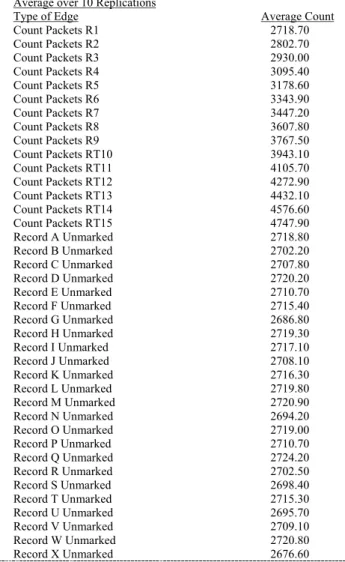
Case 2: 15 Router Network: The second network consists of 15 routers between the attacker and the victim. The attacker sends all the packets spoofed with 24 different edges.
Total Number of Packets: 120,000; Number of spoofed edges = 24; Number of individual spoofed edges = 120,000 / 24 = 5000; Total Number of Unmarked Packets: = 65050.36; Number of Packets marked by the furthest router from the victim in the attack path = 2710.43; Number of each spoofed edge reaching the victim= 65050.36/24 = 2710.43
Simulation Results: Let the 15 Routers in the attack path be named R1 to R15. Table 2 shows the simulation results that give the individual count of packets from the 15 routers and the 24 fake edges named A, B,…, X. It is observed from the table that the count of unmarked edges is individually equal to the number of packets from R1. Therefore the simulation results were in agreement with the theoretical results
Average over 10 Replications
Type of Edge Average Count
Count Packets R1 2718.70 Count Packets R2 2802.70 Count Packets R3 2930.00 Count Packets R4 3095.40 Count Packets R5 3178.60 Count Packets R6 3343.90 Count Packets R7 3447.20 Count Packets R8 3607.80 Count Packets R9 3767.50 Count Packets RT10 3943.10 Count Packets RT11 4105.70 Count Packets RT12 4272.90 Count Packets RT13 4432.10 Count Packets RT14 4576.60 Count Packets RT15 4747.90 Record A Unmarked 2718.80 Record B Unmarked 2702.20 Record C Unmarked 2707.80 Record D Unmarked 2720.20 Record E Unmarked 2710.70 Record F Unmarked 2715.40 Record G Unmarked 2686.80 Record H Unmarked 2719.30 Record I Unmarked 2717.10 Record J Unmarked 2708.10 Record K Unmarked 2716.30 Record L Unmarked 2719.80 Record M Unmarked 2720.90 Record N Unmarked 2694.20 Record O Unmarked 2719.00 Record P Unmarked 2710.70 Record Q Unmarked 2724.20 Record R Unmarked 2702.50 Record S Unmarked 2698.40 Record T Unmarked 2715.30 Record U Unmarked 2695.70 Record V Unmarked 2709.10 Record W Unmarked 2720.80 Record X Unmarked 2676.60
Table 2: Count of Marked and Unmarked Packets for a Network with 15 routers
Case 3: 5 Router Network with Decreasing Probabilities: In this case, the routers mark the packets with decreasing probabilities as the packets traverse towards the victim. A network with 5 routers is considered. Therefore, according to the marking scheme in section 2.2, the marking
probabilities for the 5 routers are as follows, R1 = 0.0384, R2 = 0.037, R3 = 0.0357, R4 = 0.0344, R5 = 0.0333. Since,
m
1
p
d/
p
d25
, the attacker spoofs all the packets with 25 spoofed edges A,B,……X,Y.Total Number of Packets = 125,000; Number of spoofed edges m = 25; Number of individual spoofed edges sent = N/m = 5000; Total Number of Unmarked Packets = 104166.6; Number of Packets marked by each of the routers in the attack path = N/c = 4166.6; Number of each
spoofed edges reaching the victim =104166.6 / 25 = 4166.6
Simulation Result: Table 4 shows the simulation results that give the individual count of packets from the 15 routers and the 25 fake edges named A, B,…, Y. It can be observed from the table that the count of unmarked edges are individually equal to the number of packets from any of the routers. When the victim reconstructs the DoS attack, the 25 fake edges will prevent the victim to identify the exact node from which the attack first entered the network. Therefore the simulation results were in agreement with the theoretical results
Average over 10 Replications
Type of Packet Average Count
Count Packets from R1 4143.30
Count Packets from R2 4161.30
Count Packets from R3 4171.90
Count Packets from R4 4193.20
Count Packets from R5 4175.00
Record A Unmarked 4155.70 Record B Unmarked 4177.10 Record C Unmarked 4163.90 Record D Unmarked 4162.10 Record E Unmarked 4174.80 Record F Unmarked 4163.00 Record G Unmarked 4156.20 Record H Unmarked 4162.40 Record I Unmarked 4163.10 Record J Unmarked 4180.70 Record K Unmarked 4177.60 Record L Unmarked 4176.70 Record M Unmarked 4158.00 Record N Unmarked 4153.10 Record O Unmarked 4167.80 Record P Unmarked 4165.10 Record Q Unmarked 4174.40 Record R Unmarked 4171.10 Record S Unmarked 4160.60 Record T Unmarked 4169.90 Record U Unmarked 4159.80 Record V Unmarked 4164.00 Record W Unmarked 4152.90 Record X Unmarked 4175.50 Record Y Unmarked 4169.80
Table 4: Count of Marked and Unmarked Packets for a Network with 5 routers
Conclusion.
Traceback using AAPM Schemes is a very useful method. It considerably reduces the computational overhead at the victims end by using hash functions for encoding router
information in the packets. However, the unmarked packets would make it appear to the victim that the attack was launched from a node farther away from the actual attacking node. Although AAPM reduces computational overhead by a considerable factor and can also handle Distributed DoS [5] attacks, it still suffers from uncertainty in the authenticity of the traceback. The simulations included in this paper clearly illustrate the amount of uncertainty that can be inserted by the attacker. In the case of fixed marking scheme, no matter from what distance the attack is launched from, there will always be enough unmarked packets to insert an uncertainty factor m=24 Similarly, in the case of decreasing probability, the number of fake edges reaching the victim depends on the number of routers in the attack path. Therefore, when the victim receives these packets and reconstructs the attack path, the fake edges will deceive the victim into reconstructing the path to a greater length than it actually is.
References.
[1] Dawn X. Song and Adrian Perrig, “Advanced and Authenticated Marking schemes for IP traceback,” In Proceedings of IEEE INFOCOM 2001, Anchorage, Alaska, April 2001
[2] Wolfgang Theilman and Kurt Rothermel, “ Dynammic Distance Maps of the Internet,” In Proceeding of INFOCOM 2000, Tel Aviv,Israel, March 2000
[3] P Ferguson and D Senie, “Network Ingress Filtering, Defeating Denial of Service Attacks Which Employ IP Source Spoofing,” RFC (Request for Comments 2267, Janunary 1998
[4] Stefan Savage, David Wetherall, Anna Karlin and Tom Anderson, “Practical Network support for IP traceback,” In
Proceedings of ACM SIGCOMM,, Stockholm, Sweden, Aug
2000
[5] Kihong Park and Heejo Lee, “ On the effectiveness of PPM for IP Traceback under Denial of Service Attacks,” In
Proceedings of IEEE INFOCOM 2001, San Diego,
California, August 2001
[6] Tao Peng, Christopher Lecki and Kotairi Ramamohanroa, “Adjusted Probabilistic Packet Marking,” In Proceedings of Networking 2002, Pisa , Italy ,May 2002
[7] W Feller, “An Introduction to Probability Theory and its Applications,” volume 1, Wiley and Sons, 1966.
[8] Tao Peng, Christopher Leckie and K Ramamohanrao, “ Defending against Denial of Service Attack using Selective Pushback,” In Proceedings of IEEE Internatinal confernce on telecommunications, Bejing China, June 2002
[9] David W Kelton, Randall P. Sadowski, David T. Sturrock, W. Kelton, Randall Sadowski and David Sturrock, “Simulation with Arena,” 3rd Edition, McGraw-Hill, 2003
[10] Bilal Rizvi and Emmanuel Fernandez, “Analysis of Adjusted Probabilistic Packet Marking,” In Proceedings of
IEEE IP Operations and Management, Kansas City,