Research Online
Research Online
University of Wollongong in Dubai - Papers
University of Wollongong in Dubai
2009
Web-graph pre-compression for similarity based algorithms
Web-graph pre-compression for similarity based algorithms
Hamid Khalili
University of Tehran
Amir Yahyavi
University of Tehran
Farhad Oroumchian
University of Wollongong in Dubai, [email protected]
Follow this and additional works at:
https://ro.uow.edu.au/dubaipapers
Recommended Citation
Recommended Citation
Khalili, Hamid; Yahyavi, Amir; and Oroumchian, Farhad: Web-graph pre-compression for similarity based
algorithms 2009.
https://ro.uow.edu.au/dubaipapers/55
Research Online is the open access institutional repository for the University of Wollongong. For further information contact the UOW Library: [email protected]
WEB-GRAPH PRE-COMPRESSION FOR SIMILARITY BASED
ALGORITHMS
Hamid Khalili
Amir Yahyavi
Farhad Oroumchian
University of Tehran
University of Tehran
University of Wollongong in
Dubai
Electrical and Computer
Engineering Department
P.O.Box 14395-515, Tehran,
Iran
Electrical and Computer
Engineering Department
P.O.Box 14395-515, Tehran,
Iran
College of Informatics and
Computer Science
P.O.Box 20183, Dubai,UAE
[email protected]
[email protected]
[email protected]
ABSTRACT
The size of web-graph created from crawling the web is an issue for every search engine. The amount of data gathered by web crawlers makes it impossible to load the web-graph into memory which increases the number of I/O operations. Compression can help reduce run-time of web-graph processing algorithms. We introduce a new algorithm for compressing the link structure of the web graph by grouping similar pages together and building a smaller representation of the graph. The resulted graph has far less edges than the original and the similarity between adjacency lists of nodes is increased dramatically which makes it more suitable for graph compression algorithms. The characteristics of the resulted graph are similar to the original. We also ensure fast decompression of the compressed graph. Partial decompression of the web-graph is also possible. The result of the pre-compression can be loaded into memory and the increased similarity between adjacency nodes makes it suitable for further use of compression and web-algorithms.
1. INTRODUCTION
Web crawlers usually generate a graph structure in which pages are the nodes and links are the edges. This representation of the web graph [4] [7] is the base for most today’s internet algorithms. With ever increasing rate in the growth of WWW, it is no longer possible to have the whole web graph in the main memory of a computer. With billions of pages and billions of links, it is essential to provide a better use of the web graph. Since size is the most important issue in using web-graphs, compression algorithms are needed to provide more efficient presentation of the graph.
Due to the size of web-graph [4][5] , the link structure [11] can only be partially loaded into the memory which is time consuming and increases unnecessarily the I/O interactions. Compressing the graph can speed up the algorithm by removing those unnecessary I/O interactions.
In this paper we focus on problem of compressing the web graph.
We will introduce a new algorithm for compressing the structure of the web graph by removing edges in a reversible manner. Our tests on datasets of very large graphs, derived from crawling the web, have demonstrated the effectiveness of our approach. We have also shown significant improvements on the compression ratio of Huffman algorithm and the differential coding methods like [5] on the web graph processed by our algorithm.
The structure of this paper is as follows: Section 2 provides a history of works on web graph compression. In Section 3 we will introduce our algorithm, followed by experimental results. Afterwards, we will conclude our work with some suggestions for future works.
2. RELATED WORKS
The previous efforts on web graph compression can be divided into two general categories: Entropy Encoding Algorithms referred to as traditional methods, and new methods based on the nature of web graph. Entropy Encoding Algorithms will compress the web graph by giving smaller codes to nodes with higher in-degrees. The new methods, however, benefit from the features of web graph and result in a better compression ratio.
Web graph has two important characteristics. First, it is a sparse graph with dense graphs in some parts. The dense sub-graphs, or communities [8][13][14], have been the subject of research in recent years. The other characteristic of the web graph is the similarity of the link adjacency list of many nodes which is the result of mirror pages on the internet.
The algorithm introduced in [5] has three basic steps: finding nodes with partial similarities in their adjacency lists, selecting one of them as a reference node and replacing the other nodes by their differences from the reference node. This approach results in a greater compression ratio compared to Entropy Encoding schemes. Our algorithm will benefit from this idea in a somewhat different approach. Unlike [5] our algorithm will compress the web graph by removing some of the edges from the adjacency list of the nodes.
A more recent contribution makes use of clustering algorithms for re-indexing the nodes with the aim of representing the link adjacency list of each node by differences between the consecutive indices of out-degree nodes [1]. Our work has the
same goal but with a different approach. Unlike [1] we will re-index the nodes in order to give nodes with similar adjacency lists closer numbers. In particular, we choose a sub sample of graph or inverted-index and re-index it based on the method presented in [1]. The re-indexed graph will be used for edge elimination and grouping algorithm which will produce a graph with the same characteristics to the original graph.
3. WEB-GRAPH STRUCTURE
Web graph is defined as G(V,E) where V is the set of web-pages and E is the set of links. Each web-page is identified by its URL and is represented in the web-graph by a unique index number. Each edge can be defined as a two-tuple that includes the index number of the page which contains the link and the index number of the page that the links points to [6][8][9].
This structure is usually stored in Compressed Storage Formats like CSR (Compressed Sparse Row) [18] which is used to store sparse graphs. In this format the adjacency structure of a graph with n vertices and m edges is represented using two arrays with
xadj with the size of n+1 and adjncy with the size of 2m (this is because for each edge between vertices v and u both (v,u) and
(u,v) are stored).
The adjacency structure of the graph is stored as follows. Assuming that vertex numbering starts from 0, then the adjacency list of vertex i is stored in array adjncy starting at index
xadj[i] and ending at (but not including) index xadj[i+1]. (i.e., adjncy[xadj[i]] through and including
adjncy[xadj[i+1]-1])[16].
Entropy Encoding Algorithms (e.g. Huffman Coding) try to reduce the size of CSR format by assigning smaller index numbers (containing fewer bits) to the pages with higher frequency.
However by using the built-in features of the web graph achieving higher compression rates is possible. One of them being that pages with similar content are very frequent therefore pages with the same topic have many links to these similar pages. Grouping these pages together and storing only one link to the group can dramatically decrease the size.
4. OUR ALGORITHM
In this section we describe our new algorithm. This algorithm is based on the compression of the web graph by re-indexing the similar web pages and then grouping and replacing edges with a similar edge in a group in the link adjacency list of the nodes. The proposed algorithm has the following steps:
First, we re-index the web-graph so that similar pages have a closer page number. Two pages are considered similar if there are a large number of other pages that have links to both of them. The result of this phase is used by the Grouping and Edge-Elimination algorithm. Since re-indexing algorithms are usually slow the balance between speed and compression should be determined based on the application requirements. If for an application the speed is more important than the compression ratio then this phase can be ignored.
Second, we group similar pages together and replace their page numbers in the index with their group numbers. All the edges that point to the nodes from the same group in the link adjacency list of a particular node are replaced with only one edge that points to the group number. In order to keep track of those eliminated edges we use an auxiliary data structure so that we can de-compress the web graph at a later time. Since grouping and decompressing should be very fast, a simple and fast grouping approach is to group the pages with close index numbers together. Since these pages are indexed based on their similarity, similar pages will be grouped together. Community based [13] approaches that find web-communities in order to group them together usually suffer from very low speed due to high processing costs needed to find web-communities. Also since they usually have variable community sizes the auxiliary structure will take up more space and have higher access time. This algorithm preserves the overall characteristics of the graph and also increases similarity between link adjacency lists of nodes [2].
4.1. Re-Indexing Algorithm
The main aim of re-indexing is to give similar nodes closer document IDs. The produced IDs can dramatically improve the performance of the difference and entropy coding (e.g. Huffman) algorithms. We use a tested re-indexing algorithm to permute documents to create locality in the index [1].
We use a document reordering algorithm [1] that re-indexes the documents based on cosines measure for similarity. Similar document (that have similar links) get closer numbers.
Conceptually the Re-Indexing algorithm is divided into three parts. The first part Build-Graph constructs a page-page similarity graph from a web-graph using cosines measure for similarity. The second part Split-Index makes calls to the METIS [16][17] graph partitioning package to recursively partition the graphs produced by Build-Graph. It uses these partitions to construct a hierarchical clustering tree for the web-graph. The third part of the algorithm, Order-Clusters applies rotations to the clustering tree to optimize the ordering. It then numbers the pages with simple depth first traversal of the clustering tree.
The result of the Re-Indexing algorithm is an Index in which similar pages are sorted together. This helps the grouping algorithm to group similar pages together instead of grouping in the order of crawling.
Since this phase of the algorithm is the most time consuming one, if the application’s main criterion is speed or if other compression algorithms will be used along with this algorithm; this phase can be skipped.
4.2. Grouping and Edge Elimination Algorithm
After reordering since similar pages are close to each other we can group k sequential pages together. Therefore, each node’s group number is . Moreover, finding the group number of a particular page or finding members of a group is very straightforward.
The basic idea in edge elimination algorithm is to eliminate all of the edges in the link adjacency list of a node that point to nodes from the same group and instead add an edge that points to the group number. Since all links that were pointing to a group member now point to the group number the overall similarity of the link adjacency list of nodes will dramatically increase [2]. In order to demonstrate the increase in similarity consider page x
in the adjacency of page P1 and page y in the adjacency list of page P2:
,
,
,
Grouping has two major benefits:
1- Similarity based coding methods can work more efficiently since the similarity between link adjacency lists increases.
2- The size of graph is reduced k times which might enable us to load the graph to memory or at least simplify some of the common graph operations. 3- The number of bits required to present each page
number is reduced from log| | to log| | .
The resulted graph can be considered an approximation of the original graph. It can also be used as a smaller representative (with similar characteristics) of the original for several web-algorithms. These algorithms may not need to retrieve the original web-graph from the auxiliary data structure for their operations. For example, the results of the Community Detection algorithms [8] on the representative graph are very similar to the results from the original graph; because similar nodes are already grouped together and now group numbers are detected as community members.
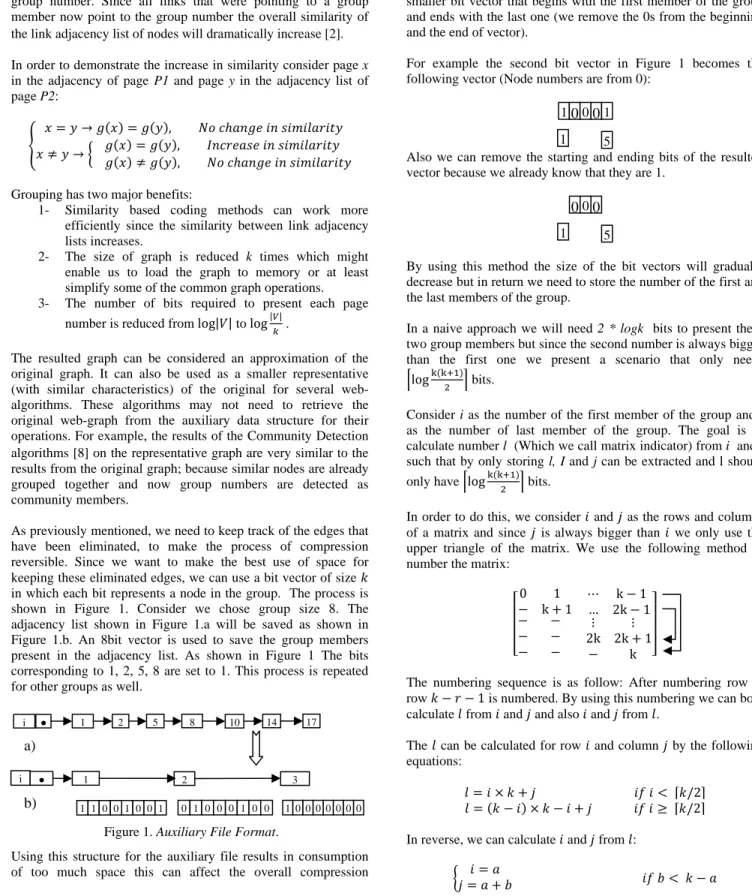
As previously mentioned, we need to keep track of the edges that have been eliminated, to make the process of compression reversible. Since we want to make the best use of space for keeping these eliminated edges, we can use a bit vector of size in which each bit represents a node in the group. The process is shown in Figure 1. Consider we chose group size 8. The adjacency list shown in Figure 1.a will be saved as shown in Figure 1.b. An 8bit vector is used to save the group members present in the adjacency list. As shown in Figure 1 The bits corresponding to 1, 2, 5, 8 are set to 1. This process is repeated for other groups as well.
Figure 1. Auxiliary File Format.
Using this structure for the auxiliary file results in consumption of too much space this can affect the overall compression
efficiency. For example in Figure 1, storing group 3 takes up more space than storing its sole member node 17. To address this problem the following method is used:
Instead of using a bit vector with the size of group we use a smaller bit vector that begins with the first member of the group and ends with the last one (we remove the 0s from the beginning and the end of vector).
For example the second bit vector in Figure 1 becomes the following vector (Node numbers are from 0):
Also we can remove the starting and ending bits of the resulted vector because we already know that they are 1.
By using this method the size of the bit vectors will gradually decrease but in return we need to store the number of the first and the last members of the group.
In a naive approach we will need 2 * logk bits to present these two group members but since the second number is always bigger than the first one we present a scenario that only needs
log bits.
Consider i as the number of the first member of the group and j as the number of last member of the group. The goal is to calculate number l (Which we call matrix indicator) from i and j such that by only storing l, I and j can be extracted and l should only have log bits.
In order to do this, we consider and as the rows and columns of a matrix and since is always bigger than we only use the upper triangle of the matrix. We use the following method to number the matrix:
0 1
k 1 … 2kk 11
2k 2kk 1
The numbering sequence is as follow: After numbering row , row 1 is numbered. By using this numbering we can both calculate from and and also and from .
The can be calculated for row and column by the following equations:
/2 /2
In reverse, we can calculate and from :
0
0
0 1 5 10
00
1 1 5 i ● 1 2 5 8 10 14 17 i ● 1 2 3 1 1 0 01 0 0 1 0 1 0 0 0 1 0 0 1 00 0 0 0 0 0a)
b)
– 1
1
Where and are quotient and remainder of division of to
1 respectively:
1
Since can get values between 0 to and can get values between and therefore can get values between and . As a result l only needs log bits.
We show that for 1 using instead of and takes up less space: 2 1 2 1 2 0 1 2 1 1
The following inequality shows the minimum for choosing the number of bits ( ) to present :
k k 1
2 2
should be selected so that it is as close to log as possible.
By using the above method several group sizes may need the same number of bit for presentation. This fact is shown in Error!
Not a valid bookmark self-reference. for group sizes from 16 to 22. Since bigger group sizes result in higher compression ratio therefore choosing the largest group sizes with the same number of required bits for presentation is the best choice.
Table 1. Group size and the number of bits required to present the group
Group Size 16 17 18 19 20 21 22
/ 136 153 171 190 210 231 253
bits required 8 8 8 8 8 8 8
4.3. Decompression
The compressed format of the adjacency list contains group numbers instead of page numbers. In order to decompress the adjacency list of a node we use the matrix indicator and bit vector from the auxiliary file. From the matrix indicator we can calculate the first ( ) and the last member ( ) of the group. Other page numbers can be calculated from the bit vector.
One of the big advantages of this method is that we can partially decompress the web-graph meaning that we only decompress the adjacency lists of the pages that we require.
Decompression is a much faster process than compressing the web graph because it doesn’t involve several time consuming operations such as re-ordering. Since compression is only done once on the web graph bearing the overhead is possible but for every usage of web graph we need partial or complete decompression of the web graph; therefore, decompression speed is of much more importance.
5. COMPUTATION COMPLEXITY
The re-ordering phase of the algorithm is the most time consuming part of the algorithm. For further reading we refer the reader to [1]. Grouping and edge elimination process is | | , since it is done by one iteration on the web-graph.
We should keep in mind that the edges in the link adjacency list of each node are sorted in increasing order based on the index value of the nodes that they are pointing to. This will reduce the processing time of finding edges that point to node members belonging to the same main group in the adjacency list of a node. In the decompression process, we can calculate the first and the last member of the group from matrix indicator with 1 . Other group members can be extracted from the bit vector which in the worst case is . Extraction from the auxiliary file is only necessary if we want the exact adjacency list which is not necessary for many web-graph processing purposes.
In comparison to community based compression approaches which try to use the natural locality in web communities since in our algorithm similar pages are sorted together we can achieve the same compression rates but with much less processing time and space.
6. INVERTED INDEX
Datasets produced by crawling engines contain very large Inverted-Indices. These indices can also enjoy the benefit of our pre-compression algorithm.
The inverted index data structure is a central component of a typical search engine indexing algorithm. One of the goals of a search engine implementation is to optimize the speed of the query; i.e. find the documents where word X occurs faster. First a forward index is generated, which stores lists of words per document; next the forward-index is inverted to create an inverted index. Querying the forward index would require a sequential pass through each document in the collection, which is not realistic.
Inverted index is described as a set of terms … . For every term there is an associated list of | | document numbers
, … , [1] . In Inverted Index (or Index) each term-document
(or document-term) list is very similar to the adjacency list of a web-graph. Two terms (or documents) are considered similar if they have similar documents (or terms) in their list.
The pre-compression algorithm can be applied to Inverted-Index just as easily as it can be applied to web-graph.
7. TEST RESULTS
We tested our algorithm on several datasets with very large graphs (e.g., millions of links) produced by UbiCrawler [19] (CNR 2000, IN 2004, EU 2005)[20]. We examined the effect of choosing different group sizes and re-ordering on the achieved compression. We also compared the results without considering auxiliary data structures since auxiliary file is only necessary for complete decompression of the web-graph.
Table 2. Size improvement and Bit per Link for CNR 2000 with different Group Sizes and The effect of Re-Ordering. CNR 200 Collection, 325557 Nodes, 3216152 Edges CNR 2000 Group Size 30 35 40 45 50 Not-RO %Improv 65.43 65.52 67.04 66.96 66.84 bpl 7.21 7.19 6.87 6.89 6.91 RO %Improv 69.19 69.32 70.73 70.69 70.60 bpl 6.45 6.42 6.12 6.13 6.15
As seen in We tested our algorithm on several datasets with very large graphs (e.g., millions of links) produced by UbiCrawler [19] (CNR 2000, IN 2004, EU 2005)[20]. We examined the effect of choosing different group sizes and re-ordering on the achieved compression. We also compared the results without considering auxiliary data structures since auxiliary file is only necessary for complete decompression of the web-graph.
Table 2, increasing the group size somewhat improves the compression ratio. The improvement depends on the size of the original web-graph. Bigger and denser web-graphs achieve higher compression ratios. We tested our algorithm on several datasets with very large graphs (e.g., millions of links) produced by UbiCrawler [19] (CNR 2000, IN 2004, EU 2005)[20]. We examined the effect of choosing different group sizes and re-ordering on the achieved compression. We also compared the results without considering auxiliary data structures since auxiliary file is only necessary for complete decompression of the web-graph.
Table 2 also demonstrates the effect of re-ordering on the compression ratio. It seems re-ordering produces is almost fixed improvement in each case.
Table 3. Size improvement and Bit per Link for CNR 2000 with different Group Sizes and The effect of Re-Ordering Without considering the auxiliary file size.
CNR 2000 Group Size 30 35 40 45 50 Not- RO-W/O AUX %Improv 77.73 78.23 80.12 80.46 80.68 bpl 4.64 4.54 4.14 4.07 4.03 RO-W/O AUX %Improv 80.06 80.49 82.19 82.44 82.61 bpl 4.17 4.08 3.73 3.67 3.64
In As seen in We tested our algorithm on several datasets with very large graphs (e.g., millions of links) produced by
UbiCrawler [19] (CNR 2000, IN 2004, EU 2005)[20]. We examined the effect of choosing different group sizes and re-ordering on the achieved compression. We also compared the results without considering auxiliary data structures since auxiliary file is only necessary for complete decompression of the web-graph.
Table 2, increasing the group size somewhat improves the compression ratio. The improvement depends on the size of the original web-graph. Bigger and denser web-graphs achieve higher compression ratios. We tested our algorithm on several datasets with very large graphs (e.g., millions of links) produced by UbiCrawler [19] (CNR 2000, IN 2004, EU 2005)[20]. We examined the effect of choosing different group sizes and re-ordering on the achieved compression. We also compared the results without considering auxiliary data structures since auxiliary file is only necessary for complete decompression of the web-graph.
Table 2 also demonstrates the effect of re-ordering on the compression ratio. It seems re-ordering produces is almost fixed improvement in each case.
Table 3 the size of auxiliary data structure is not considered. Ignoring the auxiliary file can dramatically improve the compression ratio achieved by algorithm. This is most suitable when the algorithm only needs the compressed graph for its operation. In this case usually the compressed graph can be loaded into the memory.
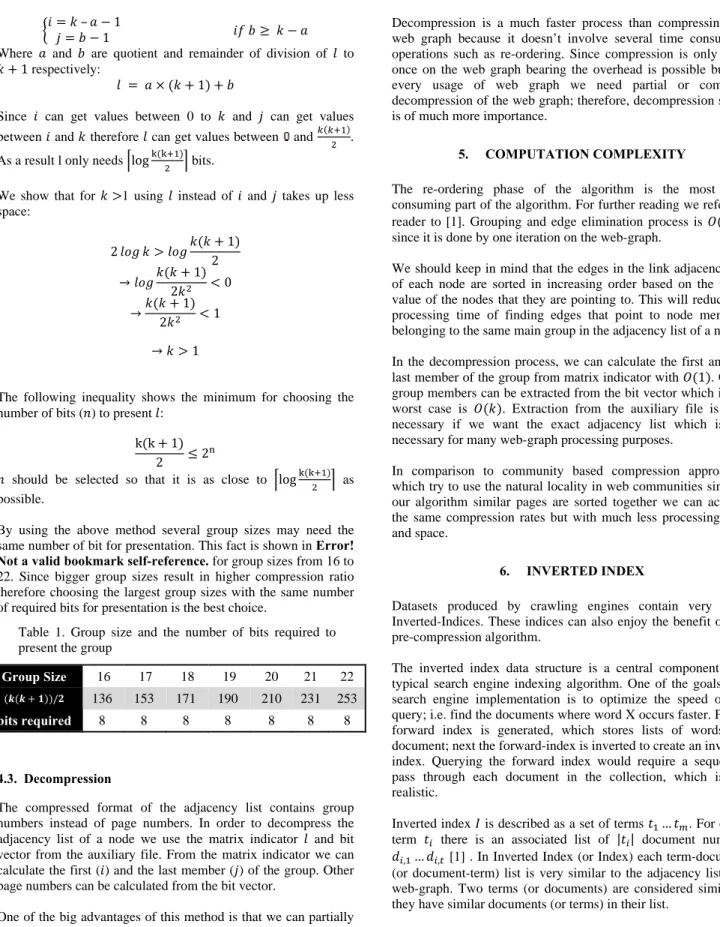
Figure 1. Size improvement for CNR 2000 with different Group Sizes and The effect of Re-Ordering With and Without considering the auxiliary file size.
Figure 1 demonstrates the algorithm’s behavior for a variety of group sizes. It also compares the effect of auxiliary file on the compression ratio. As seen in Figure 1 by increasing the group size, the overall compression is improved but increasing the group size further results in lower compression ratios. This is because the increment ratio of the auxiliary file size is higher than the decrement ratio of the compressed graph’s size.
8. CONCLUSIONS
In this paper we presented a very fast (without reordering) compression algorithm which can be used to achieve good size improvements. Since our algorithm provides a pre-compression method for similarity based compression algorithms therefore higher compression ratios can be achieved. This method can also
55 60 65 70 75 80 85 90 30 32 34 36 38 40 42 44 46 48 50 52 54 56 58 60 62 64 66 68 70 % Si ze Im prov em en t Group Size Not Re‐ordered Re‐ordered
Not Re‐ordered Without Auxiliary Re‐ordered Without Auxiliary
improve the performance of difference coding and entropy coding algorithms. We believe this improvement is the result of increased similarity between adjacency list of web-pages. Also the characteristics of the resulted graph are very similar to the original graph; Therefore, many web-algorithms can be used without decompression. Decompression of the graphs is very fast and partial decompression of the graph is also possible.
9. REFERENCES
[1] Blandford, D. & Blelloch, G. “Index compression through document reordering.” Data Compression Conference, 2002. Proceedings. DCC 2002, p.342-351.
[2] Mahdian, A., Khalili H., Nourbakhsh, E., and Ghodsi, M. “Web Graph Compression by Edge Elimination.” In Proceedings Data Compression Conference, DCC 2006, 459, 2006.
[3] DUFF, IS, GRIMES, RG. and LEWIS, JG. “Sparse Matrix Test Problems.” ACM Transactions on Mathematical Software 15, no. 1 (1989): 1-14.
[4] Kleinberg, JM, Kumar, SR., Raghavan, P., Rajagopalan, S. and Tomkins, AS. “The Web as a Graph: Measurements, Models and Methods.” LECTURE NOTES IN COMPUTER SCIENCE (1999): 1-17.
[5] Adler, M, and Mitzenmacher, M. “Towards compressing web graphs.” In Proc. of the IEEE Data Compression Conference (DCC), 203-212, 2001.
[6] Kleinberg, J. and Lawrence S. “The structure of the web.”
Science 294, no. 5548 (2001): 1849-1850.
[7] Laura, L., Leonardi S., Caldarelli, G. and De Los Rios, P. “A multi-layer model for the webgraph,” Proceedings of the 2nd International Workshop on Web Dynamics, 2002.
[8] Raghavan, S, and Garcia-Molina, H. “Representing Web graphs.” In Proceedings of 19th International Conference on Data Engineering, 2003, 405-416, 2003.
[9] Kumar, R, Raghavan, P., Rajagopalan, S., Sivakumar, D., Tomkins, A. and Upfal, E. “Stochastic Models for the Web Graph.” In Annual Symposium On Foundations Of Computer Science, 41:57-65, 2000.
[10]Reddy, PK, and Kitsuregawa, M. “An approach to relate the web communities through bipartite graphs.” In Proceedings of WISE 2nd, 302-310, 2001.
[11]KLEINBERG, JONM. “Authoritative Sources in a Hyperlinked Environment.” Journal of the ACM 46, no. 5 (1999): 604-632.
[12]Blandford, DK, Blelloch, GE. and Kash, IA. “Compact representations of separable graphs.” In Proceedings of the fourteenth annual ACM-SIAM symposium on Discrete algorithms, 679-688. Society for Industrial and Applied Mathematics Philadelphia, PA, USA, 2003.
[13]Flake, GW, Lawrence, S. and Giles, CL. “Efficient identification of Web communities.” In Proceedings of the sixth ACM SIGKDD international conference on Knowledge discovery and data mining, 150-160. ACM New York, NY, USA, 2000.
[14]Tawde, VB, Oates, T. and Glover, E. “Generating Web Graphs with Embedded Communities.” Lecture Notes In Computer Science (2004): 80-91.
[15]Gibson, D, Kleinberg, J. and Raghavan, P. “Inferring Web communities from link topology.” In Proceedings of the
ninth ACM conference on Hypertext and hypermedia: links, objects, time and space, 225-234. ACM Press New York, NY, USA, 1998.
[16]Karypis, G, and Kumar, V. “A Fast and High Quality Multilevel Scheme for Partitioning Irregular Graphs.” Siam Journal On Scientific Computing 20 (1999): 359-392. [17]Karypis, G., and Kumar, V. “Multilevel Graph Partitioning
Schemes.” Proceedings of The International Conference on Parallel Processing, 1995.
[18]Smailbegovic, F.S., Gaydadjiev, G. N. and Vassiliadis, S., “Sparse Matrix Storage Format,” Proceedings of the 16th Annual Workshop on Circuits, Systems and Signal Processing, ProRisc 2005, pp. 445-448, Veldhoven, the Netherlands, November 2005
[19]Boldi, P., Codenotti, B., Santini, M. and Vigna, S. “UbiCrawler: a scalable fully distributed Web crawler.”
Software Practice and Experience 34, no. 8 (2004): 711-726. [20]Boldi, P. and Vigna, S. “The webgraph framework I:
compression techniques.” In Proceedings of the 13th international conference on World Wide Web, 595-602. ACM Press New York, NY, USA, 2004.