Abstract—Nowadays, most substations are equipped with Intelligent Electronic Devices (IEDs) performing data collection. With the advancement of measurement techniques and growing availability of information captured by newly emerged IEDs such as Phasor Measurement Units (PMUs), it is imperative to integrate the various data sources with traditional Supervisory Control and Data Acquisition (SCADA)/Energy Management System (EMS) structure. This paper explores several possible solutions for data integration and its applications in power system. Also addressed is a set of new visualization tools to be used in power system control center. It shows that the merging of Remote Terminal Unit (RTU), PMU and other substation IED data could effectively improve the ability to detect cascades, efficiently process alarms, and accurately determine the location of faults. The resulted intelligent control center visualization tools could enrich monitoring capabilities and help operators maintain adequate situational awareness.
Index Terms—IEDs, data integration, alarm processing, fault location, cascading event analysis, visualization tools
I. INTRODUCTION
OWER system is featured by numerous data collecting points and a variety of measurement devices. Beyond the traditional Supervisory Control and Data Acquisition (SCADA) system composed of Remote Terminal Units (RTUs), there are many other substation Intelligent Electronic Devices (IEDs) serving the function of data collection. These modern IEDs can record and store a huge amount of data with a periodicity depending upon the intended purpose of the device: Digital Protective Relays and Digital Fault Recorders (DPRs and DFRs) capturing data during fault occurrence (termed as non-operational data), and Phasor Measurement Units (PMUs) capturing continuous time-synchronized phasors (termed as situational awareness data).
SCADA system solution has been used to provide real-time information about power system states since the late sixties. The implementation of SCADA solutions improved the performance of Energy Management System (EMS) functions. Although the newly emerged multifunctional IEDs are not standardized regarding the functions they perform, they indeed
The reported development was coordinated by the Consortium for Electric Reliability Technology Solutions (CERTS), and funded by the Office of Electric Transmission and Distribution, Transmission Reliability Program of the U.S. Department of Energy.
The authors are with the Department of Electrical and Computer Engineering, Texas A&M University, College Station, TX 77843 USA (e-mails: [email protected]; [email protected]; [email protected]; [email protected]).
are necessary additions to the data recording infrastructure needed for performing a comprehensive analysis of substation equipment operation. The merging of various substation data with the data from SCADA solutions to enhance EMS functions has not yet been explored adequately [1].
A few studies have been reported that address this topic. They primarily discuss how to extract desired information from field measurements and improve the quality of control center visualization tools in terms of good graphical representations [2]-[4]. In [2], the inefficiency of using numerical data to display system conditions is identified, and three key characteristics of effective graphical representations are illustrated. In [3] and [4], the concept of Geographic Data Views (GDVs) has been introduced, which uses dynamically created visualization tools to display a wider range of power system information than what is possible using the existing geographically based visualization tools. In particular, the research of [4] utilizes GPS-based information provided by PMUs to display power system status in real-time. In some other research, high-resolution satellite images are used to provide 2-D and 3-D representations [5, 6].
With the growth of its complexity, power systems are becoming more stressed and exposed to all kinds of disturbances. To adapt to the emerging situation, several new applications deploying integration of field measurements have been introduced both in research and practice [7]-[12]. They utilize data from SCADA RTUs, PMUs and other IEDs to analyze alarms, detect cascades and locate faults. Traditionally the substation data are acquired using RTUs of SCADA and sent to the EMS in every two to ten seconds. But the SCADA measured data does not have the characteristics needed to implement the new analysis and control tools due to the lack of time-synchronized sampled waveform data. The purpose of this paper is to investigate the integration of various data with traditional SCADA system data, and its utilization in applications, as well as the control center visualization tools to enhance EMS functions.
The paper starts with an investigation of specific field data requirements for different applications. After that a framework of data integration used in applications is proposed. The development of new control center visualization tools is introduced then. Implementation considerations of how to bind the visualization tools with application modules through communication channels are discussed at the end.
Data Integration Used in New Applications and
Control Center Visualization Tools
Ce Zheng, Yimai Dong, Ozgur Gonen, and Mladen Kezunovic, Fellow, IEEE
II. NEW APPLICATIONS USING DATA INTEGRATION Knowing the potential benefits that data integration may provide to the power industry, several issues still remain to be solved in this regard: (1) For a particular application, which data should be used and when; (2) How to glean useful information from huge amounts of original measurements and (3) How to handle the extracted information in applications. A review of recently published literature reveals that three new applications could become the beneficiaries of data integration. They are intelligent alarm processor, optimized fault location and cascading event analysis [8, 9, 12]. Their data requirement specification and data integration framework will be explored in this section.
A. Intelligent Alarm Processor
The requirement for power system operators to respond more efficiently to the stressed power system conditions may create need to process large number of alarms. This asks for implementation of advanced alarm processor that can help operators recognize the nature of disturbance quickly and reliably. Such an application of an intelligent alarm processor is reported in [8].
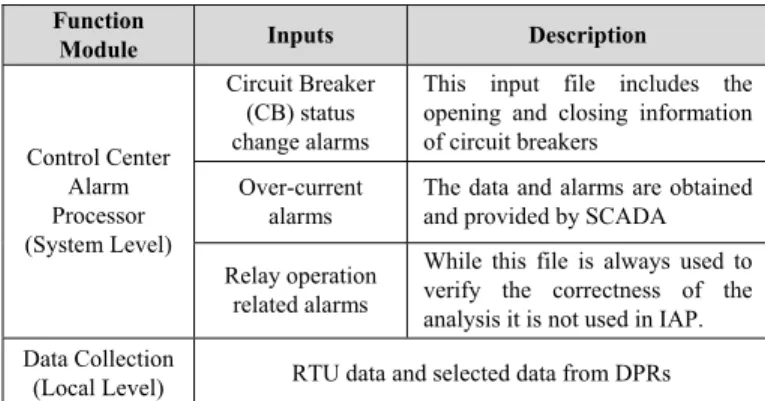
In order to implement this intelligent alarm processor at both system and local levels, different types of data from various sources are required, which are naturally divided into two classes: system level data and substation data. The data requirements for the new implementation of the intelligent alarm processor are specified and described in Table I.
At the system level, information that is required by different functional modules is extracted from field measurements according to their respective needs. At the local level, it could be observed that the data required by this alarm processor is a combination of RTU measurements and measurements from other IEDs (e.g. DPRs). Currently in United States, a common practice in power industry is to only automate the sending of data collected by RTUs to control center through SCADA system. All other IED data remain in the device memory to be uploaded manually at a later time. If data stored in these IEDs could be integrated with the SCADA system data, and uploaded automatically whenever needed, it will greatly reduce the response time and improve the efficiency of the analysis tools such as intelligent alarm processor.
TABLEI
DATA REQUIREMENTS FOR INTELLIGENT ALARM PROCESSOR
Function
Module Inputs Description
Control Center Alarm Processor (System Level) Circuit Breaker (CB) status change alarms
This input file includes the opening and closing information of circuit breakers
Over-current alarms
The data and alarms are obtained and provided by SCADA Relay operation
related alarms
While this file is always used to verify the correctness of the analysis it is not used in IAP. Data Collection
(Local Level) RTU data and selected data from DPRs
B. Optimized Fault Location
The optimized fault location method selects a suitable Fault Location (FL) algorithm from three types of algorithms: two-end FL algorithm based on synchronized phasors or samples, single-end phasor based FL algorithm, and system-wide sparse measurement based FL algorithm. Details of this application are reported in [9]. The measurement equipments used are sparsely located Digital Fault Recorders (DFRs) or other GPS-synchronized IEDs (e.g. PMUs). Commercial software like PSS/E and PowerWorld have been utilized to run power flow analysis and display the fault location respectively [13, 14]. The requirements of the field data needed for this application are listed in Table II.
At the substation level, the availability of data collected from DFRs and PMUs makes it possible to implement some new fault location algorithms. Integrating the data from these IEDs with traditional SCADA solution data enables real-time monitoring of power system and fast operator actions. It could also be observed from Table II that data interpretation is an important issue when implementing the new fault location algorithm.
TABLEII
DATA REQUIREMENTS FOR OPTIMIZED FAULT LOCATION
Function
Module Inputs Description
Power Flow Analysis (System Level)
Power flow raw data from input data files for PSS/E (*.raw)
This file contains power flow data for the establishment of an initial case. Tuning of Static System Model (System Level) RTU measurements from SCADA Historian Database
This file contains the latest load, branch and generator data to tune the static system data Short Circuit
Study (System Level)
Sequence impedance data from input data files
for PSS/E (*.seq)
This file contains the negative and zero sequence impedance data needed for short circuit study.
Visualization of Fault Location (System Level)
System binary data and graphical data from input files for PowerWorld (*.pwb
and *.pwd)
These files are used by the PowerWorld Retriever to visualize the fault location. It contains power system binary and graphical data.
Optimized Fault Location (Local Level)
Recorded data during faults from
DFRs and PMUs
These are the fault event data to be used in optimized fault location algorithm.
Substation interpretation data from Interpretation
Data (*.int)
1. Relates the channel numbers to the monitored signals; 2. Correspondence between the nomenclature used in DFR files and those used in PSS/E.
C. Analysis of Cascading Events
Power system cascading event is quite often a very complex phenomenon with low probability of occurrence but may potentially cause catastrophic social and economical impacts. Recent study reveals that early and proper control actions at the steady state stage may prevent the possible cascading events. However, power system operators lack sufficient analysis and decision support tools to take quick corrective actions needed to mitigate unfolding events.
TABLEIII
DATA REQUIREMENTS FOR CASCADING EVENT ANALYSIS
Function
Module Inputs Description
Power Flow Analysis (System Level)
Power flow raw data
This file contains power flow system specification data for the establishment of an initial case. Slider binary data
or drawing coordinate data
This file is used to create and modify one-line diagrams and to display a variety of results. Contingencies Analysis (System Level) Description of system, elements, and contingency
These three data files are used to build Distribution Factor Data File (*.dfx)
Load throwover data file
This file contains the bus load throwover data for use in contingency analysis.
Fault Analysis (System Level)
Sequence impedance data
Same as the data file used in optimized fault location
Dynamic Analysis (System Level)
Dynamics Data
It contains dynamic data of synchronous machines and other system components.
Machine Impedance Data
This data describes the unit configuration at the generator buses. Neural Network based Fault Detection and Classification (Local Level)
Event file output from DPRs
The relay event file contains the report of relay operations. Recorded data
from DFRs and DPRs
DPRs and DFRs data used for evaluation of relay operations using NNFDC. Synchronized Sampling based Fault Location (Local Level) Synchronized samples from GPS-based IEDs
Synchronized samples used for evaluation of SSFL
Recently a novel interactive scheme of system and local monitoring and control tools for detection, prevention and mitigation of cascading events was introduced in [12]. The data requirements for this scheme are clarified in Table III.
From Table III it can be observed that the substation level function modules will need to take use of data coming from PMUs and other IEDs, including synchronized phasors and synchronized samples. Integrating such data with the traditional SCADA data could produce a lot of benefits. Compared to the fault location algorithm that use one-end or two-end data, the Synchronized Sampling FL (SSFL) method using synchronized samples, which is adopted in cascading event analysis, is transparent to the assumptions about fault condition and system operating state. Therefore it is less affected by those factors and utilizes the useful time-domain information in the waveform to locate the fault precisely.
D. Data Integration Framework
Now that data requirements for each application have been specified, the issue of how to integrate data to benefit different applications needs to be explored. The concept of “Data Integration” in this research is in fact consisting of three consecutive tasks: data collection, data incorporation and data interpretation.
The task of data collection is executed at the substation level. The recorded data could be divided into three categories: SCADA data collected by RTUs (termed as operational data), synchronized samples and phasors captured
by GPS-enabled IEDs, and measurements collected by other IEDs. In our proposed framework, all the recorded measurements need to be sent to the Central Server Database for incorporation. Time-correlated data are re-arranged and queued according to their type and time tag, waiting for next processing step: interpretation.
Three reasons make data interpretation necessary:
z The data recording equipments are very versatile, since they came from various vendors with little interoperability; z Utilities keep upgrading or constructing substations based
on their operation needs, causing different IED types to have been installed in different time periods;
z At the system level, different data formats are needed in different application groups, which depend on the operation procedures that the group adopted.
The diversity of data formats is one major problem. Non-operational data usually comes in the COMTRADE data format and IEC 61850 object model metadata standard for IEDs that are IEC 61850 compatible [15, 16], whereas the data collected from PMUs follows the format for synchrophasors [17]. In addition, data may be further formatted using the IEEE File Naming Convention Standard [18]. To solve this problem, a data interpreter is required to convert field measurements with various formats into applicable data files for future uses.
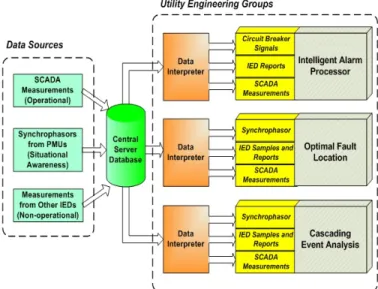
With regard to the above three tasks involved in the data integration process, the conceptual framework for data collection, incorporation and its interpretation in applications will be proposed first, which is shown in Fig. 1.
As depicted in Fig. 1, data sources like SCADA RTUs, PMUs and other IEDs are at the bottom layer. Central Server Database is responsible for concentrating and maintaining substation data. Data interpreter is located at the top layer to convert original field measurements into applicable data files based on the needs of different applications.
It should be noted that this framework is at a conceptual level. In Section IV, implementation and communication schemes to realize this framework will be explored in detail.
III. DATA INTEGRATION USED IN CONTROL CENTER VISUALIZATION TOOLS
Real-time visualization of power system conditions is essential during the decision-making process in the system control center. With growing availability of various data collected by traditional and innovative devices, how to glean useful information from the huge amount of measurements for the use of effective visualization still remains a problem to be solved. To improve the effectiveness of control center monitoring, a set of new graphical tools is developed in this research. Three areas where accomplishments are achieved include:
z Seamless incorporation of novel applications with the new visualization tools;
z Design and development of six Graphical User Interface (GUI) modules with respective functionalities;
z Identification of the implementation sequence for different applications and arrangements of visualization modules.
A. Design of Graphical User Interfaces
With the purpose of providing operators an effective view of the system states, six Graphical User Interfaces (GUIs) are designed and developed in this research. Following is a brief introduction of these visualization modules and their respective functions:
z Hierarchical View module
This module is used to monitor system behavior while system is in steady state. Real time data are imported from SCADA database.
z Electrical View module
Real time power flow is shown on system one-line diagram in the Electrical View interface. When event occurs, alarms and faulted lines will be displayed.
z Ontological View module
This module displays how the Petri-net Logic is executed in Intelligent Alarm Processor, i.e. how the irrelevant alarms are suppressed and how the essential alarms are extracted. Fig. 2 depicts the GUI integrated in this module.
Fig. 2. Petri-net alarm processing diagram shown in the Ontological View module of the user interface
z Topological View module
This module displays the connectivity of the various components in the power system. The breaker/switch position will be shown to facilitate retrieving fault event information.
z Aerial View module
Satellite images will be processed and displayed in this module. A clear view of the terrain and power lines connection around fault location will be provided.
z Equipment Model View module
In this module, 3-D models are designed and created to provide constructional and operational view of the power system equipment of interest.
B. Implementation structure of the software
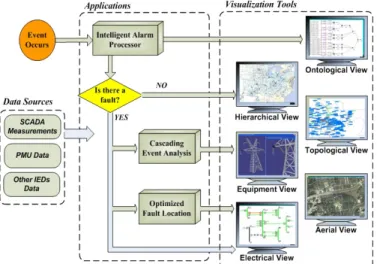
The implementation structure of the proposed graphical tools is shown in Fig. 3.
Fig. 3. Implementation structure of the control center visualization tools with applications utilizing data integration
With data collected from substations and processed in application tools, the analysis results will be displayed using the six proposed visualization modules to provide operators with comprehensive representations of the system states. Implementation details, in particular the communication schemes to realize this structure will be explained later in Section IV.
C. Case Demonstration
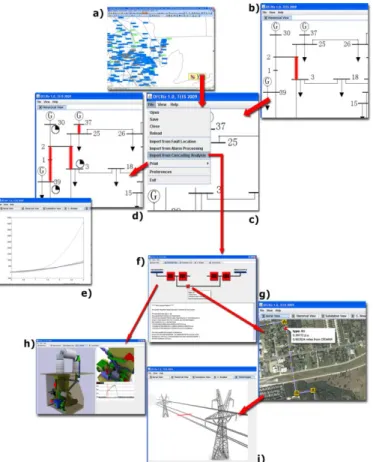
A case demonstration by running the proposed software for a given event scenario is provided in this section. A line-to-line fault event has been created and simulated. After automatic actions of relays and circuit breakers, at 1.437s the fault evolved into a cascading event and system lost its stability. Fault event data are recorded by various IEDs and sent to different application groups. Analysis reports are presented to control center operators via a set of GUIs, which are shown in Fig. 4.
Fig. 4. Case demonstration by running the visualization tools for a fault event Pipeline of the software GUI activations shown in picture a) to i) is described next:
z Interface a) is the system topological view, and b) is the system electrical view. They are used for monitoring the normal state of the system, which constitutes the Hierarchical View module.
z When an event/disturbance occurs, immediate notification is presented to operators, and related system elements will be highlighted in the Hierarchical View interfaces (interface a) and b)).
z Interface c) shows the incorporation of the three new applications in the software. By selecting corresponding menu items, operators could import analysis reports from different applications whenever a fault happens.
z If the analysis report from the Intelligent Alarm Processor is imported, the animated process of alarm filtering will be displayed on the interface c), as shown in Fig. 2, which constitutes the Ontological View module.
z After importing the report from cascading event analysis, interfaces d) and e) will pop up, which displays the cascading event analysis results, including Critical Clearance Time (CCT), Machines Angle Curve, Automatic Control Scheme, etc. (During steady state, this will enable displaying the results of N-1 Contingency Analysis)
z After importing the report from the Optimized Fault Location module, if the operator clicks highlighted lines, interface f) will pop up to display the fault details.
z By clicking the fault icon on the interface f), interface g) pops up, which displays the satellite images around the fault. This constitutes the Aerial View module.
z By clicking the Circuit Breaker (CB) icon on the interface f), the construction and operation models for circuit breaker will pop up (shown by the interface h)).
z By clicking the tower icon on the interface g), interface i) will pop up, which displays the 3-D construction model of towers and fault type demonstration.
z Interactive functions such as zooming, clicking and dragging are available in most of the developed GUIs. Using the real-time information provided by the proposed software, operators will have a better understanding of what is going on in the system immediately after an event occurs. Thus they will have enough time to constrain the impact of the fault to local level. The possible occurrence of a cascading event could be effectively detected and prevented in advance.
IV. IMPLEMENTATION CONSIDERATIONS
The data integration framework introduced in Section II will be implemented in this section. Several issues need to be considered when integrating data for the use of different applications and related control center visualization tools:
z Communication paths for optimizing data exchange between substation, application groups and control room; z Congestion processing scheme for prioritizing analysis
reports in case of communication congestions;
z New work flow management for utility groups for making better use of extracted information.
A. Communication Consideration
z Communication Paths
A conclusion of data flow study is listed in Table IV. Data is categorized into four classes: 1) raw data, 2) pre-processed data from substation 3) reports and 4) historical data. Raw data is the data collected by SCADA RTUs without pre-processing at substation level. It is not directly engaged in functionalities, but is used only for archiving. Substation information package contains information about CB Status, power flow (PF) data, DFR event reports, alarms, relay operation reports, synchronized samples, real-time load and connectivity information and other information that has been received from substation RTUs and other IEDs, and selected and processed at the substation level. Reports refer to the analysis reports generated by different applications and being exchanged among departments in the control center. Historical data is the data retrieved from the database and serves in some of the algorithms for the optimized fault location.
TABLEIV
CONTROL CENTER LEVEL DATA FLOW
NO Name From To Class Requirements
1 CB Status Substation Package Processing Alarm 2 Real-Time 2 OC Alarm Substation Package Processing Alarm 2 Real-Time 3 Operation Relay Substation Package Processing Alarm 2 Real-Time 4 PF Data Substation Package Fault Location 2 Real-Time
5 Historian Database Fault Location 4 Offline 6 Event files Substation Package Fault Location 2 Real-Time 7 System
Info.
Substation
Package Fault Location 2
Real-Time 8 Request Location Fault Database -- -- 9 ed Samples Synchroniz Substation Package Event Analysis Cascading 2 Synchronization 10 PF Data Substation Package Event Analysis Cascading 2 Real-Time 11 Information System Substation Package Event Analysis Cascading 2 Real-Time 12 Event files Substation Package Event Analysis Cascading 2 Real-Time 13 Alarm report Processing Alarm Fault Location 3 -- 14 Alarm Report Alarm Processing Cascading Event Analysis 3 -- 15 Report Alarm Processing Alarm Visualization Unit 3 -- 16 Fault Location Report Fault Location Visualization Unit 3 --
17 Cascading Report Cascading Visualization Unit 3 -- 18 Raw Data Substation Package Database 1 --
Fig. 5 is a diagram of the communication paths. Arrows represent the direction of the data flow, and the numbers on the paths are consistent with the numbering of data in Table IV. The Common Information Model (CIM), which is defined in IEC-61970 [19], is utilized as standard data modeling format. As shown in Table IV and Fig. 5, information from substation is requested by multiple application tools. As a result, substation information packages are designed to be multicast to IP addresses, addressing the host with corresponding applications. Data retrieval from database is realized using Peer-to-Peer communications [20]. If the optimized fault location unit decides that an algorithm using historical data is implemented, a request will be sent to server database, and historian data will be sent back as an answer to the call.
Fig. 5. Communication paths between substation data processing package, application modules and visualization units
z Congestion Process
Table V shows the priorities of different data flows and processing scheme in case of congestions.
TABLEV
CONGESTION PROCESSING SCHEME
Data Flow Order of Priority Processing Method
Cascading Event
Report 1
Once the report is generated, it should be sent to visualization unit with top priority
Alarm and Fault
Location report 2 Wait until cascading report is sent out Substation package 3 Wait until no reports are in queue
Historical data
retrieval 4
Wait until no real-time data package is in queue
Data storage 5 Wait until the congestion is cleared In case of network congestions, data flows with less significance should make way to prioritized ones. For instance, cascading events will affect the stability and integrity of the entire grid, and the cascading event prevention and mitigation requires fast reaction. So once cascading events are detected, the report should be sent to operators with top priority. Substation information package contains information for real-time analysis, so its priority should be next to the reports but higher than other flows. Raw data sent to database should be halted until other communication is complete.
B. Work Flow Management
In future, not only control room operators, but also each utility group, including protection engineers, dispatchers, maintenance technicians, etc., will be equipped with a computer with GUI client installed. The clients together with the server are interconnected through a local area network. Operator is at the top level and responsible for monitoring real-time system conditions. Other utility groups also receive information from client computers. The information they receive is not necessarily the same as the one received by the operator, but it is the most relevant information that pertains to their particular responsibilities.
Once an event occurs, the visualization tools will send a notification to operator immediately. Operator could then assign tasks to different groups according to the fault reports and recommended solutions. The maintenance crew will be requested to repair system components identified with accurate fault location while protection engineers will be asked to analyze the fault clearance sequence and dispatchers will be required to re-dispatch the power generation and power flow to balance the whole system.
The control center equipped with the new visualization tools will now have two distinct features comparing with those using traditional EMS system:
z The substation data and extracted information are shared with different utility groups, making sure the data/information are presented in the form most suitable for a given group;
z Each group receives the best information since the origin of substation data becomes transparent to the users and what they receive is the best information obtained using all available data.
V. CONCLUSIONS
This paper investigates the integration of various data with traditional SCADA system data, and its utilization in applications as well as the control center visualization tools to enhance EMS functions. Accomplishments reported in this paper include:
y Detailed data requirements for intelligent alarm processor, optimized fault location and cascading event analysis have been specified respectively;
y The integration framework for PMU and other IED data with traditional SCADA system data has been proposed for the use in new applications ;
y The development of new control center visualization tools is described. Six user graphics modules performing different functions have been designed;
y Case demonstration of the visualization tools is illustrated;
y Communication paths and congestion processing scheme are designed to optimize data flows;
y New work flow management is suggested which makes better use of information extracted from the source data.
ACKNOWLEDGMENT
The authors gratefully acknowledge the contribution of Yufan Guan, Papiya Dutta, and Chengzong Pang for their work on the intelligent alarm processor, optimized fault location, and cascading event analysis respectively.
REFERENCES
[1] M. Kezunovic, A. Abur, "Merging the temporal and spatial aspects of data and information for improved power system monitoring applications," IEEE Proceedings, Vol. 9, Issue 11, pp. 1909-1919, 2005 [2] P.M. Mahadev, R.D. Christie, “Envisioning Power System Data:
Concepts and a Prototype System State Representation,” IEEE Trans. Power Systems, Vol. 8, No. 3, pp. 1084-1090, August 1993
[3] T.J. Overby, "Effective power system control center visualization". PSerc Project S-25 Final Report (08-12), [Online]. Available: http://www.pserc.org
[4] T.J. Overby, E.M. Rantanen, S. Judd, "Electric Power Control Center Visualization using Geographic Data Views," 2007 iREP Symposium - Bulk Power System Dynamics and Control, Charleston, SC, Aug. 2007 [5] Yoshihiro Kobayashi, George Karady, et al, "Satellite Imagery for the
Identification of Interference with Overhead Power Lines," Project Final Report, PSERC, Jan. 2008. [Online]. Available: http://www.pserc.org [6] S. Kocaman, L. Zhang, A. Gruen, D. Poli, "3D City Modeling from
High-resolution Satellite Images," ISPRS Ankara Workshop 2006, Ankara, Turkey, Feb. 2006
[7] W. Prince, B. Wollenberg and D. Bertagnolli, "Survey on excessive alarms," IEEE Trans. Power Systems, Vol. 4, No. 3, pp. 188-194, August 1989
[8] X. Luo, M. Kezunovic, "Implementing Fuzzy Reasoning Petri-nets for Fault Section Estimation," IEEE Trans. Power Delivery, Vol. 23, No. 2, pp. 676-685, April 2008
[9] M. Kezunovic, “Optimized Fault Location”. PSerc Project T-32 Final Report (08-07), [Online]. Available: http://www.pserc.org
[10] C.S. Chen, C.W. Liu, J.A. Jiang, "A New Adaptive PMU-Based Protection Scheme for Transposed/Untransposed Parallel Transmission Lines," IEEE Trans. Power Delivery, Vol. 17, Issue 2, pp. 395-404, April 2002
[11] M. Kezunovic, B. Perunicic, "Automated transmission line fault analysis using synchronized sampling at two ends," IEEE Trans. Power Systems, Vol. 11, No. 1, February 1996
[12] H. Song, and M. Kezunovic, "A New Analysis Method for Early Detection and Prevention of Cascading Events," Electric Power Systems Research, Vol. 77, Issue 8, Pages 1132-1142, June 2007
[13] PTI, PSS/E Application Guide, Vol. I [M], PSS/E Brochure, 2002 [14] PowerWorld Retriver, User’s Guide, PowerWorld Corporation, 2006 [15] IEEE Standard for Common Format for Transient Data Exchange
(COMTRADE) for Power Systems, IEEE Std. C37.111-1999 (Revision of IEEE Std. C37.111-1991)
[16] IEC 61850 – Communication networks and Systems in Substations, IEC Standard, 14 parts, 2002 -2004
[17] IEEE Standard for Synchrophasors for Power Systems, IEEE Std. C37.118-2005 (Revision of IEEE Std. 1344-1995)
[18] IEEE Recommended Practice for Naming Time Sequence Data Files, IEEE Std. C37.232-2007
[19] IEC 61970: Energy Management System Application Program Interface (EMS-API) – Part 301: Common Information Model (CIM) Base, Revision [6]
[20] J. I. Khan and A. Wierzbicki, "Foundation of Peer-to-Peer Computing," Special Issue, Journal of Computer Communication, Vol. 31, Issue 2, February 2008
BIOGRAPHY
Ce Zheng (S’07) received his B.S. and M.S. degrees from North China
Electric Power University, Beijing, China, in 2005, 2007 respectively, all in electric engineering. He has been with Texas A&M University pursuing his Ph.D. degree since August 2007. His research interests include applications in power system protection, digital simulation, power system voltage stability and control.
Yimai Dong (S’07) received her B.S. and M.S. degrees from North China
Electric Power University, Beijing, China, in 2005, 2007 respectively, all in electric engineering. She has been with Texas A&M University pursuing her Ph.D. degree since August 2007. Her research interests include distribution system operation, digital simulation, and smart grid applications.
Ozgur Gonen received his B.A. in Visual Communication Design from
Istanbul Bilgi University with a minor in Computer Science in 2004. He got his MS degree in Visualization Sciences from Texas A&M University in 2007. His research interests include scientific visualization, solid modeling, and user centric interface design.
Mladen Kezunovic (S’77-M’80–SM’85–F’99) received the Dipl. Ing., M.S.
and Ph.D. degrees in electrical engineering in 1974, 1977 and 1980, respectively. Currently, he is the Eugene E. Webb Professor and Site Director of Power Engineering Research Center (PSerc), an NSF I/UCRC.at Texas A&M University He worked for Westinghouse Electric Corp., Pittsburgh, PA, 1979-1980 and the Energoinvest Company, in Europe 1980-1986, and spent a sabbatical at EdF in Clamart 1999-2000. He was also a Visiting Professor at Washington State University, Pullman, 1986-1987 and The University of Hong Kong, fall of 2007. His main research interests are digital simulators and simulation methods for relay testing as well as application of intelligent methods to power system monitoring, control, and protection. Dr. Kezunovic is a Fellow of the IEEE, member of CIGRE and Registered Professional Engineer in Texas.