Transmittal Letter for the
Program Assessments Study: Statewide
Institutional IOU Energy Efficiency
Partnership Programs
STATE OF CALIFORNIA Edmund G. Brown Jr., Governor
PUBLIC UTILITIES COMMISSION
505 VAN NESS AVENUE SAN FRANCISCO, CA 94102-3298
February 8, 2013
Transmittal Letter for Program Assessments Study: Statewide Institutional IOU Energy Efficiency
Partnership Programs
From Jean Lamming, Demand Side Evaluation, CPUC Energy Division
Energy Division and the California Investor Owned Utilities (IOUs) jointly commissioned this study in late
2011 as part of a best practices assessment of IOU non-residential programs in the core, third-party and
government sectors. Seven separate reports were completed as part of the overall assessment effort;
some funded through contracts held with the IOUs and some funded by CPUC contracts. Due to the joint
commissioning and shared management structure underlying these reports, there remain some issues
not resolved to the full satisfaction of both commissioning parties.
In particular, Energy Division would like to take this opportunity to point out that this is an independent
report that does not necessarily reflect Energy Division outlook or opinion. In addition:
This study relies on available data, self-reported statements, and the expertise and opinion of the
contractor to analyze and synthesize information from these sources.
This study, from Energy Division’s perspective, would have been more informed and actionable
had the contractor provided concrete examples to support and illustrate the exact nature of
problems raised in interviews by conducting additional validation research that the contractor
recognizes was not done.
As it is, Energy Division hopes the “voices from the field’’ nature of this report can at least be a starting
point for further research and conversation to drill down into issues raised, better understand the
complexities faced by contractors, IOUs, and the partner agencies, and identify ways to reconcile them
with regulatory and ratepayer needs.
Program Assessments Study:
Statewide Institutional IOU Energy
Efficiency Partnership Programs—
WO012
Draft Report
Prepared for:
The California Public Utilities Commission, California
Investor-Owned Utilities, and Itron
Navigant Consulting, Inc. 1990 North California Blvd. Suite 700 Walnut Creek, CA 94596 925.930.2700 www.navigant.com October 9, 2012
Table of Contents
Overall Perceptions about the Statewide Partnership Programs ... iv
Coordinated Planning and Management, and Targeted Funding Improves Performance... v
Effective Programs Display Three Management Attributes. ... vii
Observations about the Cyclical Nature of Program Funding ... ix
Considerations for the State of California Partnership ... xi
1.
Program Assessments Background ... 1-1
1.1 Evaluation Project ... 1-1 1.2 Program Description... 1-1 1.3 Research Topics ... 1-1 1.3.1 Overall Perceptions ... 1-2
1.3.2 Long-Term Energy Planning ... 1-2
1.3.3 Management Structure Comparison ... 1-4
1.3.4 Staff Resources and Organizational Capacity ... 1-4
1.3.5 Financing Among Partnerships ... 1-5
2.
Interview Approach ... 2-1
2.1 IOU Interviews ... 2-1
2.2 Newcomb Anderson McCormick Interviews ... 2-2
2.3 Partner Interviews ... 2-3 2.4 Related Stakeholder Interviews ... 2-3
3.
California Department of Corrections and Rehabilitation (CDCR) ... 3-1
3.1 Partnership Characterization ... 3-1 3.2 Overall Perceptions ... 3-1 3.3 Long-Term Energy Planning ... 3-2
3.4 Management Structure Comparison ... 3-2
3.5 Staff Resources and Organizational Capacity ... 3-2
3.6 Financing Among IOUs/Partnerships ... 3-3
4.
University of California/California State University ... 4-1
4.1 Partnership Characterization ... 4-1
4.1.1 University of California System ... 4-1
4.1.2 California State University System ... 4-2
4.2 Overall Perceptions ... 4-2 4.3 Long-Term Energy Planning ... 4-2
4.4 Management Structure Comparison ... 4-4
4.5 Staff Resources and Organizational Capacity ... 4-5
4.6 Financing Among IOUs/Partnerships ... 4-5
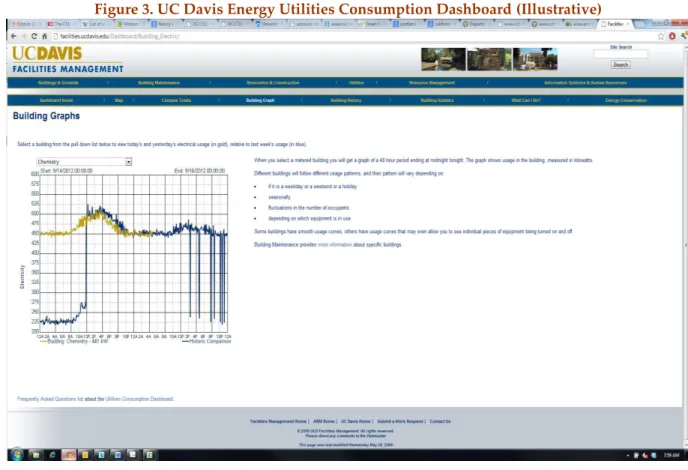
4.7 Case Study – UC Davis ... 4-5
5.1 Partnership Characterization ... 5-1 5.2 Overall Perceptions ... 5-2 5.3 Long-Term Energy Planning ... 5-2
5.4 Management Structure Comparison ... 5-3
5.5 Staff Resources and Organizational Capacity ... 5-3
5.6 Financing Among IOUs/Partnerships ... 5-4
6.
State of California ... 6-1
6.1 Partnership Characterization ... 6-1 6.2 Overall Perceptions ... 6-4 6.3 Long-Term Energy Planning ... 6-4
6.4 Management Structure Comparison ... 6-5
6.5 Staff Resources and Organizational Capacity ... 6-6
6.6 Financing Among IOUs/Partnerships ... 6-6
7.
Observations, Conclusions, and Recommendations ... 7-1
7.1 Observations ... 7-1
7.1.1 Observations about the Cyclical Nature of Program Funding ... 7-1
7.2 Overarching Conclusions ... 7-5
7.2.1 Coordinated Planning, Management, and Funding Improves Performance ... 7-5
7.3 Specific Research Topic Conclusions ... 7-8
7.3.1 Overall Perceptions of Program Performance and Barriers ... 7-8
7.3.2 Long-Term Energy Planning ... 7-9
7.3.3 Management Structure Comparison ... 7-10
7.3.4 Staff Resources and Organizational Capacity ... 7-12
7.3.5 Financing Among IOUs/Partnerships ... 7-13
7.4 Recommendations ... 7-14 7.4.1 Ideas for Consideration ... 7-14
7.4.2 Overarching Recommendations ... 7-14
List of Figures and Tables
Figures
Figure 1. Program Reported and Projected UC and CSU System Energy Savings for 2006 Through 2012vi Figure 2. Incremental Annual Market Potential Impacts 2010–2024 by Measure Type Category ... 1-3 Figure 3. UC Davis Energy Utilities Consumption Dashboard (Illustrative) ... 4-6 Figure 4. Comparison of UC and CSU System Energy Savings for 2006 Through 2012 ... 7-7 Figure 5. UC Program Campus Goal Tracking System ... 7-15 Figure 6. State Facility Data from HMG Benchmarking Effort ... 7-18 Figure 7. Example of Government Partnership Program Process ... 7-23 Figure 8. Example of a Portfolio Assessment and Implementation Process ... 7-24 Tables
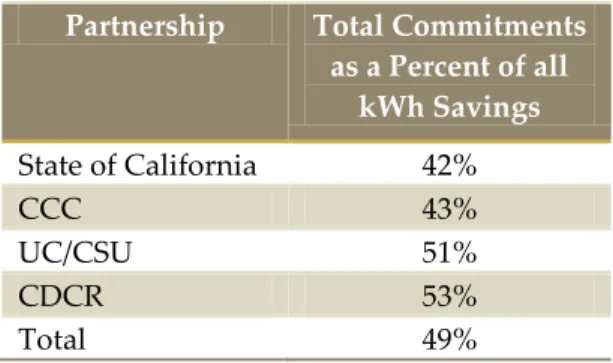
Table 1. Statewide Institutional Partnership Performance Metrics as of July 2012 ... iv Table 2. UC/CSU Partnership Savings Metrics for 2006 Through 2012 ... vii Table 3. CDCR Partnership: IOU Interview Grouping... 2-1 Table 4. UC/CSU Partnership: IOU Interview Grouping ... 2-1 Table 5. CCC Partnership: IOU Interview Grouping ... 2-2 Table 6. State of California Partnership: IOU Interview Grouping ... 2-2 Table 7. Partnership: NAM Interview Grouping ... 2-3 Table 8. Partnership: Partner Interview Grouping ... 2-3 Table 9. Related Stakeholders Interviewed by Navigant ... 2-4 Table 10. OBF Participation by Number of Loans and Dollars Loaned ... 3-3 Table 11: IOU/State of CA Partnership Timeline ... 6-2 Table 12. DGS Benchmarking of State Departments ... 6-3 Table 13. Total Commitments as a Percent of all Savings in July 2012 ... 7-4 Table 14. UC/CSU Partnership Savings Metrics for 2006 Through 2012 ... 7-7 Table 15. Statewide Institutional Partnership Energy Savings Performance as of July 2012 ... 7-8 Table 16. Statewide Institutional Partnership Budget Performance as of July 2012 ... 7-9 Table 17. Statewide Institutional Partnership Cost per kWh Saved and Committed as of July 2012 ... 7-9 Table 18. Partnership Funding Summary ... 7-13 Table 19. Agency Concurrent Participation in ARRA Loan Fund and Statewide IOU Program ... 7-13 Table 20. Budget Allocation Comparison (2010-2012) ... 7-22 Table 21. Preliminary Budget Allocation for 2013-2014 Institutional Partnerships ... 7-22
Executive Summary
This report provides the results of Navigant Consulting’s (Navigant) program assessment of the investor-owned utilities’ (IOUs’) four Statewide Institutional IOU Energy Efficiency Partnership programs in operation between 2010 and 2012, including;
California Department of Corrections and Rehabilitation (CDCR)/Investor-Owned Utility
Institutional Energy Efficiency Partnership (CDCR partnership)
University of California (UC)/California State University (CSU)/Investor-Owned Utility Institutional
Energy Efficiency Partnership (UC/CSU partnership)
California Community Colleges (CCCs)/Investor-Owned Utility Institutional Energy Efficiency
Partnership (CCC partnership)
State of California/Investor-Owned Utility Institutional Energy Efficiency Partnership (State of CA
partnership)
The following discussions present the team’s overall perceptions of the programs, and specific findings and recommendations that are discussed in greater detail throughout the document.
Overall Perceptions about the Statewide Partnership Programs
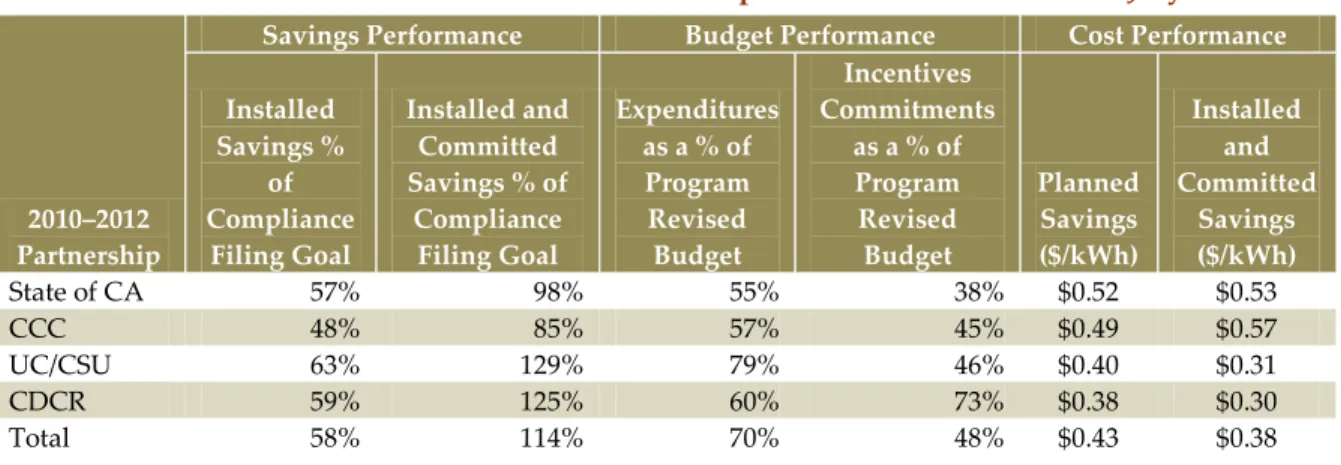
With approximately five months remaining in the three year 2010 - 2012 program cycle a significant amount of work in progress remains, and some projects will likely not be completed by the end of the program cycle in December 2012. As shown in Table 1 installed savings are at 58% of compliance filing, however when installed and committed savings are taken into account, each program is on track to deliver savings that are 114% of the adopted program goals. The figures in Table 1 indicate a large component of savings are committed, not yet installed. The cost per installed and committed kilowatt-hour (kWh) saved is estimated to be around $0.38, lower than the $0.43 originally planned.
Table 1. Statewide Institutional Partnership Performance Metrics as of July 2012
2010–2012 Partnership
Savings Performance Budget Performance Cost Performance Installed Savings % of Compliance Filing Goal Installed and Committed Savings % of Compliance Filing Goal Expenditures as a % of Program Revised Budget Incentives Commitments as a % of Program Revised Budget Planned Savings ($/kWh) Installed and Committed Savings ($/kWh) State of CA 57% 98% 55% 38% $0.52 $0.53 CCC 48% 85% 57% 45% $0.49 $0.57 UC/CSU 63% 129% 79% 46% $0.40 $0.31 CDCR 59% 125% 60% 73% $0.38 $0.30 Total 58% 114% 70% 48% $0.43 $0.38
The University of California (UC)/ California State University (CSU), California Community Colleges (CCC), and California Department of Corrections and Rehabilitation (CDCR) partnerships are continuing to develop longer term sustainability plans and strategies, and are refining a
continuous improvement approach to energy efficiency (EE) while coordinating with the investor-owned utilities (IOU) to define the role of the partnership within those long term plans.
The State of California (SOC) Partnership will meet its 10-12 cycle goals; however, as the program is
currently structured and operated it is uncertain that it can effectively support the goals of California’s Strategic Energy Plan or other applicable energy efficiency initiatives, such as the Governor’s Green Building Executive Order. The program design may not be appropriate for the management challenges inherent in delivering deep and sustainable energy efficiency savings across more than 30 state government agencies. Further, the evaluation team found no clear connection between the goals of this partnership and the energy savings directives set forth in the Governor’s Green Building Executive Order.
Coordinated Planning and Management, and Targeted Funding Improves Performance
Our research identified four characteristics of high-performing institutional partnerships, including:
1. A clear and accurate understanding of the potential for energy efficiency that is based on
engineering analysis, covers the full scope of the institutions operations, and provides an assessment at the operating-unit level, such as campus or agency;
2. The ability to develop and use guidance documents, such as strategic energy plans, to organize and
direct sustained efforts at achieving energy efficiency over a timeframe that typically exceeds a single portfolio funding cycle;
3. An effective management structure that involves broad organizational participation, tracks
performance to plan, and makes effective use of both internal resources and support offered by the IOU partners, and
4. The ability to develop and employ funding that is targeted at energy efficiency improvements over a
sustained period of time, while leveraging IOU partner incentives.
The approach taken by the UC system during the 2010–2012 UC/CSU IOU partnership serves as an example of how applying these four characteristics can enhance the performance of energy efficiency programs supporting institutions that operate large portfolios of buildings. Steps taken by the UC system over the past 10 years to achieve a high performing status include:
1. Beginning in 2002, the UC system and student body collectively developed and adopted a Green
Building Policy and Clean Energy Standard.
2. Beginning in 2006, the UC system used the Green Building Policy and Clean Energy Standard to
develop a Strategic Energy Plan that included an assessment of energy efficiency potential at each UC campus and provided a roadmap for achieving savings. This plan was presented to the IOUs in the second quarter of 2008 and helped define the collaboration with the IOUs during subsequent program cycles.
3. In 2008, the UC system secured $178 million in 15-year revenue bond funding authorized by the University of California Office of the President to begin system-wide implementation of energy
efficiency projects1 identified in the Energy Plan.
Although both the CSU and UC systems have been effective at implementing energy efficiency projects since the IOU partnership began in 2006, Figure 1 shows that savings achieved by the UC system have outpaced CSU beginning in 2009. Although there are differences in energy efficiency potential between the two systems, the evaluation team concludes that the sustained and strategic approach employed by the UC system is responsible for a large part of the disproportionate level of production at UC.
Supporting this conclusion is the observation that during 2010–2012. While the UC system has more square footage and a higher energy density, both the number of projects and the savings per square foot of space at the UC systems were disproportionately higher at UC when compared to CSU, as shown in
Table 2.
Figure 1. Program Reported and Projected UC and CSU System Energy Savings for 2006 Through 2012 1 http://www.universityofcalifornia.edu/news/article/20762 50,000,000 100,000,000 150,000,000 200,000,000 250,000,000 12 -06 02 -07 04 -07 06 -07 08 -07 10 -07 12 -07 02 -08 04 -08 06 -08 08 -08 10 -08 12 -08 02 -09 04 -09 06 -09 08 -09 10 -09 12 -09 02 -10 04 -10 06 -10 08 -10 10 -10 12 -10 02 -11 04 -11 06 -11 08 -11 10 -11 12 -11 02 -12 04 -12 06 -12 08 -12 10 -12 12 -12 Energ y Sa ved ( kWh) Date UC CSU
UC Strategic Energy Plan formally presented to IOUs
Bond funding for EE projects authorized by UC regents
Table 2. UC/CSU Partnership Savings Metrics for 2006 Through 2012 System System Sq. Ft. kBtu / Sq. Ft. 2006-2008 Portfolio 2010-2012 Portfolio2 Total 2006–2012 Projects Verified kWh Saved / Sq. Ft. Projects Verified or Committed kWh Saved / Sq. Ft. Total Projects Verified or Committed Total kWh Saved kWh Saved / Sq. Ft. UC 126,000,000 1563 92 0.38 553 1.32 645 214,484,139 1.70 CSU 87,000,0004 855 61 0.33 220 0.49 281 74,602,536 0.86 Total 213,000,000 NA 153 0.36 773 0.36 926 289,086,675 1.36
Effective Programs Display Three Management Attributes.
The evaluation team discussed management structures with IOU and institutional partner staff and concluded that the most effective management structures meet the needs of both parties and can be defined from both the IOU and institutional partners’ perspectives, as follows;
1. From the institutional perspective, an effective partnership has the ability to establish energy
management goals for all participating campuses or agencies and effectively leverage the IOU program design to achieve forecasted goals.
2. From the IOU perspective, an effective partnership allows the IOUs the ability to contribute their
core program design and technical skills to help partners achieve their energy management goals. Partnerships that appeared to the evaluator to be most effective from both perspectives typically displayed three attributes;
1. The ability to develop a strategic plan approach to institution-wide energy efficiency potential.
Attributes of successful strategic energy efficiency planning and implementation efforts that include:
a) Institutional-level energy efficiency plans that are developed by combining individual
agency or campus plans vs. top-down aspirational goals;
b) Activities that cover all campuses and agencies in a consistent format, not a subset of
agencies or a variety of inconsistent planning formats;
2 Including 2009 bridge achievements.
3 Email to author from Dirk VanUlden, Tuesday, August 21, 2012 8:46 AM 4 Email to author from Len Pettis, Monday, August 20, 2012 3:10 PM
c) Planning activities that are integrated with other institutional planning efforts, such as a system-wide capital plan or long-term campus master plan;
d) Planning efforts are developed in collaboration with deferred maintenance initiatives and
include estimates of additional savings such as reduced maintenance labor where present;
e) Implementation activities that include specific management metrics that can be tracked at
the constituent campus/agency level and system-wide level over time, such as kWh/sq. ft. of space;
f) Planning efforts that provide IOU partnership energy efficiency goals that are based on
estimates of technical and economic EE savings potential that can be used to establish appropriate program funding levels;
g) Planning efforts that provide the partnership with the support and justification for energy
efficiency dedicated funding initiatives, such as bond issues that specifically addresses projects identified through system wide investment grade audits;
h) A management platform that survives staff/administration turnover, and
i) A process that embeds energy efficiency planning in other institutional initiatives, such as
cross-planning with deferred maintenance initiatives.
2. An effective management structure capable of sustained focus on strategic energy goals.
Attributes of successful management structures that includes:
a) An Executive Committee that focuses on institution-wide strategic planning initiatives and
oversees and actively adjusts the program planning efforts;
b) A Management Committee focused on installing projects and tracking performance to goal.
This management committee typically will have a relationship with operations and a communication structure whereby functional knowledge at the campus or agency level can be aggregated and disseminated across the all participating constituents to help develop informed reporting, forward planning, and budgeting;
c) The commitment to meet regularly to review program tracking metrics and resolve
production issues quickly;
d) The ability to engage broad cooperation for constituents when authority is limited
e) The ability to engage institutional stakeholders, such as students or agency employees, in a
collaborative process to identify and achieve broad sustainability and efficiency initiatives
3. An effective project management and delivery capability that shows continuous improvement.
Attributes of effective delivery capability that includes:
a) The ability to continuously improve and deliver increasingly complex projects over time so
that the institution is not reliant on more evident projects, such as lighting retrofits, that will saturate and unnecessarily limit savings production;
b) The capability to effectively work within IOU and California Public Utilities Commission restrictions to ensure that program constraints, such as filing and funding deadlines, do not limit production;
c) The flexibility to access multiple funding sources such that the most appropriate financing
option is available and selected for each project;
d) Access to a variety of qualified contractors or energy service companies where a competitive
environment is maintained through multiple and redundant service providers that are identified and prequalified in advance;
e) The ability to provide continual feedback to management on performance tracking metrics
on project production, and sources of new potential identified during the implementation process.
Observations about the Cyclical Nature of Program Funding
Consistent with most other resource programs operating during recent portfolio cycles, the institutional partnerships operate within a framework that limits the flexibility of approved projects to span multiple energy efficiency program funding cycles. This framework allows for up to a 20% funding commitment carryover cycle-to-cycle. It is designed to provide protection to all stakeholders from risks of long term fund commitments. Real and inherent risks associated with the long term funding commitments include insufficient funding, reduced cost effectiveness, and an imbalance of decision making power over time. Moreover, there is a loss of agility in policy, and the options available through policy to adapt to changing economic, political, technological and legislative environments. Policy must ensure the
portfolio retains a level of agility consistent with parties’ agreed-upon planning horizon; this protects the rights of all stakeholders. At the same time, there are real associated costs associated with this agility – which present in the form of lost EE opportunities. Institutions in particular often rely on their own carefully designed protocol and framework to govern investment decision making processes; a framework designed first and foremost to protect their own constituents and secondarily, if at all, to conform to EE policy planning horizons. Institutions may also be more likely to have large scale projects that take longer to roll out. Limits to the carry-over allowance translates to risk that some multi-cycle projects will have to forfeit incentives.
During the interviews conducted for this study, partners consistently mentioned that planning and implementing projects consistent with EE program cycles is challenging. Project installation schedules and program operating cycles often do not align and many projects remain in process at the end of a funding cycle, resulting in uncertainty about unpaid incentives. This observation is not unique to institutional partnerships. The misalignment between program funding cycles and project timelines might become more problematic for institutions over time for several reasons, including:
1. In general, partners are getting better at pursuing more complex projects with design, build, and
verification requirements that are more rigorous than the types of “low-hanging fruit” projects, such as lighting, packaged HVAC, and building shell measures. As complexity and rigor increase, there is a commensurate risk that these projects will not be completed within a single portfolio cycle.
2. The duration of portfolio cycles is a function of many factors and will vary over time. Consider that the most recent four portfolio cycles have had three different durations, including one-, two-, and
three-year terms.6 Compounding this concern is that the calendar by which funding is actually
available for each cycle also varies.
3. As conservation and efficiency become increasingly important to state agencies and institutions,
issues associated with trying to align and integrate institutional planning cycles with uncertain demand-side management (DSM) funding cycles could become a barrier to long-term sustainability efforts. Examples of planning activities that would benefit from alignment with EE incentive funding include system-wide and campus-level master plans and unique initiatives, such as the Governor’s Green Building initiative requiring specific EE actions by 2018.
4. It appears that the number of EE financing opportunities available to partners will continue to grow
and many financing vehicles are contingent upon EE incentives. Uncertainty about incentives can have adverse effects on financing availability and terms.
The Navigant team did not undertake research to establish whether or not projects had been cancelled , delayed, or suffered financially from this issue. However, the topic was mentioned during multiple partner interviews and Navigant concluded that the problems inherent in aligning institutional planning cycles with DSM portfolio cycles might be more nuanced than simply whether or not projects are
cancelled because of timing issues. With that perspective in mind Navigant provides the following observations and questions that may help inform future research;
1. The operating objectives and planning horizon for Government agencies is fundamentally different
from commercial operations, yet they are subject to many of the same program planning rules and timeframes. For example;
a. Government agencies have longer lifespans than most commercial enterprises. Most of the
California institutions represented by the partnership where created between 1920 and 1970, with an average age of well over 40 years. Some agencies that constitute a large percentage of state agency energy use have been in continuous operation for over 140 years, such as the California State University and University of California, founded in 1857 and 1868 respectively. By contrast 40 percent of all newly created companies last less than 10 years . Indications are that the average life expectancy of all firms, regardless of size, is about 12.5 years.
b. Government agencies have different priorities than do commercial enterprises. Agencies have a
political mandate to provide a service, versus a commercial enterprise that operates, by and large, on economic opportunities. As such, capital projects, including energy efficiency implementation, are prioritized and budgeted differently.
Given these differences, is the DSM planning horizon used for the commercial sector the optimal planning environment for the government sector?
6 The 2006–2008 portfolio (a three-year duration) was followed by a one-year 2009 cycle duration (and was not
established until late 2008 as simply a continuation of the previous cycle). The 2010–2012 portfolio (initially the 20102001–2011 portfolio) had a three-year duration, whereas the 2013–2014 portfolio currently being planned has a two-year duration.
2. The issue may not be that projects are cancelled or delayed because of the short term nature of the DSM portfolio cycle, but rather the question might be is this the environment where the planning and implementation of deep and comprehensive energy savings is optimal for government agencies?
3. How can institutions and EE policy work best together to promote energy efficiency while
mitigating risk and preserving the rights of each bodies’ stakeholders?
4. Can a DSM program cycle that is unique for government agencies with a high certainty of ongoing
operation be designed that provides a more stable planning platform while affording regulators the agility to effectively adapt the portfolio to the evolving needs of stakeholders and limits of program funding.
5. The California energy efficiency policy manual7 defines the conditions that allow funds to be
committed for projects with lead times beyond three years, and also the process whereby advice letters can be used to secure funds for activities that extend beyond a portfolio end date. The research for this report did not identify how well institutional partners understand the policy
manual or their ability to work with the IOUs to use the policy manual to resolve end of cycle issues. It is recommended that this research be undertaken in future process evaluations of institutional partnerships.
Considerations for the State of California Partnership
The State of California (SOC) program has a mission and constituency that is different from the other institutional partners reviewed in this assessment. For example;
The SOC program supports more than 30 separate agencies, adding considerable administrative and
coordination overhead to the program. The UC/CSU, CDCR, and CCC institutions are single agency programs with facility portfolios where energy efficiency can be clearly defined and where
management structures provide clear lines of authority.
The SOC partnership has no line of authority to drive energy efficiency within the agencies it serves,
and there is no defined portfolio of facilities or clear understanding of the potential for energy efficiency across the constituent agencies. The UC/CSU, CDCR, and CCC systems have developed or are developing long term policies and plans supporting sustainability and energy efficiency implementation strategies.
The evaluation team concluded that program planning and implementation efforts at the SOC appear to be nascent. Specific recommendations that might help refine the structure and operations of the SOC partnership include:
Clearly define the scope and goals of the State partnership
Define the potential for energy efficiency at the agency level
7 Energy Efficiency Policy Manual, version 4.0. (August 2008), Applicable to post-2005 Energy Efficiency Programs.
Implement an effective program management structure that reflects the previous discussion on effective program management attributes
Consider options for leased buildings
Assess potential collaboration with the CCC DEEP program that would allow lower cost student
resources to perform audit and data recording tasks necessary to catalog the potential for energy efficiency in state buildings.
Reassess IOU program funding levels and allocation of budget within the program to fund the
development of the an energy information system that would inform potential estimates and project prioritization.
Consider including the following principles in a future program designs;
Provide an incentive structure that promotes progress by offering an incentives structure that
rewards performance. An example of this could be an incentive structure where incentive levels increase as tiered goals are achieved.
Provide the IOU and agency partners with a program structure and operating process that helps
establish energy efficiency goals and implementation plans, including a feedback loop such that barriers can be addressed and goals can be adjusted over time such that the goals of EO B-18-12 can be achieved at the agency level.
Provide a facility portfolio assessment and implementation process that defines a methodology
to audit facilities for multiple EE/RE opportunities, aggregate these opportunities and schedule, implement, and track portfolio activity at the agency level.
1.
Program Assessments Background
1.1
Evaluation Project
The Navigant Consulting, Inc. (Navigant) evaluation team researched the investor-owned utilities’ (IOUs’) four partnerships in the Statewide Institutional IOU Energy Efficiency (EE) Partnership
(Statewide Institutional Partnership [SIP]) program. This research is part of the Nonresidential Program Assessments project, a joint effort of the California Public Utilities Commission (CPUC) and the IOUs to assess the performance of a large portion of the state’s nonresidential portfolio of programs. The reviews analyze lessons learned and barriers for each of the institutions currently being implemented.
1.2
Program Description
The following are the Statewide Institutional Partnerships between the IOUs and state institutions:
1. California Department of Corrections and Rehabilitation (CDCR)/Investor-Owned Utility
Institutional Energy Efficiency Partnership (CDCR partnership)
2. University of California (UC)/California State University (CSU)/Investor-Owned Utility Institutional
Energy Efficiency Partnership (UC/CSU partnership)
3. California Community Colleges (CCCs)/Investor-Owned Utility Institutional Energy Efficiency
Partnership (CCC partnership)
4. State of California/Investor-Owned Utility Institutional Energy Efficiency Partnership (State of CA
partnership)
All partnerships have three similar core program elements:
1. Government/Institutional Facilities, which include incentives for retrofits of lighting, heating,
ventilation, and air conditioning (HVAC) equipment, and motors, as well as Monitoring Based Commissioning (MBCx) and/or retro-commissioning (RCx) of existing buildings; assistance and incentives for new building design and construction; and On-Bill Financing and other financing options for energy-efficient projects
2. Strategic Plan Support, which includes helping institutions comply with existing code; creating and
achieving reach codes; and integrating EE goals into guiding policies of these institutions, as prescribed by the goals of the California Energy Efficiency Strategic Plan (CEESP)
3. Core Program Coordination, which includes creating one resource as a portal to all other IOU
programs; outreach and training; finding ways to integrate demand response into energy efficiency projects; and helping improve emerging technology adoption (especially through the resources in higher education institutions).
1.3
Research Topics
Navigant reported on the following five topics presented in the research plan submitted on May 25, 2012.
1. Overall Perceptions - Highlight the key barriers or obstacles to each institution’s successful program participation.
2. Long-Term Energy Planning - Investigate how prepared the Statewide Institutional Partners are to
adapt and stay current with their long-term energy planning.
3. Management Structure Comparison - Compare current management structures to ensure they are
meeting the needs of the IOUs and program managers.
4. Staff Resources and Organizational Capacity - Evaluate differences in institutional structures and
policies that enable some institutions to achieve energy savings and implement innovative policies.
5. Financing Among IOUs/Partnerships - Compare the differences in financing mechanisms available
to the partnerships to determine barriers and best practices.
These five research topics create the structure of our findings for each institutional partnership. Details regarding the topics and actions completed during the research period that are associated with the research topics are presented in the following sections.
1.3.1 Overall Perceptions
Navigant interviewed the Statewide Institutional Partners to determine what lessons from the most successful Statewide Institutional efforts can be applied so that others can try to emulate these and enable California to achieve additional energy savings. Navigant highlighted the key barriers or obstacles to each institution’s successful program participation.
1.3.2 Long-Term Energy Planning
According to Navigant’s 2011 draftanalysis of California’s IOU Energy Efficiency Potential,8 there will
be significant changes in savings potential over the next few years due to various factors. As shown in Figure 2, the effect is a significant reduction in market potential between 2010 and 2013, followed by a more gradual decrease through 2024. Fluctuations in savings will occur due to the influences of codes and standards that come into effect periodically, as well as new technologies that become viable at different times in the next decade.
8 Navigant. Analysis to Update Energy Efficiency Potential, Goals and Targets for 2013 and Beyond. Prepared for the
California Public Utilities Commission. The draft report was issued on November 4, 2011. The final report will be issued in March 2012.
Figure 2. Incremental Annual Market Potential Impacts 2010–2024 by Measure Type Category
The largest reduction in potential will be the result of changes in lamp efficiency standards. The lighting
standard9 will affect the commercial and residential sectors alike, with the manufacturers phasing out
high-wattage incandescent bulbs and linear flourescents. The commercial sector will have additional
motors standards,10 changing the types of new motors sold in the market.
California’s local government and SIPs, which focus their resource activities primarily on municipal and institutional building retrofits and retro-commissioning, can expect to be impacted by the codes and standards that have been and will be adopted. Partnerships cannot only take advantage of the standards coming into effect by enforcing them; they can also find greater opportunity for deeper building systems changes from the technologies emerging in the market.
9 California Energy Commission. 2010 Appliance Efficiency Regulations. December 2010.
http://www.energy.ca.gov/2010publications/CEC-400-2010-012/CEC-400-2010-012.PDF. Accessed March 1, 2012.The California lighting standard came into effect January 1, 2011, one year prior to the national standard.
10 California Energy Commission. 2010 Appliance Efficiency Regulations. December 2010.
http://www.energy.ca.gov/2010publications/CEC-400-2010-012/CEC-400-2010-012.PDF. Accessed March 1, 2012.
500 1,000 1,500 2,000 2,500 3,000 3,500 4,000 2010 2011 2012 2013 2014 2015 2016 2017 2018 2019 2020 2021 2022 2023 2024
C&S - IOU Attributable Savings IOU Measures (Usage-Based Behavior) IOU Measures (ET)
IOU Measures (HIM, MOI, Secondary, LI)
G
Wh
Some of the emerging technologies cited in this study that will enter the market in the next decade or so include light-emitting diode (LED) street lighting, indoor LED lighting (that replaces T8 and T5 linear fluorescents), automatic steam-trap monitors for large spaces that use boilers for space and process heating, and fault detection and diagnostics monitors for HVAC systems. Additionally, it is expected that programs that save energy by influencing consumer behavior—such as how they operate
equipment—will begin to contribute to portfolio savings starting in 2013. Behavioral-type initiatives are very dependent on outreach and education activities, which might become increasingly important components of the SIP program.
1.3.3 Management Structure Comparison
Preliminary interviews with IOU staff indicated that the management structures for each of the
partnerships generally mirrored the structures outlined in the program implementation plans, with the following two distinct types of management teams:
1. Executive Team: The executive team consists of representatives from the partners, IOUs, and the
partnerships’ administrator (i.e., Newcomb Anderson McCormick [NAM]). NAM tracks project progress and provides general administrative support for programs.. The Executive Team sets overall program policy and ensures high-level program progress.
2. Management Team: The management team is made up of members of the IOU-level representatives
(including program managers from the IOU and partner facilities that fall under that IOU’s service territory) and is responsible for performing detailed program work and making recommendations for action to the executive team. Included in the management team are partner representatives, which vary by number, based on the needs of each partnership. The team provides a more coordinated and integrated approach, with the goals of increasing the penetration of energy efficiency measures and avoiding lost opportunities for energy savings.
This management structure holds true for the majority of IOUs and partnerships. There are, however, instances of varying management structures among partnerships among the individual IOUs. For instance, Pacific Gas and Electric Company (PG&E) reported that its current SOC Partnership program has no one agency that represents the partner, as well as no contract under which this program can be administered. Currently, the Department of General Services (DGS) handles most projects. Agencies such as Caltrans, Administrative Offices of the Court, and the National Guard have some contracting authority (outside of the DGS) and may contract with an energy service company (ESCO) in order to implement energy efficiency projects.
Navigant investigated the impacts of different administrative models to identify best practices that will guide program managers in future program cycles.
1.3.4 Staff Resources and Organizational Capacity
From preliminary interviews with IOU staff members, Navigant found that there is an inconsistency in staff resources within partnerships. For example, each campus in the UC system has a dedicated energy manager, whose sole responsibility is to manage and implement energy efficiency activities. This is not necessarily the case with the CSU system, whose campuses might have facility managers who do not have the time to focus on energy-saving projects, as well as CDCR, whose prisons reportedly depend on ESCOs and utilities to provide project proposals.
Navigant evaluated the minimum organizational resources required for institutions to progress beyond projects involving “low-hanging fruit,” to more innovative projects and partnerships.
1.3.5 Financing Among Partnerships
As stated in the 2010-2012 program implementation plans,11 financing/funding was a primary barrier to
project implementation. Preliminary interviews with IOU staff have also found that funding constraints and mechanisms continue to be a barrier to efficient project implementation.
Navigant investigated the different financing mechanisms, including the American Recovery and Reinvestment Act of 2009 (ARRA) funding which will no longer be available in the upcoming program cycles. Partners had used ARRA funding to finance their energy efficiency projects during the 2010-2012 program cycle.
11 SCE-L-005_I&G PIPs_feb 2011_clean final.
2.
Interview Approach
Navigant conducted approximately five interviews per institutional partnership, for a total of
approximately 20 interviews with program staff. The following five groups of staff were interviewed for each institution:
IOU program managers
NAM
Executive- and management-level partners that work specifically in the Southern California Edison
(SCE) service territory
Executive- and management-level partners that work in the PG&E service territory
Executive- and management-level partners that work in the Southern California Gas Company
(SCG) and San Diego Gas and Electric Company (SDG&E) (Sempra Utilities) service territories
2.1
IOU Interviews
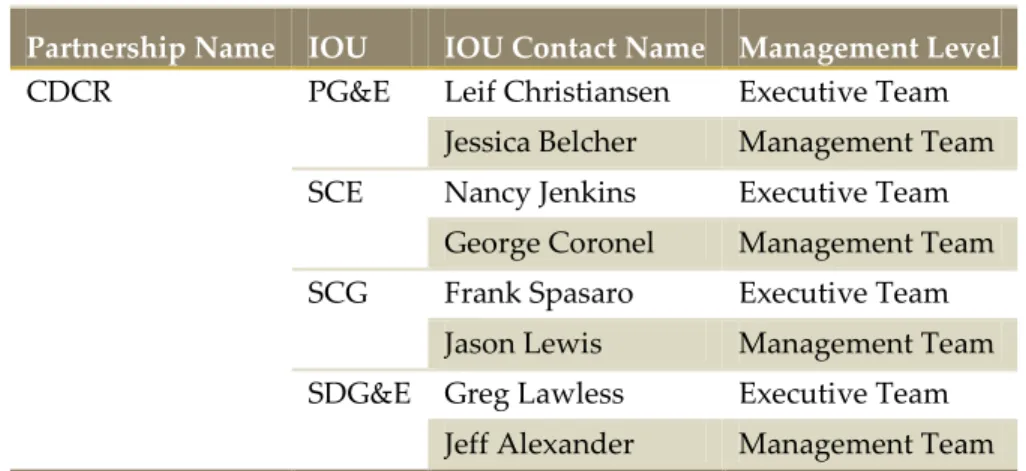
The IOU group of interviews included program managers on the executive and management levels. There is no executive-level management team for the SOC partnership. Table 3 through Table 6 describes all IOU interviews by partnership.
Table 3. CDCR Partnership: IOU Interview Grouping
Partnership Name IOU IOU Contact Name Management Level
CDCR PG&E Leif Christiansen Executive Team
Jessica Belcher Management Team
SCE Nancy Jenkins Executive Team
George Coronel Management Team
SCG Frank Spasaro Executive Team
Jason Lewis Management Team
SDG&E Greg Lawless Executive Team
Jeff Alexander Management Team
Table 4. UC/CSU Partnership: IOU Interview Grouping
UC/CSU PG&E Leif Christiansen Executive Team
Dave Hather Management Team
SCE Nancy Jenkins Executive Team
Robert Brunn Management Team
SCG Frank Spasaro Executive Team
Jason Lewis Management Team
SDG&E Greg Lawless Executive Team
Linh-Chi Hua Management Team
Table 5. CCC Partnership: IOU Interview Grouping
Partnership Name IOU IOU Contact Name Management Level
CCC PG&E Leif Christiansen Executive Team
Dave Hather Management Team
SCE Nancy Jenkins Executive Team
Michael Schwonke Management Team
SCG Frank Spasaro Executive Team
Carlo Gavina Management Team
SDG&E Greg Lawless Executive Team
Linh-Chi Hua Management Team
Table 6. State of California Partnership: IOU Interview Grouping
Partnership Name IOU IOU Contact Name Management Level
CA PG&E Leif Christiansen Executive Team
Jessica Belcher Management Team
SCE Nancy Jenkins Executive Team
George Coronel Management Team
SCG Frank Spasaro Executive Team
Jason Lewis Management Team
SDG&E Greg Lawless Executive Team
Jeff Alexander Management Team
2.2
Newcomb Anderson McCormick Interviews
Since NAM is the program administrative manager for most partnerships and is present at the executive- and management-level meetings, Navigant found it appropriate to interview NAM regarding practices of both levels of management and issues faced at the IOU and partner levels. These interviews not only provided a different perspective of the program models of implementation, but also allow Navigant to
analyze whether there are gaps in understanding program objectives. Table 7 breaks out NAM interview groups by institutional partnership. Because there is currently no program administrator for the SOC, there was one less interview conducted for that partnership.
Table 7. Partnership: NAM Interview Grouping
Partnership Name NAM Contact Name
CCC Matt Sullivan
CDCR Curtis P. Schmitt
UC/CSU Andrew D. Meiman
2.3
Partner Interviews
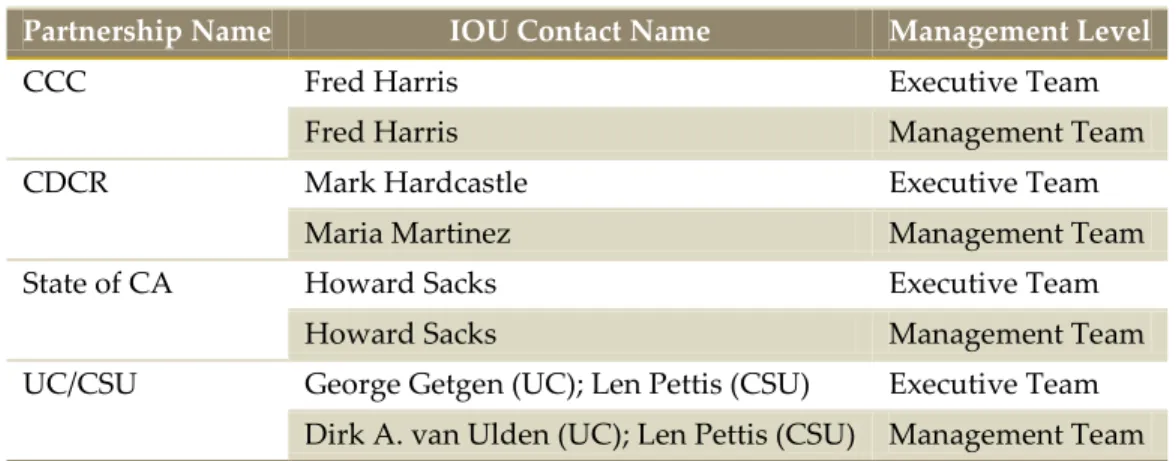
By interviewing partners for each institutional partnership, practices and issues can be examined from the perspective of the partner. A partner might be able to describe the differences and intricacies of IOU-specific activities as they are experienced by a “customer,” not an implementer. In many cases, the partner contact is the same at the executive level as at the management level for all utilities. Table 8 shows interview groups by partnership.
Table 8. Partnership: Partner Interview Grouping
Partnership Name IOU Contact Name Management Level
CCC Fred Harris Executive Team
Fred Harris Management Team
CDCR Mark Hardcastle Executive Team
Maria Martinez Management Team
State of CA Howard Sacks Executive Team
Howard Sacks Management Team
UC/CSU George Getgen (UC); Len Pettis (CSU) Executive Team
Dirk A. van Ulden (UC); Len Pettis (CSU) Management Team
2.4
Related Stakeholder Interviews
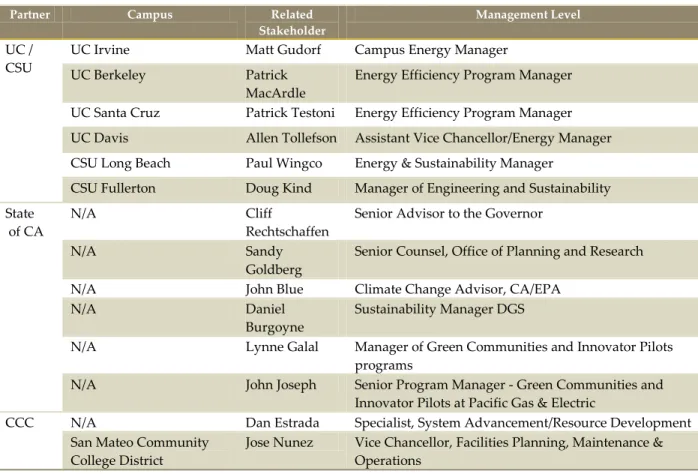
In addition to interviews with program managers at the partner and IOU levels, Navigant conducted interviews with the stakeholders listed in Table 9.
Table 9. Related Stakeholders Interviewed by Navigant
Partner Campus Related
Stakeholder
Management Level
UC / CSU
UC Irvine Matt Gudorf Campus Energy Manager
UC Berkeley Patrick
MacArdle
Energy Efficiency Program Manager UC Santa Cruz Patrick Testoni Energy Efficiency Program Manager UC Davis Allen Tollefson Assistant Vice Chancellor/Energy Manager CSU Long Beach Paul Wingco Energy & Sustainability Manager
CSU Fullerton Doug Kind Manager of Engineering and Sustainability State
of CA
N/A Cliff
Rechtschaffen
Senior Advisor to the Governor
N/A Sandy
Goldberg
Senior Counsel, Office of Planning and Research
N/A John Blue Climate Change Advisor, CA/EPA
N/A Daniel
Burgoyne
Sustainability Manager DGS
N/A Lynne Galal Manager of Green Communities and Innovator Pilots programs
N/A John Joseph Senior Program Manager - Green Communities and Innovator Pilots at Pacific Gas & Electric
CCC N/A Dan Estrada Specialist, System Advancement/Resource Development San Mateo Community
College District
Jose Nunez Vice Chancellor, Facilities Planning, Maintenance & Operations
3.
California Department of Corrections and Rehabilitation (CDCR)
3.1
Partnership Characterization
The CDCR is an agency of the executive branch of the California State Government that operates all state prisons, juvenile facilities, and other correctional facilities.
CDCR, with an estimated 48 million square feet of occupied space,12 has been partnered with the IOUs
since the 2006-2008 program cycle. With over 30 facilities, CDCR is an institutional partnership with high energy savings goals for the 2010-2012 program cycle.
Unlike other state agencies, CDCR’s Division of Facility Planning, Construction, and Management has independent contracting authority; this means that not only does CDCR have its own authority for facility projects, but also, all agency-level goals are managed and held accountable by this division at the state level. Normally, the IOUs would have to go through the DGS, many agencies’ procurement arm, to identify and implement projects regionally, thus increasing required time and effort. The IOUs have taken advantage of this authority and set individual goals for this one agency.
In 2006, the IOUs completed a comprehensive audit of the energy efficiency potential of each of the CDCR’s facilities and provided a breakdown of the results. These results were incorporated into CDCR’s five-year energy efficiency and energy management plan, which is updated annually. In addition, the CDCR’s Division of Facility Planning, Construction, and Management drives all projects at the state level. As such, CDCR’s Division staff members have a clear idea of what can be achieved based on a variety of tracked variables, including age of facility, age of equipment at each facility, and the latest upgrades made at each facility.
The CDCR has a variety of opportunities to implement projects. First, the IOU management team has developed a cost-sharing model to help fund a Project Administrator dedicated to CDCR energy efficiency activities, to manage relationships and track progress for the IOUs and CDCR for the
partnership.13 Second, CDCR has a preapproved pool of ESCOs that are permitted to bid to help
implement projects. Third, CDCR has taken advantage of the Energy $Mart financing program available through the Department of Finance (DOF) and administrated by DGS to finance their energy efficiency projects, as well as On-Bill Financing (OBF) funding provided through the IOUs. Other financing options that CDCR has taken advantage of are additional California Energy Commission (CEC) Energy
Efficiency and Conservation Authority (EECA) and ARRA funding.
3.2
Overall Perceptions
Through interviews with partner contacts and IOU program managers, Navigant believes that CDCR understands how much energy consumption can be reduced in its facilities. Also, Navigant believes that CDCR has the appropriate management structure to implement projects effectively and efficiently, and
12 SCE 2013-2014 PIP. 13 SCE 2013-2014 PIP.
that there are many channels through which CDCR can implement its projects. Specifically, CDCR utilizes IOU technical expertise, in-house facilities’ management tracking, and its five-year plan to develop and implement potential energy efficiency projects. Since CDCR’s Division of Facility Planning, Construction, and Management has its own contracting authority and manages all facilities at the state level, intended projects are implemented effectively and efficiently. CDCR has taken advantage of ARRA funding, IOU OBF, and ESCO structures to cost-effectively implement projects. According to CDCR, approximately 70% of all facilities fall within the four IOU service territories and qualify for the
CDCR/IOU partnership14.
3.3
Long-Term Energy Planning
The following three observations were made through interviews with program managers at the
partnerships and IOUs, and with the program administrators in regard to the long-term energy planning efforts undertaken at CDCR.
1. In 2006, the CDCR entered into partnership with California’s IOUs. As part of the partnership, the
IOUs provided technical and financial support (in the form of incentives) to the partnership for the implementation of energy efficiency projects. Under the technical support part of the agreement, the IOUs completed a comprehensive audit of CDCR’s facilities. The audit results provided a
breakdown of potential energy efficiency projects for each of the CDCR’s facilities, and were used to develop a five-year plan that is updated annually.
2. In addition to the five-year plan, the Division of Facility Planning, Construction, and Management
understands achievements and potential projects based on a variety of tracked variables, including age of facility, age of equipment at each facility, and the latest upgrades made at each facility.
3. As only main meters for gas and electric are available, CDCR benchmarks entire facilities. CDCR
does not currently benchmark by individual buildings or through the use of third-party software, such as U.S. Department of Energy (DOE) Portfolio Manager. Benchmarking is conducted through the review of IOU monthly billing data, allowing CDCR to compare energy consumption by facility.
3.4
Management Structure Comparison
Because CDCR’s Division of Facility Planning, Construction, and Management has its own contracting authority and manages all facilities at the state level, projects are implemented effectively.
Overall, all IOU program managers are satisfied with the projects to which CDCR commits, CDCR’s administration, and the structure of the partnership.
3.5
Staff Resources and Organizational Capacity
As noted above, CDCR manages all facilities at the state level through the Division of Facility Planning, Construction, and Management. Projects identified through the five-year plan are implemented under direction of this Division.
CDCR utilizes an effective and competitive process to facilitate the implementation of its energy efficiency projects. CDCR releases a request for qualifications (RFQ) once every three years to ESCOs that wish to participate in the partnership. It should be noted that ESCOs do not sign a partnership agreement with the CDCR and IOUs. They are contractors of the State but are not direct participants of the partnership in a sense that they are not part of the management team meetings. Once all RFQs have been submitted, the CDCR reviews the proposals and creates a list of approved ESCOs. The approved ESCOs are then permitted to participate in facility bid walks for potential energy projects. The ESCOs then submit bids for a particular project. The ESCO that is deemed (by the CDCR) to have the best value is chosen for the contract. CDCR noted that developing the pool of ESCOs every three years significantly shortens the administrative process.
However, despite having a preapproved pool of ESCOs that shortens project timelines, CDCR believes that the IOU program cycle timelines are still too short and would be ideal if they matched ESCO project timelines of five years.
3.6
Financing Among IOUs/Partnerships
In general, CDCR has taken advantage of the Energy $Mart financing program available through the DOF and administrated by the DGS to finance their energy efficiency projects, as well as OBF funding
provided through the IOUs. Previous cycles’ funding sources came from two ARRA loans15 in the
amounts of $4,108,988 and $1,512,401 issued by DGS. Other financing options that CDCR has taken advantage of are additional CEC EECA and ARRA funding. Throughout the 2012 program year, approximately eighty percent of financing for CDCR came in the form of OBF (according to interview respondents). Whether ARRA funding will be available for future energy efficiency initiatives remains unclear to CDCR program managers. OBF provides much-needed capital to CDCR to continue to implement energy efficiency projects. While acknowledging the benefits of OBF, CDCR also indicated that current OBF caps limit the size of projects that can be implemented. On average, projects cost $1.5 to $3 million, primarily due to increased security measures such as requiring additional guards for every contractor and requiring a twice-daily inventory of tools.
Current OBF policy limits the available funds to $1 million per meter per facility until funds are paid back. In addition to the loan cap, internal policy among the IOUs for OBF is that CDCR can only owe each utility $1 million per site; however, if $100,000 of the loan is repaid, then CDCR can apply for an additional $100,000 of OBF again, which is insufficient for most CDCR projects. While Navigant acknowledges that the current loan cap of $1 million is not ideal for CDCR, it does recognize that the loan funds available through the IOUs must be distributed amongst multiple energy efficiency programs
and partnerships. Table 10 summarizes total OBF participation as of fall 2011. 16, 17
Table 10. OBF Participation by Number of Loans and Dollars Loaned
IOU Number of Loans Dollars Loaned
15Master Plan Annual Report For Calendar Year 2010, Submitted January 2011, California Department of Corrections
and Rehabilitation.
16 Transmittal Letter for the 2010-2012 On-Bill Financing Process Evaluation and Market Assessment, May 1, 2012. 17http://www.energydataweb.com/cpucFiles/pdaDocs/846/OBF%20Final%20Report,%20May%202012.pdf.
SDG&E 506 $13,541,298
SoCalGas 15 $459,301
SCE 78 $2,012,717
PG&E 4 $210,140
Statewide 603 $16,223,456
If the loan cap were to be increased, it might allow for the potential for one project to consume a larger than reasonable portion of the available funds, which could limit the overall breadth and diversity of those participating in OBF. Therefore, it may be unreasonable at this time to increase the project cap on OBF loans.
4.
University of California/California State University
4.1
Partnership Characterization
The UC/CSU partnership is comprised of the University of California and the California State University systems that began during the 2004-2005 program cycle. While these two institutions of higher education are part of a joint partnership with the IOUs, they can be characterized individually to highlight
partnership differences.
4.1.1 University of California System
The UC system includes 230,000 undergraduate and graduate students and about 200,000 faculty and
staff.18 The University of California is comprised of ten campuses that are headed by chancellors at the
campus level and the University of California Office of the President (UCOP) at the state level. All UC campuses except for Los Angeles and Riverside are part of an IOU service territory and are eligible to participate in this partnership.
There are eight campuses that fall under the IOU service territories; however, UC Merced is not included in this partnership since it is a new campus. The University of California is headed at the state level by the regents of the University of California, which includes the president. Each campus is governed by a chancellor, who reports directly to the Office of the President. The IOU partnership works directly at the state level with staff members of the UCOP. The UC system works under Executive Governance from the UCOP/regents; policies set at the university level are generally standardized throughout the 12 campuses.
In 2008, the University of California created a Strategic Energy Plan (SEP)19 for each campus. According
to the UC partners, this strategic plan was an effort from the campuses as well as the Office of the President to understand the system’s energy efficiency and renewable energy potential. This plan identified “thousands of projects,” including lighting replacements, MBCx, HVAC retrofits, and motor
retrofits on all campuses, except UC Merced.20 Campuses then prioritized projects in the SEP to
implement through the IOU partnership for the next program cycle.
Projects prioritized, identified, and implemented are managed at the campus level by each campus’ Energy Manager. Because of the SEP and its high credit rating, the University of California was able to
generate centralized bond funding21 that individual campuses can take advantage of to finance projects.
One hundred percent of all IOU-incented projects took advantage of the SEP bond funding.
Furthermore, project implementation and progress are tracked through a system-wide software program called Primavera P6. 18http://www.universityofcalifornia.edu/campuses/welcome.html. 19http://sustainability.universityofcalifornia.edu/enrg_plan.html. 20http://sustainability.universityofcalifornia.edu/enrg_plan.html. 21http://www.universityofcalifornia.edu/news/article/20762.
4.1.2 California State University System
The California State University system is the largest four-year university system in the United States,
hosting more than 400,000 students in 23 campuses across California.22 The CSU system is headed by the
Chancellor’s Office at the state level, with campus presidents directing activities at each campus. The California State University system is headed at the state level by the Board of Trustees, which includes the chancellor. Each campus is governed by a campus president, who reports directly to the Chancellor’s Office. The IOU partnership works directly at the state level with staff members of the Chancellor’s Office. The CSU system works under Legislative Governance; although policies set at the state level are generally standardized throughout, a legislative process must occur before the
Chancellor’s Office can instate a policy.
The CSU Chancellor’s Office currently uses its deferred maintenance plan, which is updated on an ongoing basis, to identify energy efficiency projects. CSU decided against an SEP similar to that created by the UC system in 2008, as they believe that their capital plan includes enough detail to help identify potential and implement projects. The Chancellor’s Office maintains system-level energy efficiency goals with some input from campuses. However, campuses are not mandated to participate in the IOU goal development process. Like the UC system, project implementation and progress are tracked through a system-wide software program called Primavera P6.
4.2
Overall Perceptions
Through interviews with partner contacts and IOU program managers, Navigant concludes that the UC/CSU/IOU partnership is operating effectively and exceeding program goals. Navigant found that both institutions have a well-developed understanding of their energy efficiency potential (either through specific energy plans or updated deferred maintenance plans). With support across the organization, from the UC Board of Regents and CSU Board of Trustees through campus-level operations management, both institutions have the structure and resource options to effectively
implement projects. Sometimes, however, the institutions take different strategic and tactical approaches to achieving energy management goals. Details regarding the universities’ capacity to develop and implement energy efficiency projects are provided in the following sections.
4.3
Long-Term Energy Planning
The following details the universities’ ability to identify energy efficiency projects and continually improve energy consumption on their campuses.
1. Attitudes Toward Sustainability and Campus-level Engagement: Both institutions have a history
of campus-level engagement that has driven commitments to sustainability and energy reduction:
a) CSU has been committed to sustainability through its Sustainability Advisory Committee, which
“develops partnerships and funding” to support sustainability efforts in education and building design and operations. With regard to energy efficiency, the university system has over 35 Leadership in Energy and Environmental Design (LEED)-certified buildings, and also requires all new construction or major renovation projects to exceed the provisions of Title 24 (2008 California Energy Code). It also partners with the IOUs and the Alliance to Save Energy to
enable students at individual campuses to “research and implement energy efficiency best
practices and facilitation of retrofits.”23
b) Much of the early success of the UC partnership can be attributed to a student-led campaign that
started in early 2002, in which students requested that the regents ask the president to undertake
a feasibility study for the adoption of a Green Building24 Policy and Clean Energy Standard25 for
all future new construction and renovated buildings. The details of the campaign are chronicled in Matthew St. Clair’s paper, “The University of California Goes Solar – How Students
Convinced One of the Largest University Systems to Adopt an Ambitious Sustainability Policy.” Based on the feasibility study, in July of 2003, the Board of Regents issued the Sustainability
Policy Principles,26 which recommended steps to further the adoption energy efficiency and
sustainability principles for all capital projects.
In mid-2004, a formal Presidential Policy on Green Building Design and Clean Energy
Standards, now known as the Sustainable Practices Policy, was issued.27 The University of
California’s Sustainability Practices Policy provides guidelines and goals for Clean Energy, Sustainable Operations and Maintenance, Sustainable Transportation, and Green Building (among others areas).
2. Energy Savings/Goals: Both the UC and CSU systems have the tools in place to understand the
potential for energy efficiency gains:
a) Currently, goals for each program cycle are set through a bottom-up approach for the UC
system, in which each school provides a list of potential activities and funding required; CSU goals are set by the Chancellor’s Office, with some input from individual campuses. However, each CSU campus is not mandated to provide energy-saving projects for the next program cycle.
b) In 2008, the University of California Office of the President developed a SEP28 that identified
over 1,000 potential projects for the UC system, as well as each individual campus. CSU decided against creating a formal SEP; contacts at CSU relayed to Navigant that CSU’s deferred
maintenance plan/capital plan includes enough detail to help identify potential and implement projects.
c) Some, if not all, campuses at both institutions meter and track building usage through a type of
McKinstry Enterprise Energy Management Information System (EEMIS) system, which provides a useful tool for tracking and implementing new energy efficiency projects. CSU contact, Len Pettis, noted that effective programs “should be based on metering” or, in other words, there must be “data-driven energy efficiency.” Tools that provide real-time energy usage at each facility or building are the best to identify energy efficiency opportunities continuously and in the longer term.
23http://www.calstate.edu/cpdc/sustainability/initiatives/. 24http://sustainability.universityofcalifornia.edu/documents/gbfeasibility.pdf. 25http://sustainability.universityofcalifornia.edu/documents/cefeasibility.pdf. 26http://sustainability.universityofcalifornia.edu/documents/regpolicy.pdf. 27http://www.ucop.edu/ucophome/coordrev/policy/sustainable-practices-policy.pdf. 28http://sustainability.universityofcalifornia.edu/enrg_plan.html.