This plan was developed by the Southwick Community Development Planning Committee with funding provided by the Commonwealth of Massachusetts via Executive Order 418 through the Executive Office of Environmental Affairs, the Department of Housing and Community Development, the Department of Economic Development and the Massachusetts Highway Department. Technical assistance was provided by the Pioneer Valley Planning Commission (PVPC) and Dodson and Associates. Committee Members include:
Betty Bradley Barbara MacEwen Craig Samuelson
Staffed by Dennis Clark and Jean Cass, Town of Southwick and Margaret Gibbs, Catherine Miller, and Diana Souza, PVPC and Peter Flinker, Dodson and Associates, May 2004
It is the hope of the Committee that this plan will be a living document, referred to often and updated as needed to achieve the Town’s vision.
Table of Contents
EXECUTIVE SUMMARY ...4
OPEN SPACE AND RESOURCE PROTECTION ELEMENT...9
HOUSING ELEMENT ...10
Introduction/Overview...10
Housing Goals and Objectives...10
Housing Inventory ...11
Description of Housing Stock and Densities ...11
Housing Type and Occupancy...13
Public Housing ...15
First-time Homebuyer Programs ...15
Homelessness Problems...15
Fair Housing Plan ...16
Chapter 40B Goal, Number, Type and Percent of Subsidized Housing...16
Checklist for Housing Certification...17
Current Housing Costs...17
Areas Where Housing Stock Does Not Meet Health or Sanitary Standards ...20
Extent of Vacant and Abandoned Housing ...21
Vacancy Rate for Owner and Rental Occupied ...21
Housing Factors Unique to the Community ...21
Housing Authority Capacity ...21
Description of Recent Housing Trends...22
Numbers and Types of Subdivisions ...22
Housing Needs...22
Household Size ...22
Current and Projected Population Through 2010 ...22
Number and Type of Households ...22
Age Composition and Distribution ...24
Income Data...24
Affordability Gap ...25
Households on Waiting Lists for Subsidized Units ...26
Supply and Demand Comparison ...26
Identification of Unmet Housing Needs (i.e. Gaps Between Supply and Demand) ...26
Gaps in Continuum of Housing Types ...31
Land Available for Housing ...31
Strategies for Housing ...31
ECONOMIC DEVELOPMENT ELEMENT ...34
Introduction/Overview...34
Economic Development Goals ...34
Workforce Characteristics...34
Population Growth & Age Distribution...34
Number of Households...36
Travel to Employment ...37
Poverty Rate ...37
Education Attainment ...37
The Economy...38
Employers and Wages ...38
Employment Distribution ...39
Tax Increment Financing...40
Municipal Revenues & Expenditures ...40
Land Use Data...41
Land Available for Economic Development ...42
List of Businesses in Southwick ...42
Southwick Business Owners Comment on the Town’s Economic Status ...42
Summary of Economic Development Issues/Concerns ...43
Economic Development Strategies ...43
TRANSPORTATION ELEMENT...46
Background on Corridor Studies ...46
Summary of Route 10/202 Corridor Study (1995)...46
Major Findings ...47
Land Use-related Corridor Study Recommendations ...47
Transportation-related Recommendations ...48
Status of Major Transportation Projects in Southwick...48
Additional Transportation Issues...49
Implementation Plan ...49
BRINGING IT ALL TOGETHER ...51
Action Plan for the CD Plan Elements ...51
Southwick Community Development Action Plan...51
Balancing the CD Plan Elements...53
Bringing It all Together Map...53
MAPS ... 55
Appendices ...58
Appendix A Possible Housing Strategies ...59
Appendix B Proposal for Additional Community Participation...61
Appendix C Community Survey on Proposed Strategies ...63
Appendix D Partial List of Businesses in Southwick ...71
EXECUTIVE SUMMARY
Southwick has evolved from a rural farming community to a bedroom community over the last twenty years. The town has one of the highest growth rates in the Pioneer Valley and the average assessed value of a single-family home appreciated ten percent since 1995 spurred in part by an influx of highly educated young families with high incomes. Southwick is such an attractive place to live because it is a major recreational center with the
Congamond Lakes and large open space areas combined with easy access to major highways and interstates and close proximity to the cities of Springfield, Massachusetts and Hartford, Connecticut.
Even though most residents commute to regional employment centers such as Springfield, Holyoke, Windsor Locks, Enfield and Hartford, Southwick has an active manufacturing sector, which is important to the local economy. Southwick’s transportation connections contributed to the development of its manufacturing industry. The principal highways are State Route 57 and U.S. Route 202, which connects with the Massachusetts Turnpike (Interstate Route 90) and U.S. Route 20 in the neighboring town of Westfield. The Massachusetts Turnpike connects the region to Boston and to Albany, New York. Interstate 91 provides direct access to Hartford,
Connecticut, and to Brattleboro, Vermont. Both the Barnes Municipal Airport and Bradley International Airport are within a 30-minute drive from Southwick.
The town received equivalent plan credit for the visioning process completed as part of the town’s Master Plan development in 1997. This allowed Southwick’s Community Development Planning (CDP) committee to use an estimated $4,000 that would have been spent on visioning on planning. The town chose to enhance the natural resource protection element of the plan focusing on gaining updated open space maps. Half way into the
community development planning process, however, it became clear that many people in town government were not satisfied with the previously completed master planning process. Town officials who reviewed drafts of the plan stated that they did not appreciate hearing references to the vision and goals articulated in the Master Plan in this new plan. Members of the business community came forth to support an abbreviated visioning process that would have allowed the CDP committee to replace references to the vision and goals from the master planning process with more current community goals, but the Select Board decided not to undertake this effort before the deadline for completion of this community development plan. As a result, this community development plan refers to and seeks to realize the vision and goals from the Master Plan. However—the CDP committee has secured support from most Town Boards to facilitate a series of community visioning workshops in the Fall 2004, the results of which will be used to update this plan.
None of the recommendations from the Master Plan have been acted upon. The Master Plan summarized 1990 census data for the town. This plan is based on 2000 census data, and speaking in broad terms—the trends identified in the Master Plan continue. Southwick is seven years further down the road of transforming from a farming community to a bedroom community; residential development is more of a concern than commercial and industrial development, and College Highway remains a focal point of concern. Townspeople are still grappling with one big question--how can Southwick transform itself into more of a traditional New England village center without harming any of the town’s established businesses or devaluing property owner’s land? The goals and recommended actions in the Master Plan are still relevant today.
Open Space and Resource Protection Element Summary
The Town of Southwick was most interested in this element of the Community Development Planning process. The Open Space Committee of the Conservation Commission was the entity in town that took the initiative to secure E.O. 418 community development funds for Southwick. At the start of this planning process, committee members had low expectations for any big picture utility of the E.O. 418 funding. The committee was most interested in using the funds to secure updated maps. And indeed, the open space element does include 11 beautifully updated maps, but it also includes some key recommendations for actions the community can take to achieve its vision—a rural community that balances protection of natural resources and open space with diverse housing opportunities and a healthy and vital local economy. Over the one and a half years it took to develop this plan, open space committee members worked hard to understand the connections between open space
protection and housing, transportation and economic development. The bringing it all together map reflects the committee’s considerable understanding.
The community development planning committee developed and accepted the following goals and objectives.
• Guide protection of streams and ponds, wetlands, flood plains and wildlife habitat;
• Identify the farmland and forests that support those who make a living from the landscape and whose work is fundamental to maintaining Southwick’s visual character and quality of life;
• Establish a network of hiking trails that link each neighborhood to nearby wild lands and ultimately provide regional links across the area;
• Examine the possibility of enhanced protection for historic sites and the historic landscapes that surround them.
Housing Element Summary
This section summarizes recent housing data and articulates housing-related needs. It outlines actions town officials and residents alike can take to fill housing gaps. According to the Western Pioneer Valley Subregional Housing Plan (a document required by DHCD to which each municipality affected contributes annual goals with respect to housing) the Town of Southwick has committed to:
• Create 13 units of affordable housing each year;
• Rehabilitate up to 7 existing single family units per year;
• Work with developers to ensure units priced to meet a wide array of incomes;
• Sponsor first-time home-buyer seminars;
• Seek technical assistance for zoning changes;
• Look into federal and state programs for infrastructure development, housing programs, and greenways, and,
• Seek funding for housing rehabilitation.
A survey completed in 1996 as part of the Master Planning process suggested that Southwick residents preferred single-family residential development versus construction of condominiums or apartment buildings. Data
collection and analysis completed as part of this planning process reveal a need for starter homes and places for ‘empty nesters’ to live. A variety of housing types, including condominiums and apartment buildings could help provide much-needed housing to under-served segments of the community. Southwick does not necessarily need a lot of new construction. Zoning changes to allow more intense residential uses in its zoning, such as accessory apartments and townhouses could provide housing choices for residents.
Strategies for Housing
There are many tools Southwick could use to expand housing availability, (a laundry list of possible housing strategies is included in the Appendix).The first thing the Southwick CDP wants to do is apply for the Department of Housing and Community Development (DHCD)’s new Priority Development Fund: Planning Assistance for Housing Production (PDF) to develop a more detailed affordable housing plan for the town
(www.mass.gov.dhcd/temp/04/pdf.doc). The proposal will include a request for funding to conduct an estimated two site assessments for new or renovated housing, to complete proposed by-law revision work, and to hold a series of community workshops/visioning sessions focused on building community support for affordable housing. Possible Bylaw Revisions
During the already approved community-wide planning workshops that the CDP plans to hold in Fall 2004, residents and elected officials will be asked to rank proposed bylaw revisions (listed below) and funds will be sought to hire consultants to assist the town in drafting and adopting the top ranked bylaw revisions.
Accessory Apartments
Accessory apartments can provide improved rental housing opportunities by allowing “mother-in-law” or accessory apartments in single family homes, without altering the character of neighborhoods.
market development of affordable housing by offering developers residential density bonuses. In return, the developer must set aside a percentage of housing units in the development for low and moderate-income residents. In existing inclusionary bylaws, the percentage of affordable units generally ranges from 10 to 25% of the total units being developed. As alternatives, communities may allow developers to construct some of the required affordable units off-site, or allow the developer to make a cash payment to the community equal to the value of the affordable units to be used by the community to develop affordable units. Inclusionary zoning allows the integration of all levels of income and allows for a balance between housing and employment. This is done by allowing equal opportunities to all types of developments.
Cluster Zoning Regulations
Since Massachusetts has now amended the State Zoning Act, Chapter 40a, to allow by-right “cluster”
development, Southwick could update its Zoning Regulations to allow this use by right, rather than by Special Permit. The town could give a density bonus to a developer for preserving additional open space, smaller lots, and affordable housing, among others.
Co-housing
Co-housing projects are grouped residential units with some shared facilities, such as dining or recreational facilities, with cooperative management.
Congregate Care and Assisted Living Facilities
There are several forms of elderly housing, such as life care facilities, senior apartments and congregate elderly housing, which are not addressed in many community bylaws. These are vital housing opportunities for elders and can be allowed by Special Permit in most residential areas.
Duplexes, Multi-family Housing, Accessory Unit Zoning to Allow Development
Accessory apartments are another possibility that could serve to increase housing options, especially for singles and/or elders.
Live-and-Work Units Zoning
Live-and-work units can include artisan studios, housing for seasonal employees and dormitories. They can provide an affordable housing alternative to owner-occupied single family homes.
Mixed Use Village Center Development
Mixed Use Village Center Development can include a variety of uses, such as retail, office, and housing in a single planned development. Housing options could include second story apartments, townhouses or multi-family complexes.
Phased Growth Bylaw
The purpose of this bylaw is to promote a manageable rate of residential growth that is consistent with historical development patterns, to limit strain on the community’s ability to provide services to such development, and to protect and enhance the character of the town and its natural resources utilizing a planned growth rate and development schedule.
Planned Unit Development
Planned Unit Developments (PUDs) provide opportunities for developing a mix of housing types within a single clustered residential development. PUDs can include single family homes, townhouses, apartments and other residential uses. Further, they can include some limited commercial uses, such as services, medical, and retail on a scale to serve the PUD.
Transfer of Development Rights
Transfer of Development Rights (TDR) is a tool which is employed primarily to protect open space and farmland. But it can also promote creation of affordable housing. This is because development rights are transferred to a receiving area near a village center, where greater density can be allowed due to the availability of town services. This receiving area could be targeted for affordable housing.
Village Center/Compact Growth Center Bylaw
evening attractions. Vehicular circulation should be well organized, yet the use and visual impact of cars should be minimized. There should be a variety of parks for people to gather. The Center should be designed as an interrelated unit with strong pedestrian, automobile, and visual links between land uses.
Economic Development Element Summary
The Town of Southwick is doing relatively well with respect to traditional measures of economic development (household income, employment distribution, business owners’ assessments), but like many communities in the region, the economic character of Southwick is becoming increasingly service based and its manufacturing sector is vulnerable to decline. If the economic character of the community changes, then municipal services will need to change accordingly. The community’s economic development path, in part, will determine the future character of the town. Planning for Southwick’s economic future will help to create a community in which residents want to live.
Economic Development Goals and Objectives
The economic development-related goals developed as part of the 1997 Master Planning process are still relevant today.
• ensure that new development in Southwick is appropriate for a rural and suburban community.
• encourage appropriate commercial and light industrial development in Southwick, while protecting environmental quality and town resources
• guide the continued development of appropriate, efficient, and economical infrastructure for Southwick, including utilities, public safety, schools, and municipal water and sewer
Economic Development Strategies
Adopt a Planned Industrial or Business Development Bylaw -- A planned industrial and/or business development is a development built under single ownership, consisting of light industrial and/or business sites that are simultaneously planned and built.
Adopt a Mixed Use Development Bylaw -- The purpose of a mixed use bylaw is to foster a greater opportunity for creative development by providing guidelines that encourage a mix of uses compatible with existing and neighborhood properties; to provide housing and business uses in locations where a variety of town services are available; to promote utilization of existing buildings and property, and to encourage the provision of open areas. Rezoning of Targeted Land Parcels for Business, Light Industrial or Industrial Use -- After identifying land parcels targeted for economic development, Southwick could re-zone selected areas or create new zoning districts which could help achieve the town’s economic development (and housing) objectives,
Infill Development -- Conventional development patterns have led to suburban sprawl, destroy open lands, and create gridlocked lifestyles. A major solution to these problems is infill development, or the creative recycling of vacant or underutilized lands, such as vacant lots, parking lots, and empty shopping malls.
Special Districts and Incentive Programs – Creating special districts is a proven effective means of
encouraging certain land uses in specific geographic target areas. There are many state laws and programs in which Southwick could participate in to promote economic development.
Town Center Revitalization -- Revitalizing an existing town center can improve the community overall image and enhance economic development.
Transportation Element Summary
Southwick received equivalent plan credit for the Route 10/202 Corridor Study. The transportation-related goals and strategies articulated in that plan, as well as in the Master Plan are still relevant for Southwick. The
community development planning committee and its consultants created an implementation plan for the Corridor Study as part of this plan.
Transportation Goals (from the Master Plan)
• Focus commercial growth in existing centers/nodes and reduce trip generation
• Establish new use recommendations for commercial zones
• Alleviate traffic congestion by acquiring land for consolidated public parking areas
• Improve parking and landscaping requirements
• Alleviate traffic congestion
• Provide pedestrian and bicycle paths and facilities
• Protect existing residential areas
• Improve the sign bylaw
• Control unplanned parking lot development in shopping centers
Transportation Strategies (from the Master Plan and Route 10/202 Corridor Study)
• Amend the Southwick zoning map to create three new commercial centers to improve traffic flow: Southwick Center zone with Incentives for shared curb cuts, parking lots, and planned business developments; Feeding Hills Village zone for mixed-use developments; Congamond Business zone.
• Amend the zoning bylaw to allow commercial uses that typically generate over 100 average daily vehicle trips to 2 locations--one within a planned business development within the Center zone, and in the Congamond Business zone.
• Amend the zoning bylaw with regulations for the business restricted zone located in Southwick at the Westfield border.
• Amend the zoning bylaw to allow commercial, business and service uses only in mixed use zones within mixed use developments.
• Establish access standards including: limit the number of curb cuts by encouraging access via common driveways; a maximum driveway width of 20 feet; safe sight distance; safe circulation within the lot; a special permit process for larger developments to require dedicated turning lanes as necessitated by the size of the development; limit asphalt coverage; modify parking lots with landscaping and shade trees; accurately reflect parking needs associated with uses-especially for fewer spaces; clearly define the edge between businesses and roadway-retro-fitting existing commercial shopping areas with safe internal sidewalk networks connecting to existing networks; install a sidewalk and bikeway network from Feeding Hills Road to Depot Street and Sheep Pasture Road, integrating College Highway sidewalks with a Southwick Town Center network to serve the municipal buildings, elders, and single family residences around Prifti Park; encourage vegetated buffering of residential neighborhoods.
• Establish a Creative Development bylaw and Overlay Zone for the residential land surrounding the Business district to provide an alternative to the strip residential development that typically emerges adjacent to an intensely developed area.
• Encourage development that maintains a traditional New England rural character and land use pattern by: controlling the random rezoning of residentially zoned parcels in the Communities; adopting a formal policy restricting rezoning individual parcels in residential districts into a business or commercial zoning district; limiting sign sizes according to speed, and making the bylaws more specific about size, type, dimensional requirements by district, and enforcement and administration standards; requiring special permits for the construction of multiple structures in both existing and new commercial shopping centers; posting of a performance guarantee insuring that all special permit requirements are met; providing a concept plan detailing landscaping, parking, pedestrian and bicycle systems within the development for all structures existing or in the future; incorporating landscape requirements for interior parking and the periphery of the lot; requiring mandatory buffer yards along the frontage street; providing pedestrian and vehicular traffic circulation plans, and requiring consistency of architectural design between shopping center buildings.
HOUSING ELEMENT
Introduction/Overview
In 1996, as part of the Master Plan process, residents were surveyed regarding their opinions about Southwick. The major finding relevant to housing was a preference for new residential housing to be single-family homes, rather than multi-family housing or condominiums. Even though there were many objectives related to housing in the narrative of the Master Plan, only one of the thirty strategies that made it into the Master Plan Implementation document addresses housing, which is “require flexible residential development for major subdivisions on farmland.”
Relying on the Master Plan as an expression of citizens’ desires, and considering the analysis of housing data summarized below, it appears that there is a disconnect between how residents feel about housing and the needs of Southwick’s special interest populations—particularly the elderly and young families just starting out. The members of the Community Development Planning (CDP) Committee responsible for oversight of this plan believe that it is important for Southwick to conduct a follow-up community involvement process during which residents will have an opportunity to voice their ideas about the kind of housing they want to see in their community. The CDP plans to apply for Executive Office of Environmental Affairs (EOEA) Community Development Plan implementation funds as well as for Department of Housing and Community Development (DHCD) Priority Development Fund (PDF) funds to expand the range of housing options available in town.
The purpose of this document is to help Southwick identify and plan to meet the housing needs of its residents. This report provides:
Housing Inventory--an assessment of existing data on current housing conditions.
Housing Needs Report--an assessment of housing demand. This section evaluates current housing needs and affordability for households and individuals of low, moderate, and middle incomes, based on available data. Supply and Demand Comparison (Gap Analysis)—a comparison and analysis of the gap between housing supply and demand for low, moderate and middle income households. The analysis examines the affordability gap between people needing housing and the income required to purchase or rent homes in the community Housing Goals and Objectives Statement—short and long-term goals to address housing gaps and needs. Housing Suitability (integrated into Bringing it all Together) Map—a GIS-based housing suitability map showing potential locations for new housing units, based on current zoning, infrastructure, soils (if data is available) and environmental constraints identified in the Open Space Element.
Housing Goals and Objectives
Goal #1 of the 1997 Master plan was “to ensure that new development in Southwick is appropriate for a rural and suburban community.” The specific objectives recommended in that plan related to housing are:
• to ensure that new development is designed to be attractive, well-planned and consistent with community character;
• to provide a diversity of housing types to enable residents from a wide range of economic levels and age groups to live in Southwick;
• to identify areas of Southwick appropriate for different densities of residential development, for
commercial development, and for industrial development and to direct growth toward those appropriate areas so as to minimize adverse effects on town services and the environment
• to ensure that the availability of town infrastructure is a key factor guiding the timing and location of new development;
• to establish recognized growth areas, within which publicly-funded infrastructure expansions shall be confined.
According to the Subregional housing plan (a document required by the Department of Housing and Community Development (DHCD) to which each municipality affected contributes annual goals with respect to housing) the town of Southwick has committed to:
• Create 13 units of affordable housing each year;
• Rehabilitate up to 7 existing single family units per year;
• Work with developers to ensure units priced to meet a wide array of incomes;
• Sponsor first-time home-buyer seminars;
• Get technical assistance for zoning changes;
• Look into federal and state programs for infrastructure development, housing programs, and greenways, and,
• Seek funding for housing rehabilitation.
A survey completed as part of the Master Planning process showed that a majority of respondents preferred single-family residential housing development to condominiums or multi-family housing. However, a variety of housing types are necessary to meet residents housing needs.
Housing Inventory
Analysis of U.S. Census data for the year 2000 in Southwick indicates that housing unit growth (20%) has kept pace with household growth (22%) during the past ten years. Growth in year-round ownership units from 1990 to 2000 was 28% while the number of rental units increased by only 0.2% (1 unit.) These numbers are consistent with vacancy rate statistics. The vacancy rate for ownership units was low and remained steady during the past decade at approximately 2%. However, the vacancy rate for rental units remained high during the same period at over 8%. The need for ownership units is greater than the need for rental units in Southwick, and ordinary market mechanisms are meeting the unit growth patterns needs.
Two other factors in the 2000 Census indicate that affordable housing is available in the Town of Southwick but inadequate to meet current residents’ needs. Seventy-six percent (76%) of owners use 30% or less of their household income for monthly owner costs. Another 7% pay between 30% and 35% leaving 17% (or almost one-fifth) paying owner costs of more than 35% of their household income. Similar statistics exist for rental housing-- 32% of renters pay less than $500 per month for rent. Another 43% pay between $500 and $749 per month. The majority of renters (75%) in Southwick pay less than $750 per month for housing (Source: DHCD website).
Description of Housing Stock and Densities
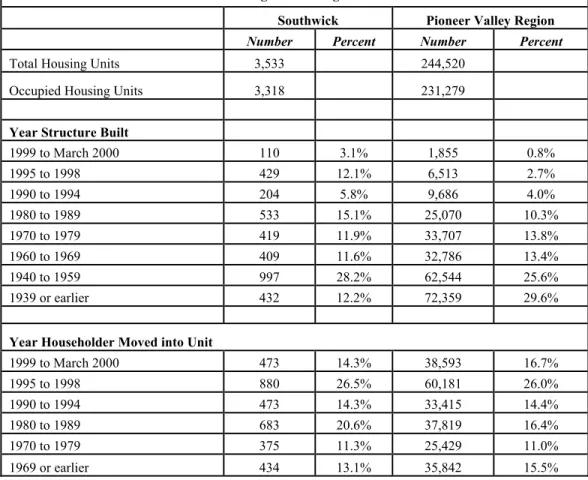
A large portion of Southwick’s housing stock is relatively new. From 1990 to 2000 743 (or 21%) of Southwick’s total housing units were built. Slightly over 28% of housing in Southwick is over 60 years old. The average rate of growth in housing has been approximately 13% per 10-year period, so the 21% increase from 1990 to 2000 is significant. (Source: 2000 U.S. Census).
Table One: Age of Housing and Tenure
Southwick Pioneer Valley Region
Number Percent Number Percent
Total Housing Units 3,533 244,520
Occupied Housing Units 3,318 231,279
Year Structure Built
1999 to March 2000 110 3.1% 1,855 0.8% 1995 to 1998 429 12.1% 6,513 2.7% 1990 to 1994 204 5.8% 9,686 4.0% 1980 to 1989 533 15.1% 25,070 10.3% 1970 to 1979 419 11.9% 33,707 13.8% 1960 to 1969 409 11.6% 32,786 13.4% 1940 to 1959 997 28.2% 62,544 25.6% 1939 or earlier 432 12.2% 72,359 29.6%
Year Householder Moved into Unit
1999 to March 2000 473 14.3% 38,593 16.7% 1995 to 1998 880 26.5% 60,181 26.0% 1990 to 1994 473 14.3% 33,415 14.4% 1980 to 1989 683 20.6% 37,819 16.4% 1970 to 1979 375 11.3% 25,429 11.0% 1969 or earlier 434 13.1% 35,842 15.5%
Source: U.S. Census Bureau 2000.
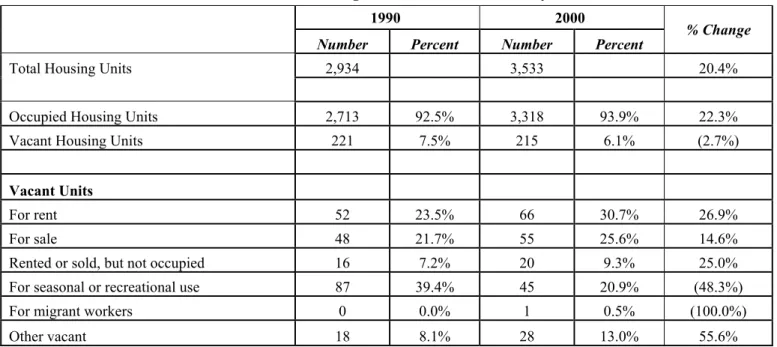
Southwick had 3,533 housing units in year 2000, an increase of 20% over the 2,934 housing units in 1990 (Source: 2000 U.S. Census). Of the 221 vacant units recorded, only 18, or 8%, were not being used in any capacity. Fifty-two percent were either for sale or for rent or awaiting new occupants. The other 40% were for recreational or seasonal use only.
Table Two: Housing Characteristics and Vacancy
1990 2000
Number Percent Number Percent
% Change
Total Housing Units 2,934 3,533 20.4%
Occupied Housing Units 2,713 92.5% 3,318 93.9% 22.3%
Vacant Housing Units 221 7.5% 215 6.1% (2.7%)
Vacant Units
For rent 52 23.5% 66 30.7% 26.9%
For sale 48 21.7% 55 25.6% 14.6%
Rented or sold, but not occupied 16 7.2% 20 9.3% 25.0%
For seasonal or recreational use 87 39.4% 45 20.9% (48.3%)
For migrant workers 0 0.0% 1 0.5% (100.0%)
Other vacant 18 8.1% 28 13.0% 55.6%
Source: U.S. Census Bureau 2000.
Housing Type and Occupancy
More than three-quarters of the housing stock is single family detached. With the single unit attached housing added, single family housing comprises over 83% of Southwick’s housing. Two-family residences make up 4%, and three or more units make up only 14% of the total housing units. Five rooms are most typical for unit size, 23%, while 6 or 7 rooms are the next most prevalent size at 17% each.
Table Three: Housing Type, Size and Occupancy
Southwick Pioneer Valley Region
Number Percent Number Percent
Total Housing Units 3,533 244,520
Units in Structure 1-unit detached 2,730 77.3% 137,915 56.4% 1-unit attached 188 5.3% 10,332 4.2% 2 units 122 3.5% 29,335 12.0% 3 or 4 units 92 2.6% 19,526 8.0% 5 to 9 units 59 1.7% 15,457 6.3% 10 to 19 units 135 3.8% 8,870 3.6% 20 or more units 198 5.6% 19,264 7.9% Mobile home 9 0.3% 3,769 1.5%
Boat, RV, van, etc. 0 0.0% 52 0.0%
Rooms per Housing Unit 1 room 41 1.2% 4,212 1.7% 2 rooms 67 1.9% 10,611 4.3% 3 rooms 243 6.9% 20,520 8.4% 4 rooms 547 15.5% 41,127 16.8% 5 rooms 828 23.4% 58,567 24.0% 6 rooms 608 17.2% 47,074 19.3% 7 rooms 624 17.7% 29,125 11.9% 8 rooms 368 10.4% 17,785 7.3% 9 or more rooms 207 5.9% 15,499 6.3%
Occupants per Room
1.00 or less 3,267 92.5% 224,302 91.7%
1.01 to 1.50 42 1.2% 4,584 1.9%
1.51 or more 9 0.3% 2,393 1.0%
Source: U.S. Census Bureau
In 2001, 85% of Southwick’s developed land parcels were used for single family housing, while only 10% were used for multi-family residential, condominiums or apartments (Source: Mass. Department of Revenue).
Table Four: Housing Parcel Type Parcels 1991 1991-2001 % Change Parcels 2001 2001 % of Parcels Total Parcels 2,565 23.3% 3,163 Single-Family Residential 2,304 16.2% 2,678 84.7% Multi-family Residential 82 13.4% 93 2.9% Condominium 45 177.8% 125 4.0% Apartment 11 872.7% 107 3.4% Commercial 103 13.6% 117 3.7% Industrial 20 115.0% 43 1.4%
Source: MA Department of Revenue, Municipal Data Bank.
Southwick’s housing is predominantly owner occupied (81%), with nearly 19% renter occupied.
Table Five: Owner and Renter Occupancy
1990 Percent 2000 Percent Percent Change (1990 to 2000)
Occupied Housing Units 2,713 3,318
Owner Occupied 2,095 77.2% 2,699 81.3% 28.8%
Renter Occupied 618 22.8% 619 18.7% 0.2%
Public Housing
As of 1999, Southwick had 68 state and no federal public housing units according to DHCD. As of November 2002, there were 4 units receiving Section 8 federal rental assistance, one unit using state vouchers, and no units receiving state rental assistance (MRVP) (Source: MA Department of Housing and Community Development, HAP, Inc.).
First-time Homebuyer Programs
Southwick had one loan originated under the MassAdvantage first-time homebuyer loan program in 2001. The MassAdvantage Program is administered by MassHousing. Southwick participates in the Soft Second loan program, but no households in the town have utilized the program in 2001. The Soft Second program is
sponsored by the Massachusetts Housing Finance Agency (MHFA) and the Massachusetts Housing Partnership Fund (MHP) and administered by HAP, Inc. The program subsidizes a second mortgage on a home to help cover interest on the first mortgage for lower income families (Source: MHFA and HAP, Inc.). The income limits for the Soft Second loan program in the town of Southwick are as follows:
Household Size Maximum Income
1 $40,039 2 $40,039 3 $40,039 4 $41,700 5 $45,000 6 $48,350 7 $51,700 8+ $55,000
(Source: Massachusetts Housing Partnership Fund).
The price limits for the Soft Second loan program for the town of Southwick are as follows:
Property Size Maximum Purchase Price
Condominium $150,000 Single Family $150,000 Two Family $180,000 Three Family $200,000 (Source: Massachusetts Housing Partnership Fund)
Homelessness Problems
There is no data attesting to a problem of homelessness in Southwick. According to the Donahue Institute’s Needs Assessment Report for the Hampshire County Action Commission12, homelessness is an issue in the Pioneer Valley Region. Of the 172,916 individuals serviced by the Food Bank of Western Massachusetts, over 16,000 people (9.4% of those served by the Food Bank) identified themselves as homeless. If we consider Western Massachusetts to include Berkshire, Franklin, Hampshire, and Hampden Counties, the total population of the region according to the 2000 Census was 814, 967 individuals2. The homelessness rate according to the statistics from the Food Bank of Western Massachusetts is therefore approximately 2% in Western
Massachusetts. However, homelessness may be more prominent in extensive urban areas such as Springfield and Holyoke –a plausible possibility that not reflected in the rate of homelessness based on the Food Bank statistics. The Food Bank statistics are not encompassing of all homeless persons in western Massachusetts, meaning homelessness may be a real concern in the area.
In another measurement of homelessness as part of the 2000 Census, researchers visited all known emergency and transitional shelters in counties with at least 100 shelter beds on the same day (March 27, 2000) to gauge the relative problems of homelessness by state and county3. The shelter population for Massachusetts was 5,405 individuals, including the 330 individuals sheltered in Hampden County (at least 141 of who were located in Springfield)4. Not included in the shelter population were individuals in shelters for victims of domestic violence, nor were waiting lists for shelter beds taken into account in the survey5. As the Donahue Report points out, additional comprehensive services for homeless people may be available in more urban areas such as
Springfield and Boston, therefore attracting homeless individuals to those areas from more rural settings such as many found in western Massachusetts6.
Fair Housing Plan
Southwick has an Affirmative Fair Housing Plan on file with the USDA.
Chapter 40B Goal, Number, Type and Percent of Subsidized Housing
In 2001, Southwick had 145 units of subsidized housing meeting the criteria for M.G.L. Chapter 40B, or 4.2% of its total housing stock (Source PVPC, Subregional Housing Plans 2002).
Chapter 40B is the Comprehensive Permit law, which authorizes a housing agency or developer to obtain a single comprehensive permit for the construction of subsidized low or moderate-income housing if less than 10% of its total year-round housing in the community is subsidized low or moderate-income housing. Chapter 40B counts units subsidized under 21 different state housing assistance programs, and 13 federal housing programs, toward the 10% goal.
State programs that are included under Chapter 40B include:
• DHCD Chapter 689 Special Needs Housing
• DHCD Chapter 167 Special Needs Housing
• DHCD Chapter 705 Family Low Income Housing
• DHCD 667 Elderly/Handicapped Low Income Housing
• DHCD Low Income Housing Tax Credit Program
• DHCD Affordable Housing Trust
• DHCD Housing Innovations Fund
• DHCD Housing Stabilization Fund
• DHCD Local Initiative Program
• DHCD Individual Self Sufficiency Program
• DMR Group Homes
• DMH Group Homes
• EOHHS Facilities Consolidation Fund
• DMR/DMH community based housing
• Massachusetts Housing Partnership Fund
• MassHousing 80/20 Rental Housing
• MassHousing Elder 80/20
• MassHousing Elder Choice
• MassHousing Expanding Rental Opportunities
• MassHousing Housing Starts
Federal programs that are included under Chapter 40B include:
• FHLB Affordable Housing Program
• FHLB New England Fund
3An Overview of Hampshire County: A Needs Assessment Report for the Hampshire County Action Commission; p. 37.
• HUD HOME Program
• HUD Section 811
• HUD Low Income Housing Tax Credit Program
• HUD Section 202 Supportive Housing for the Elderly
• HUD Section 8 Moderate Rehabilitation Single Room Occupancy Program
• HUD Section 8 Project-based Rental Certificate Program
• HUD Shelter Plus Care
• HUD CDBG Housing Development Support Program
• HUD CDBG Community Development Fund
• HUD Enhanced Voucher
• USDA Rural Development Section 515 program
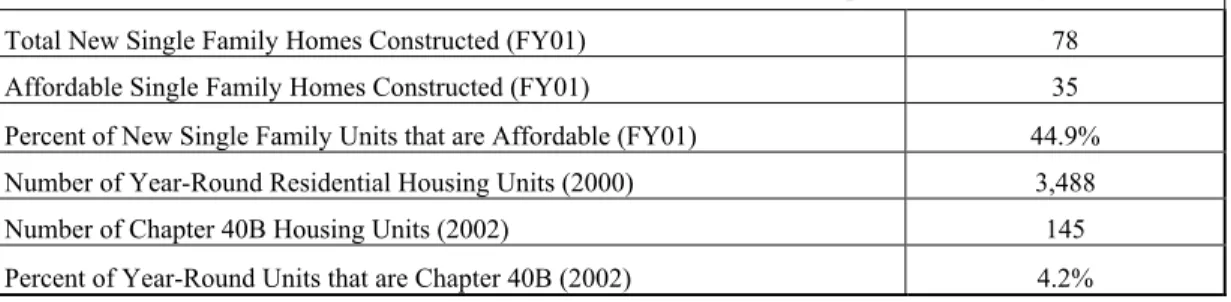
With 35 affordable single-family homes constructed in 2001, Southwick’s 4% is well below the state’s 10% Chapter 40B goal for subsidized housing, which makes the town vulnerable to a Comprehensive Permit application, unless the town undertakes efforts to expand its supply of subsidized housing.
Table Six: New Affordable Housing Construction and Chapter 40B Housing
Total New Single Family Homes Constructed (FY01) 78 Affordable Single Family Homes Constructed (FY01) 35 Percent of New Single Family Units that are Affordable (FY01) 44.9% Number of Year-Round Residential Housing Units (2000) 3,488
Number of Chapter 40B Housing Units (2002) 145
Percent of Year-Round Units that are Chapter 40B (2002) 4.2%
Source: PVPC, Sub-regional Housing Plans 2002.
Checklist for Housing Certification
Southwick received housing certification in September 2002 under Executive Order 418 (Source: DHCD website). The housing supply increased by 28 ownership units between April 1, 2001 and March 31, 2002, with 19 of those affordable. There were no affordable rental units below $600 built during the same time.
Housing certification is important because certified communities are eligible to apply for certain key state grants, including:
• Community Development Block Grants (CDBG)
• Community Development Action Grants (CDAG)
• Public Works Economic Development Grants (PWED)
• and other programs.
In addition, housing certification can also provide communities with bonus points for the following competitive grant programs:
• Self-help Program
• Massachusetts Clean Water State Revolving Fund Program
• Massachusetts Drinking Water State Revolving Fund Program
• Housing Stabilization Fund
• Soft Second Loan Program
• and other programs.
• (Source: Southwick Executive Order 418 Housing Certification, 2001)
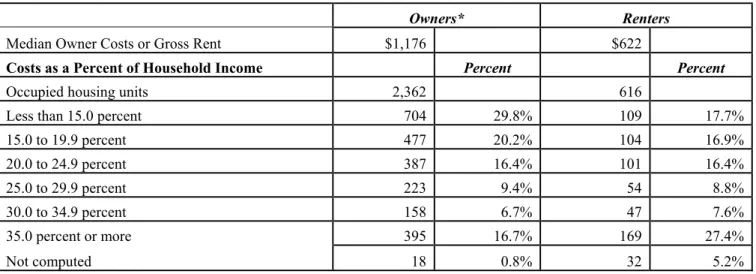
Current Housing Costs
this figure suggests a significant portion of Southwick homeowners (one-fourth) are living beyond their means. Forty percent of renters in Southwick were paying more than 30% of their total household income for housing costs (Source: 2000 U.S. Census). This suggests a need for low and moderate-income rental housing. Thirty-two percent (32%) of renters pay less than $500 per month for rent, while another 43% pay between $500 and $749 per month. The majority of renters (75%) in Southwick pay less than $750 per month for housing (Source: DHCD Website).
Table Seven: Housing Costs
Owners* Renters
Median Owner Costs or Gross Rent $1,176 $622
Costs as a Percent of Household Income Percent Percent
Occupied housing units 2,362 616
Less than 15.0 percent 704 29.8% 109 17.7%
15.0 to 19.9 percent 477 20.2% 104 16.9% 20.0 to 24.9 percent 387 16.4% 101 16.4% 25.0 to 29.9 percent 223 9.4% 54 8.8% 30.0 to 34.9 percent 158 6.7% 47 7.6% 35.0 percent or more 395 16.7% 169 27.4% Not computed 18 0.8% 32 5.2%
Source: U.S. Census Bureau 2000
* Monthly owner's costs are based on owners with a mortgage.
In the five years from 1997-2001, the median sale price for a house in Southwick rose 20% from $125,000 to $150,000 (Source: The Warren Group).
Table Eight: Southwick Home Sale Prices
Southwick County Comparison
Median Sale Price of Single-Family Homes Median Sale Price adjusted into 2001 $ Median Sale Price of Single-Family Homes Median Sale Price adjusted into 2001 $ Difference in Median Sales Price in 2001 $ Percent Difference in Median Sales Price in 2001 $ 1997 $125,000 $137,530 $85,001 $93,521 $44,008 47.1% 1998 $110,900 $120,294 $90,000 $97,624 ($22,670) (23.2%) 1999 $123,500 $131,259 $95,000 $100,968 ($30,290) (30.0%) 2000 $145,000 $149,041 $102,000 $104,843 ($44,198) (42.2%) 2001 $150,000 $150,000 $114,450 $114,450 ($35,550) (31.1%) Percent Change 1997-2001 20.0% 9.1% 34.6% 22.4% N/A N/A
Source: The Warren Group
The rate of single-family home sales in Southwick grew more rapidly between 1990 and 1995, increasing 20% over that period, and 30% between 1990 and 2001. The rate of sales over the past decade has ranged from 73-147 homes (3% to 6%) sold per year (Source: The Warren Group).
Table Nine: Number of Sales
Southwick County Comparison
Single-Family Home Sales Single-Family Land Parcels Percent of Parcels Sold during Year Single-Family Home Sales Single-Family Land Parcels Percent of Parcels Sold during Year Difference in Percent of Parcels Sold 1990 84 2,278 3.7% 3,643 91,569 4.0% (0.3%) 1991 104 2,304 4.5% 3,500 89,282 3.9% 0.6% 1992 88 2,315 3.8% 3,560 93,944 3.8% 0.0% 1993 119 2,304 5.2% 3,860 93,907 4.1% 1.1% 1994 147 2,342 6.3% 4,090 95,112 4.3% 2.0% 1995 135 2,377 5.7% 3,792 95,771 4.0% 1.7% 1996 116 2,443 4.7% 4,628 96,411 4.8% (0.1%) 1997 99 2,502 4.0% 3,938 97,067 4.1% (0.1%) 1998 105 2,549 4.1% 4,279 97,523 4.4% (0.3%) 1999 127 2,581 4.9% 4,538 98,033 4.6% (0.3% 2000 73 2,638 2.8% 4,267 98,604 4.3% (1.6%) 2001 109 2,678 4.1% 4,400 99,142 4.4% (0.4%) Percent Change
1990-2001 29.8% 17.6% N/A 20.8% 8.3% N/A N/A
Percent Change
1997-2001 10.1% 7.0% N/A 11.7% 2.1% N/A N/A
Source: The Warren Group; MA Department of Revenue, Municipal Data Bank
The median value for an owner occupied home in Southwick is $140,800. Less than 17% of all homes in Southwick are valued lower than $100,000 (Source: 2000 U.S. Census).
Table Ten: Value of Owner-Occupied Housing
Southwick Pioneer Valley Region
Number Percent Number Percent
Owner-occupied Housing Units 2,362 119,692
Less than $50,000 20 0.8% 1,504 1.3% $50,000 to $99,999 389 16.5% 33,984 28.4% $100,000 to $149,999 930 39.4% 47,500 39.7% $150,000 to $199,999 513 21.7% 21,486 18.0% $200,000 to $299,999 418 17.7% 11,581 9.7% $300,000 to $499,999 83 3.5% 3,187 2.7% $500,000 to $999,999 9 0.4% 377 0.3% $1,000,000 or more 0 0.0% 73 0.1%
Median Value of Owner-Occupied
Housing Units 140,800 $135,928
Source: U.S. Census Bureau
Most home mortgage applications for home purchases in Southwick are approved. Sixteen percent of all home financing applications in Southwick were denied, and 8% of conventional home purchase loans applications were denied (Source: Federal Financial Institutions Examination Council).
Table Eleven: Mortgages and Home Financing
Total Applications Loan O
riginat ed* Percent of Loans Loan Approved, Not Accepted**
Percent of Loans Loan Denied Percent of Loans
Loan Closed f
or O
ther
Reasons***
Percent of Loans
Federal Home Purchase Loans 21 16 76.2% 1 4.8% 1 4.8% 3 14.3%
Conventional Home Purchase Loans 155 119 76.8% 15 9.7% 13 8.4% 8 5.2%
Refinanced Mortgages 403 254 63.0% 22 5.5% 76 18.9% 51 12.7%
Home Improvement Loans 53 26 49.1% 9 17.0% 12 22.6% 6 11.3%
Loans on Dwellings for Five or More
Families 1 1 100.0% 0 0.0% 0 0.0% 0 0.0%
All Loans 633 416 65.7% 47 7.4% 102 16.1% 68 10.7%
Source: Federal Financial Institutions Examination Council, Home Mortgage Disclosure Act data * Loan executed.
** The borrower was approved but elected not to proceed.
*** Includes applications withdrawn by the borrower and files closed for incompleteness.
Areas Where Housing Stock Does Not Meet Health or Sanitary Standards
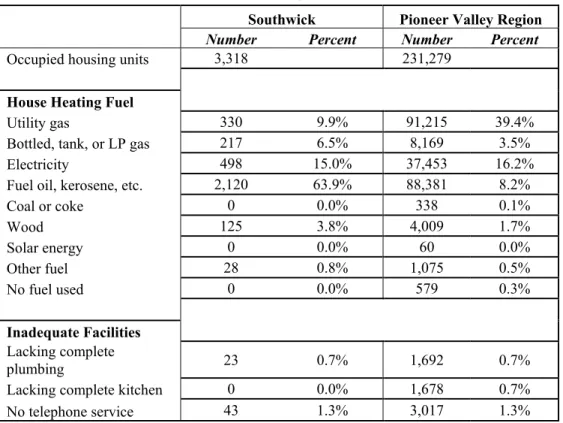
Almost all of Southwick’s housing stock meet health and sanitary standards. Twenty-three of 3,318 total housing units in Southwick (0.7%) had inadequate facilities for plumbing.
Table Twelve: Housing Characteristics
Southwick Pioneer Valley Region
Number Percent Number Percent
Occupied housing units 3,318 231,279
House Heating Fuel
Utility gas 330 9.9% 91,215 39.4%
Bottled, tank, or LP gas 217 6.5% 8,169 3.5%
Electricity 498 15.0% 37,453 16.2%
Fuel oil, kerosene, etc. 2,120 63.9% 88,381 8.2%
Coal or coke 0 0.0% 338 0.1% Wood 125 3.8% 4,009 1.7% Solar energy 0 0.0% 60 0.0% Other fuel 28 0.8% 1,075 0.5% No fuel used 0 0.0% 579 0.3% Inadequate Facilities Lacking complete plumbing 23 0.7% 1,692 0.7%
Lacking complete kitchen 0 0.0% 1,678 0.7%
No telephone service 43 1.3% 3,017 1.3%
Extent of Vacant and Abandoned Housing
Southwick has a low housing vacancy rate. In year 2000, Southwick had 3,318 occupied housing units (94%), while 215 units were vacant (6%) including seasonal units. This reduced from a 7.5% housing vacancy rate (221 units) in 1990. Not including seasonal rental units, the rental vacancy rate is slightly higher at 10% in year 2000, up from 8% in 1990 (Source: 1990-2000 U.S. Census).
Table Thirteen: Vacancy Rates
Southwick Rate Pioneer Valley Region Rate
Homeowner Vacancy Rate 2.0% 0.9
Rental Vacancy Rate 9.6% 4.1
Source: U.S. Census Bureau 2000
Vacancy Rate for Owner and Rental Occupied
The vacancy rate for ownership units was low and remained steady during the past decade at approximately 2%. However, the vacancy rate for rental units remained high during the same period at nearly 10%. The need for ownership units is greater than the need for rental units in Southwick and unit growth patterns indicate that the needs are being met through ordinary market mechanisms (Source: DHCD website).
Housing Factors Unique to the Community
Southwick has a modest number of seasonal or recreational housing units, totaling 45. This number reflects a marked decrease in seasonal and recreational units over the past ten years according to one housing official. The town has a prevalence of single-family housing that adequately meets the needs of median income homebuyers. In the way of low-income housing consumers, there seems to be a need for both rental and owner units making it difficult for low-income individuals or families to move or stay in the town according to one housing official.
Housing Authority Capacity
Southwick has a Housing Authority, which currently has 5 members, chaired by Robert Johnson. The Southwick, under Executive Director Henry Engelhardt, has 110 units of rental housing but administers 88 housing units. The town had 68 conventional state public housing units and no conventional federal public housing units in 1999 according to DHCD. As of November 2002, 4 households were receiving federal Section 8 rental assistance and one household was utilizing state vouchers according to HAP, Inc. Of the 110 rental units available, 88 units for elders and the disabled (8 are accessible); 16 units are for the mentally ill and developmentally disabled; and 6 units are for families.
Table Fourteen: Public and Subsidized Housing Capacity
Section 8 Section 8 Mod Rehab MRVP State Vouchers
Leases in Community as of November 2002 4 0 0 1
Leases in Region as of November 2002 3,699 956 359 49 Community Leases as a Percentage of the
Region 0.1% 0.0% 0.0% 2.0%
Conventional State Public Housing Units
1999 88 Conventional Federal Public Housing Units
1999 0
Description of Recent Housing Trends
From 1990 to March 2000, Southwick had 743 new housing units constructed, a 21% increase (Source: US Census Bureau). According to town records, the average number of single-family building permits per year during the past five years was 53. A permit for a multi-unit development was issued in 1997 for 51 units, during that same period (Source DHCD Website). Costs of single family residential units are skyrocketing.
Numbers and Types of Subdivisions
Between 1990 and 2000, 23 new subdivisions were built for 593 units. The largest development in this period was the American Inn, a retirement community, with 90 units. Pine Knoll III was next with 48 dwellings. In addition, from 2001 and 2002 three new subdivisions were built for an additional 102 units. The largest of these
subdivisions is Sunnyside Ranch Estates, a private gated community with golf course having 53 dwellings.
Housing Needs
Household Size
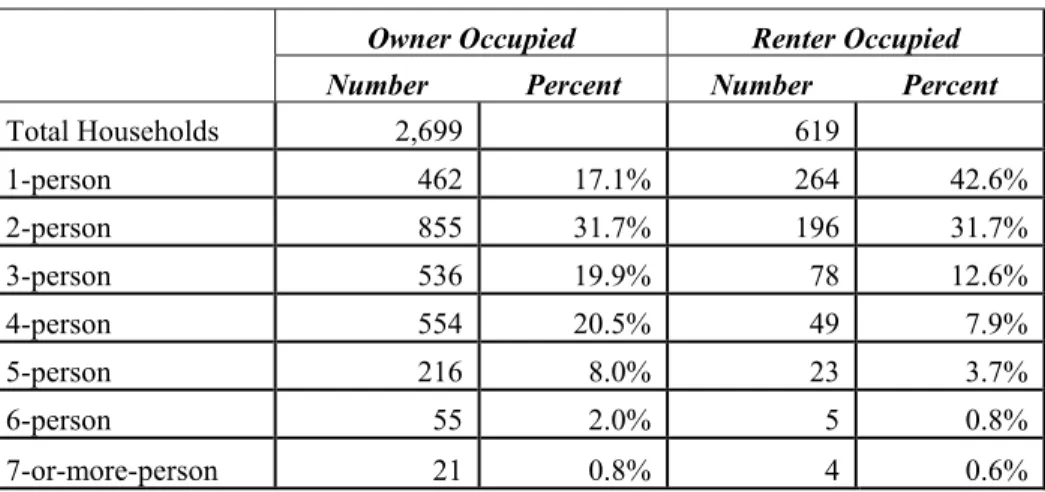
Two person households are the predominant household size in Southwick at 32% of all owner-occupied
households and 32% of all renter-occupied households. Nearly 50% of all owner-occupied households and 75% of all renter-occupied households in Southwick are one or two-person households. In addition, 89% of all households in Southwick are four-person households or smaller.
Table Fifteen: Size of Household
Owner Occupied Renter Occupied
Number Percent Number Percent
Total Households 2,699 619 1-person 462 17.1% 264 42.6% 2-person 855 31.7% 196 31.7% 3-person 536 19.9% 78 12.6% 4-person 554 20.5% 49 7.9% 5-person 216 8.0% 23 3.7% 6-person 55 2.0% 5 0.8% 7-or-more-person 21 0.8% 4 0.6%
Source: U.S. Census Bureau 2000
Current and Projected Population Through 2010
Southwick’s population increased 20% from 7,667 residents in 1990 to 8,835 residents in 2000 (Source: 2000 U.S. Census). Southwick’s population is projected to grow by 7% by the year 2010 to a total of 9,424 residents (Source: MISER population projections).
Number and Type of Households
Southwick has a number of special needs households, including 247 households with single parents and children under 18 years old, and 726 one-person households.
Table Sixteen: Household Composition
Southwick Pioneer Valley Region
Number Percent Number Percent
Total households 3,318 231,279 1-person households 726 21.9% 65,772 28.4% Male householder 318 9.6% 26,616 11.5% Female householder 408 12.3% 39,156 16.9%
2-or-more person households 2,592 78.1% 165,507 71.6%
Family households 2,419 72.9% 149,592 64.7%
Married couple-family 1,991 60.0% 106,925 46.2%
With own children under 18 967 29.1% 46,345 20.0% No own children under 18 1,024 30.9% 60,580 26.2%
Other family 428 12.9% 42,667 18.4%
Male householder, no wife present 154 4.6% 9,268 4.0%
With own children under 18 89 2.7% 4,415 1.9%
No own children under 18 65 2.0% 4,853 2.1%
Female householder, no husband present 274 8.3% 33,399 14.4%
With own children under 18 158 4.8% 21,036 9.1%
No own children under 18 116 3.5% 12,363 5.3%
Nonfamily households 173 5.2% 15,915 6.9%
Male householder 110 3.3% 8,504 3.7%
Female householder 63 1.9% 7,411 3.2%
Source: U.S. Census Bureau 2000
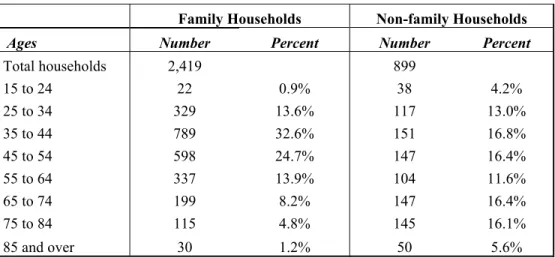
Southwick has 344 households where the head of household is over age 65 and 145 households where the head of household is over age 75.
Table Seventeen: Age of the Head of Household
Family Households Non-family Households
Ages Number Percent Number Percent
Total households 2,419 899 15 to 24 22 0.9% 38 4.2% 25 to 34 329 13.6% 117 13.0% 35 to 44 789 32.6% 151 16.8% 45 to 54 598 24.7% 147 16.4% 55 to 64 337 13.9% 104 11.6% 65 to 74 199 8.2% 147 16.4% 75 to 84 115 4.8% 145 16.1% 85 and over 30 1.2% 50 5.6%
Age Composition and Distribution
By far the largest age group in Southwick’s population is the age 35-45 group, with 1,836 residents in year 2000, and the second largest group is age 5-19, with 1,974 children (Source: 2000 U.S. Census). The third group is almost equally as large as the second at 1,743 residents aged 45-59. Like most towns in the region, Southwick has a growing population of elderly residents and persons approaching retirement age, and looking forward, the town will need to provide housing opportunities for this group. Southwick will also need to provide schools, recreation opportunities and services for children and teens.
Income Data
The median household income in Southwick decreased nearly 5% over the past decade, from $54,851 to
$52,296 (both adjusted to 1999 dollars). Southwick has 687 low-income households (incomes below $26,148), or 21% of all households. Southwick has 487 moderate-income households (incomes between $26,671 and
$41,837), or 15% of all households.
Table Eighteen: Household Income
1989 1999
Number Percent Number Percent Percent Change in Number of Households Total Households 2,713 3,312 Less than $10,000 238 8.8% 267 8.1% 12.2% $10,000 to $14,999 147 5.4% 149 4.5% 1.4% $15,000 to $24,999 366 13.5% 238 7.2% (35.0%) $25,000 to $34,999 403 14.9% 285 8.6% (29.3%) $35,000 to $49,999 592 21.8% 548 16.5% (7.4%) $50,000 to $74,999 721 26.6% 884 26.7% 22.6% $75,000 to $99,999 137 5.0% 595 18.0% 334.3% $100,000 to $149,999 112 4.1% 259 7.8% 131.3% $150,000 or more 9 0.3% 87 2.6% 866.7% 1989 1999 % Change
Median Household Income (1999 $) $54,851 $52,296 (4.7%)
Thresholds (1999) Estimated Number of Households *
Minimum Maximum
Low income households $0 $26,148 687 20.7%
Moderate income households $26,671 $41,837 487 14.7%
Middle income households $42,360 $78,444 1,245 37.6%
Source: U.S. Census Bureau; PVPC
*Estimate is based on assuming that households are evenly distributed within each income range reported by the Census Bureau.
Southwick has 3.8%, or 92, of its families below the poverty rate according to the Census 2000. An additional 43 families with a female head of household are also living below the poverty rate, as are 99 elders.
Table Nineteen: Poverty Rate Southwick Total Number Southwick Number Living Below Poverty
Line Southwick Poverty Rate Pioneer Valley Region Rate Families 2,419 92 3.8% 8.3%
Families with a female head of household and no husband
present 274 43 16.7% 25.7%
Individuals 8,835 537 6.1% 12.1%
Individuals 65 years and over 1,031 99 9.8% 8.2%
Children under 18 years 2,306 145 6.3% 15.5%
Source: U.S. Census Bureau 2000
Affordability Gap
The following table illustrates the affordable purchase price for a home in Southwick for households in three income categories: low, moderate, and middle incomes.
Table Twenty: Housing Affordability Upper Limit of Income Category 1 Income as a Percentage of Median Single Family Home Price 2 Percent of Income Necessary to Purchase the Median Single Family Home3 Most Expensive House Price Affordable 4 Maximum Number of Owner-Occupied Housing Units Affordable 5 Percent of Owner-Occupied Housing Units Affordable All Households $52,296 36.1% 24.1% $156,888 1,852 78.4%
Low income households $26,148 18.0% 48.2% $78,444 409 17.3%
Moderate income
households $41,837 28.9% 30.1% $125,510 1,339 56.7%
Middle income household $78,444 54.1% 16.1% $235,332 2,270 96.1%
Median sale price,
single-family home (2000) $145,000
Source: U.S. Census Bureau; The Warren Group; PVPC
1 - Based on thresholds established by the MA Department of Housing and Community Development. Upper limits of each category are determined as follows: low income=50% of median household income; moderate income=80% of median household income; and, middle income=150% of median household income.
2 - Median income, or upper limit for each income category, divided by the median single-family home price in 2000.
3 - Percent of income necessary to make monthly mortgage and property tax payments on the median single-family home with the following assumptions: a) 10% down payment; b) 7.0% annual percentage rate; c) 30 year fixed rate mortgage; d) no points; and, e) $15 per thousand property tax assessment. No homeowners insurance is included in this calculation.
4 - Median income, or upper limit for each income category, multiplied by three.
5 - The total number of owner-occupied housing units valued within the range of the maximum affordable house.
For Fiscal Year 2002, the Massachusetts Department of Housing and Community Development (DHCD) has determined that:
• the affordable rent is under $600.00 (Source: DHCD Website).
These figures are based on median Southwick income of $52,296, and assume 5% down payment, 7.5% APR mortgage for 30 years, 30% of income for housing costs and $300/month for taxes and insurance.
Based on this definition, in 2001, Southwick had 35 new housing units created which were assessed at under $240,000, and were affordable for a middle income household (Source: PVPC, Subregional Housing Plan). DHCD has determined that, for purposes of Housing Certification, (in Category A), qualifying ownership units or rental units are defined as “newly created units affordable to low and moderate-income individuals and families (making less than or equal to 80% of the medianincome for the MSA in which the unit is created).”
Based on a relatively high rental housing vacancy rate of 10%, Southwick appears to have adequate rental housing. Currently 23% of all Southwick’s housing is rental units, or 616 units.
Based on DHCD’s definition of affordable housing, the table above illustrates that:
• Southwick has a total of 409 housing units assessed at under $78,444 that are affordable to low income households with incomes under $26,148;
• Southwick has a total of 1,339 housing units assessed at under $125,510 that are affordable to moderate income households with incomes under $41,837.
Households on Waiting Lists for Subsidized Units
There are 40 families on the waiting list, and it takes approximately five years for placement in a subsidized unit according to one public official in town. It is unsure whether this includes elder families.
Supply and Demand Comparison
Identification of Unmet Housing Needs (i.e. Gaps Between Supply and Demand)
While housing in Southwick is mostly owner-occupied single-family homes (83%), Southwick does have 616 apartment units, which comprise 23% of its housing stock, and the vacancy rate is at 10% according to the tables. The elderly in Southwick have a hard time affording housing, as illustrated by the cost to income ratios for both rental and owned housing which are above the .30 standard thresholds.The Housing Authority related the sense that there was a need for more rental housing especially for low-income individuals and families. Southwick has gaps in the types of housing available, particularly in the following areas:
• Housing for the elderly: assisted living; congregate;
• Housing, both rental and owner, for low income families;
• Greater diversity of housing types to serve non-family households, single heads of households (i.e. townhouses, accessory apartments, condominiums etc.).
Table Twenty-one: Housing Stock Affordability Overview
Rental Housing Market Owned Housing Market
All
households Median monthly cost (gross rent) $622 Median monthly cost (with mortgage) $1,176
Median monthly income $4,358 Median monthly income $4,358
Ratio 0.143 Ratio 0.270
Under 25 Median monthly cost (gross rent) $622 Median monthly cost (with mortgage) $1,176
Median monthly income $4,213 Median monthly income $4,213
Ratio 0.148 Ratio 0.279
65 and over Median monthly cost (gross rent) $622 Median monthly cost (with mortgage) $1,176
Median monthly income $1,949 Median monthly income $1,949
Ratio 0.319 Ratio 0.603
Source: U.S. Census Bureau.
Southwick needs additional low and moderate-income housing to fulfill the needs of current residents. Low-income households have a difficult time affording their own homes in Southwick as do low-Low-income elders. Moderate and middle-income rental housing is relatively abundant. Moderate-income elders have similar
difficulties as low-income seniors in finding affordable housing within Southwick, especially in the stock of owned Percent of Occupied Housing Units that Cost Less than 30% of Monthly Income
0.0% 10.0% 20.0% 30.0% 40.0% 50.0% 60.0% 70.0% 80.0% Renter Owner
Percent of Units that Are Affordable
All Households Households with a Head 65 or Older
All Households 63.0% 74.3%
Households with a Head 65 or Older 50.9% 67.5%
1 2
Table Twenty-two: Analysis of All Housing Stock
Rental Housing Market Owned Housing Market
Affordable Units by Percent of Income Number Percent Number Percent
All households Total units rented and occupied 584 Total units owned and occupied 1,797
percent of income Rent less than 30.0 368 63.0% percent of income Costs less than 30.0 1,336 74.3%
more of income Rent 30.0 percent or 216 37.0% more of income Costs 30.0 percent or 461 25.7%
65 and over Total units rented and occupied 116 Total units owned and occupied 477
percent of income Rent less than 30.0 59 50.9% percent of income Costs less than 30.0 322 67.5%
more of income Rent 30.0 percent or 57 49.1% more of income Costs 30.0 percent or 155 32.5%
Affordable Units by Income Category All Under 25 65+ All Under 25 65+
Affordable rent Affordable costs
Low income $654 $632 $292 Low income $654 $632 $292 Moderate income $1,046 $1,011 $468 Moderate income $1,046 $1,011 $468 Middle income $1,961 $1,896 $877 Middle income $1,961 $1,896 $877
Affordable threshold Affordable threshold
Low income $699 $649 $299 Low income $699 $699 $299 Moderate income $1,249 $1,249 $499 Moderate income $1,249 $1,249 $499 Middle income $1,999 $1,999 $899 Middle income $1,999 $1,999 $899
Total rental units 584 584 584 Total owned units 1,805 1,805 1,805
Affordable for: Affordable for:
Low income 383 334 83 Low income 185 185 0
Moderate income 577 577 188 Moderate income 1,024 1,024 62 Middle income 584 584 522 Middle income 1,721 1,721 445
Percent affordable for: Percent affordable for: Low income 65.6% 57.2% 14.2% Low income 10.2% 10.2% 0.0% Moderate income 98.8% 98.8% 32.2% Moderate income 56.7% 56.7% 3.4% Middle income 100.0% 100.0% 89.4% Middle income 95.3% 95.3% 24.7% Source: U.S. Census Bureau.
Southwick has only 88 units of elderly housing available for residents, while there are 686 households with elderly heads of household, over age 65, including 344 family households and 342 non-family households. This could result in a shortfall of as many as 598 units of elderly housing. A variety of housing types would provide a
spectrum of opportunities, such as congregate, accessory, assisted living, supported living, and perhaps, nursing home.
There is one approved housing development for which funds were frozen by the state due to current (2003) budget shortfalls. This project would have contributed 13 units of subsidized family housing and 16 units of elder
Percent of Rented or Owned Units that Are Affordable for Low and Moderate Income Households 0.0% 20.0% 40.0% 60.0% 80.0% 100.0% 120.0% Rental Owned Pe rcent of Un its th at are Aff or dable
Low income Moderate income
Low income 65.6% 57.2% 14.2% 10.2% 10.2% 0.0%
Moderate income 98.8% 98.8% 32.2% 56.7% 56.7% 3.4%
All Under 25 65+ All Under 25 65+
Source: U.S. Census Bureau.
Having identified the need for increased affordable housing stock for low income and elderly households in Southwick, the housing available on the market requires examining. In comparing single-family home sales in Southwick for the year 2000 to the income levels of households in the community over the same period, trends similar to those in the housing stock are established. The median single-family home price was $144,900 and the median mortgage $127,500. Based on median mortgages, median property taxes, and median insurance estimates, calculated median monthly payments are $1,237.
Table Twenty-Three : Survey of the Housing Market Price Mortgage Year Built Rooms Bedrooms Bathrooms Assessed Total
Value
Property
Tax Insurance Estimate
Monthly Payments with Mortgage Lot Size Average $158,1 28 $131,070 1963 9.0 3.0 1.3 $131,331 $2,044 $1,970 $1,386 75613 Median $144,9 00 $127,500 1968 9.0 3.0 1.0 $116,000 $1,805 $1,740 $1,237 30451
Of the 99 single family homes sold in Southwick in 2000, a small percentage were affordable to low income and elderly households. Considering all low-income households, only 8.1% of the homes sold were affordable. No homes sold were affordable to low income elderly households. A greater percentage of the single-family homes sold were affordable to moderate-income households (50.5%). Moderate-income households headed by an individual under 25 were able to afford the same percentage of homes, but moderate-income elderly households were able to afford only 4.0% of the homes sold in 2000.