Regional San 2015 Long Term Financial Plan Page 2
Presented on May 27, 2015 by:
Joseph T. Maestretti, CPAChief Financial Officer
Sacramento Regional County Sanitation District Sacramento Area Sewer District
Sacramento County Sanitation Districts Financing Authority 10060 Goethe Road Sacramento, CA 95827 [email protected] Phone (916) 876-6116 Randy Wolff Accounting Manager
Sacramento Regional County Sanitation District Sacramento Area Sewer District
10060 Goethe Road Sacramento, CA 95827
Regional San 2015 Long Term Financial Plan Page 3
Contents
Introduction ... 4
Highlights ... 5
Purpose of the Long Term Financial Plan ... 6
Mission, Vision, and Other Guiding Principles ... 7
Recommended Action Items for 2015-16 ... 8
Status of Action Items from 2013 and 2014 ... 9
Financial Environment ... 10
The Economy – Financial Markets & Trends ... 10
Critical Issues – Risks and Opportunities ... 13
Ten Year Financial Forecasts... 17
Financial Performance Targets ... 17
Forecast Assumptions ... 18
Capital Funding Projection ... 22
Forecast Results Tables ... 24
Growth Sensitivity Analysis ... 27
A Look Back – How Has the Forecast Changed? ... 29
Debt Management Plan ... 30
Debt Policies and Goals ... 30
Existing Debt ... 31
Strategies for Existing Debt Issues and Swaps... 34
EchoWater Project Financing Plan ... 39
Early Debt Retirement Plan ... 41
Regional San 2015 Long Term Financial Plan Page 4
Introduction
After several years of declining financial position in the wake of the 2008 financial crisis, Regional San is now in excellent financial condition with growing cash balances and improving debt coverage ratios. Previous financial challenges came following a decade of major capital projects totaling approximately $1.4 billion that expanded and improved the District’s
interceptor system to accommodate growth. These projects were funded with $1.058 billion of new debt issued between 2004 and 2006.
On December 9, 2010, the Central Valley Regional Water Quality Control Board issued a new National Pollution Discharge Elimination System (NPDES) wastewater discharge permit for the Sacramento Regional Wastewater Treatment Plant (SRWTP) in Elk Grove, California. The terms of this permit require Regional San to construct and operate advanced wastewater treatment facilities (EchoWater Project). The EchoWater Project will add additional treatment processes to remove ammonia and nitrates, and increase the levels of filtration and disinfection, at the SRWTP. The permit requires these new facilities to be constructed and operational beginning in 2021 for ammonia and nitrate removal, and by 2023 for the other processes. Additional
information concerning the District’s permit and the EchoWater Project can be found on the Regional San website at the following link: http://www.srcsd.com/EchoWaterProject.php. In 2011, to fund early planning efforts related to the EchoWater Project, the Board of Directors approved a three-year rate increase adding $2 per month per equivalent single-family dwelling (ESD) in each of the three fiscal years from 2011-12 through 2013-14. The monthly rates per ESD were increased from $20 to $26. In early 2014, to fund design, construction, and debt service expenses related to the EchoWater Project, Regional San Board approved another three-year rate increase of $3 per month in each of the next three fiscal years. When the final
increase is implemented on July 1, 2016, the monthly service rate per ESD will be $35, a 75% increase from the $20 rate that was in effect in at the beginning of 2011.
Regional San 2015 Long Term Financial Plan Page 5
Highlights
Regional San is in excellent financial condition and is expected to remain so throughout the 10-year forecast period with timely rate increases, even assuming low customer growth and significant new capital and operating costs for the EchoWater Project.
On April 7, 2015, the District’s EchoWater Project was approved for Clean Water State
Revolving Fund (CWSRF) loans of up to $1.576 billion. The loans have an interest rate capped at a maximum of 2.3% which could save about $1 billion when compared with the cost of traditional fixed rate bond financing.
Several more moderate rate and fee increases will be necessary over the first half of the 10-year forecast period to finance the EchoWater Project and the operation of the resulting new treatment processes. The amount of projected rate increase needed has declined from the 2014 forecast that projected a rate of $44 per month per ESD in fiscal year 2022-23, to $39.50 in the current forecast for that year. The improvement is the result of significantly lower financing costs that will result from the CWSRF loans.
The Regional San Board has demonstrated its commitment to funding the EchoWater
Project while improving the financial position and sustainability of the District by approving annual rate increases from 2011 through 2016, which increased monthly service rates from $20, to $35 per ESD.
The District has a debt portfolio with approximately $1.4 billion in revenue bond debt
outstanding as of December 31, 2014. Financing needs for the EchoWater Project will require the District to incur up to $1.576 billion in new debt. Because of the improving financial outlook, Regional San may be able to retire approximately $300 million of higher cost debt early, thereby reducing the need for service rate increases in later years.
In addition to funding the EchoWater Project, this plan makes available approximately $360
million for capital maintenance, rehabilitation, and water recycling projects over the next decade.
Debt restructuring and replacements have generated over $72 million in total cash-flow
savings since 2010, and reduce risk and complexity of the debt portfolio. Action items for 2015-16 could add another $1 million per year in debt service cost savings.
Reserves will be increased for asset replacements, emergencies, general operating
fluctuations, and to meet reserve requirements of new loans. The District currently has approximately $173 million in designated reserves and additional unreserved cash is available to build these reserves to higher levels without putting additional pressure on rates or fees.
Regional San 2015 Long Term Financial Plan Page 6
Purpose of the Long Term Financial Plan
This Long-Term Financial Plan (LTFP) is designed to help focus resources on the issues
influencing the District’s financial position over the next 10 years, and better align its financial capacity with its mission. The plan is designed to identify financial risks and opportunities facing the District over the next 10 years. It also outlines some strategies for meeting those challenges while maximizing opportunities for providing the most value for the District’s ratepayers at the lowest possible cost.
The LTFP includes a set of well-reasoned assumptions that provide a foundation upon which a variety of policies and decisions can be formulated for the annual operating and capital budgets, debt-management program, reserves-management, and other ongoing financial processes. The LTFP includes some specific recommended actions to be considered in 2015, and beyond, to address expected financial challenges and opportunities.
The Planning Process – The LTFP process involves gathering information from District staff related to the long-term operating and capital needs of the District. The planning process includes reviews of various planning documents produced by Regional San, the Sacramento Area Sewer District, and other agencies. The LTFP does not repeat or replace other planning processes or documents but works in conjunction with them. Those plans include review of the Regional San Business Plan, the Capital Funding Projection, EchoWater Project plans, the annual budget, and other planning documents. Research and analysis of economic data and trends affecting the District are also included. The process involves discussions and collaborations with management, staff, legal counsel, and outside financial advisors to determine critical issues and opportunities that the District may face over the next 10 years. Finally, the process culminates in a presentation to the Board of Directors to receive input and guidance on what additional issues should be considered in the future of Regional San.
The LTFP will be updated and brought back to the Board of Directors at least once each year. Any action items outlined in the plan will be brought back to the Board of Directors individually for approval at appropriate times in the future as conditions and opportunities warrant.
Regional San 2015 Long Term Financial Plan Page 7
Mission, Vision, and Other Guiding Principles
The mission of Regional San is “To protect public health and the environment through reliable and safe conveyance, treatment, and disposal of wastewater in the most cost-effective manner possible, now and into the future.” The vision of Regional San is “To ensure adequate infrastructure is available to achieve regional goals now and in the future. Fundamental to the vision is that business decisions will be made in a way that do not place undue financial burden on future generations of ratepayers.”
The goal of the LTFP is to support the District’s mission and provide a long-term sustainable financial foundation for achieving and sustaining the vision into the future.
More specific financial principles, policies, and goals guiding this plan include:
1. Growth pays for growth over the long-term. Sewer impact fees will be set at a level necessary to assure that new connections finance capital costs associated with the additional burden of new customers on the sanitation system.
2. Monthly service rates should be smoothed to avoid spikes and minimize the total
burden on ratepayers. Reserves may be used to smooth rates when prudent.
3. Prudent reserves are to be maintained to mitigate the negative effects of emergencies
and fluctuations in revenues and expenditure levels. Additional prudent reserve levels will be maintained to fund asset replacements, meet debt management needs, and to meet legal or statutory requirements.
4. Required annual maintenance and scheduled asset replacement should not be deferred
to minimize current rates and fees at the expense of future rates and fees.
5. The District should maintain strong bond ratings to instill confidence in investors and ratepayers and to facilitate access to the municipal bond market at lower cost.
6. Use and cost of debt should be minimized to the extent possible. Debt service should
be strategically planned to be as level as possible to minimize the burden on ratepayers and produce predictable rates that avoid significant spikes.
7. Capital projects should be financed on a pay-go (cash) basis to the extent possible, targeting 25 percent cash financing on projects for new facilities, and 100 percent cash financing on rehabilitation and replacement projects.
8. Excess funds due to higher than expected growth, unexpected one-time revenues, and
Regional San 2015 Long Term Financial Plan Page 8
Recommended Action Items for 2015-16
District staff and financial advisors are constantly monitoring and analyzing Regional San’s outstanding debt to take advantage of any opportunities to reduce costs and risks associated with the debt portfolio. This is of particular importance at this time as the District begins another significant capital spending program for the EchoWater Project. Action items designed to reduce costs and risks in the debt portfolio at this time should help to maintain or improve the District’s bond ratings and provide added confidence to investors to ensure successful transactions in the coming years. Any action items that reduce the cost of the existing debt will provide capacity for new debt without a corresponding increase in rates.
Action items represent tentative plans for various debt transactions that the District is working toward. As market conditions and District needs and circumstances change, alternative action items may be added from time to time. Estimated timing of the action items is noted below, but each item will be executed at a time that is determined to provide the best value for the District. Each action item will be brought to the Board of Directors separately for approval at appropriate future dates. These action items are covered in more detail in the Ten Year Financial Forecast and Debt Management sections of this document. The action items proposed for the next 12 months are summarized as follows:
1. Execute the first four CWSRF loan agreements for the EchoWater Project (May, August, and September 2015) – The proceeds of these loans will be used to reimburse Regional San for EchoWater Project construction costs beginning in 2015.
2. Consider buyback of the option on the Series 2000C Swap (July 2015) – The cost of buying back the counterparty’s cancelation option on this swap is currently near historic lows. The District could realize net positive cash flow by buying back the option now. In addition, the buyback would reduce the District’s exposure to higher interest costs in the future and increase its debt management flexibility.
3. Complete liquidation of another 40% of Series 1993 Escrow (December 2015) – This will result in an additional $3.8 million payment to the District for savings realized on the refunding of the Series 2005 Bonds that occurred at the end of 2014. A $4.8 million payment was received for the first 33% of this liquidation that occurred in 2014. 4. Pay off the outstanding Series 2006 Bonds early (May 2016) – A one-time cash
payment of approximately $10.3 million could pay off this debt 20 years early and save over $9 million in debt service payments over the life of the bonds.
Regional San 2015 Long Term Financial Plan Page 9
Status of Action Items from 2013 and 2014
The LTFP from 2013, and the 2014 update, included action items that were completed in 2014 and early 2015. Table 1 below summarizes the status of the eight action items completed:
Table 1
Action Item Status Comments
1. Approve necessary rate increases to fund EchoWater Project
Completed March 2014
Board of Directors approved three annual rate increases of $3/month/ESD to pay for EchoWater Project.
2. Renew Letter of Credit (LOC) on Series 2000C Variable Rate Bonds (New action item not in previous LTFP)
Completed January 2015
Renewed existing LOC with Bank of America with improved terms allowing early termination flexibility and lowered costs by $125,000 per year.
3. Renew Direct Purchase for Series 2012A Variable Rate Bonds (New action item not in previous LTFP)
Completed May 2015
Renewed existing Direct Purchase agreement with Wells Fargo Bank lowering cost by $75,000 per year. 4. Liquidate the Series 1993
Escrow for additional savings. (From 2013 LTFP)
Partially Completed November 2014
New IRS regulations now allow for at least a portion of this liquidation to occur. 33% of escrow was liquidated in Nov. 2014 resulting in a $4.8 million cash payment to Regional San. 5. Restructure the capital lease
on the Bio-solids Recycling Facility (From 2014 LTFP)
Completed November 2014
Synagro refunded their bonds on the facility and the District’s monthly payments were reduced by over $17,000, resulting in $2 million savings over remaining 10 years of the lease. 6. Refund the Series 2005
Bonds (From 2013 LTFP)
Completed November 2014
The Series 2005 Bonds were entirely refunded with the Series 2014B Bonds which resulted in total debt service cost savings of over $4.3 million.
7. Refund the Series 2006 Bonds (From 2013 LTFP)
Completed July 2014
About $280 million of Series 2006 Bonds were refunded by the Series 2014A Bonds resulting in total savings of almost $30 million over next 20 years. 8. Issue the first $150 million of
new bonds for the
EchoWater Project (From 2014 LTFP)
Completed July 2014
The Series 2014A Bonds were issued at a total interest cost of 4.48%,
approximately 1.1% lower than
projected in 2014 resulting in savings of approximately $1.52 million per year.
Regional San 2015 Long Term Financial Plan Page 10
Financial Environment
The Economy – Financial Markets & Trends
Regional, state, national, and global economies and financial markets have a significant impact on Regional San operations and, therefore, have a significant effect on financial strategies and decisions. Because Regional San is an integral part of the Sacramento regional economy, conditions and trends here have a significant influence over the District’s financial outlook, particularly in the area of revenue projections.
The regional economic outlook has the most profound effect on the District’s growth. Customer growth fuels revenue growth from rates by adding permanent ratepayers. In addition, new customers also pay impact fees (connection fees) to cover the cost of added infrastructure necessary to support growth. Table 2 below shows the growth that the District has experienced over the past 10 years as measured by ESDs (as reported in the District’s Comprehensive Annual Financial Reports):
Table 2
: Sacramento Regional County Sanitation District
Growth in Connected Equivalent Single-Family Dwellings (ESD)
2005 2006 2007 2008 2009 2010 2011 2012 2013 2014
Ending ESDs 513,148 525,238 531,467 561,508 567,583 570,424 573,524 577,458 580,727 580,098 New ESDs 11,140 12,090 6,229 30,041* 6,075 2,841 3,100 3,934 3,240 (632) % Change 2.2% 2.4% 1.2% 5.7% 1.1% 0.5% 0.54% 0.69% 0.56% -0.11% * includes the addition of West Sacramento as a new contributing agency in 2007
Regional San management does not believe the fundamentals are in place for the growth rates experienced in the past decade to continue into the next decade. The average annual growth rate for the past ten years was 1.5%. For the past five years the average annual ESD growth has been 0.44%. In 2014, the District experienced its first net loss of ESDs. This net loss was only experienced in the City of Sacramento contributing agency area. All other areas of the District experienced modest gains. The City of Sacramento net decline is mainly attributable to commercial redevelopment, particularly in the downtown area where the new sports arena is being built. ESDs were eliminated with the demolition of old commercial and residential hotel buildings in the downtown area to make way for the new arena. A significant number of ESDs will be added back in the near future as these areas are redeveloped.
Housing markets in the District’s service area saw unprecedented declines in real estate values leading to high levels of foreclosure and short-sale activity between 2009 and 2012. This has resulted in very limited new construction and historically low customer growth for the District
Regional San 2015 Long Term Financial Plan Page 11
since 2010. The good news is that since 2012 the real estate markets in the Sacramento area are showing signs of improvement. The median price of single family residential resales in Sacramento County was $270,000 in February 2015, a nearly 10% increase from February 20141. The assessed valuation of all property in Sacramento County increased by 4% in 20132. This is the first year of increased assessed valuation in Sacramento County since 2009.
Valuations increased in 2014 by 6.4%. This recent rebound still leaves the District’s current ESD growth rate well below the average annual growth rate of 1.6% experienced between 2004 and 2013.
An economic forecast for the Sacramento region produced by University of the Pacific (UOP), Eberhardt School of Business projects an increase in residential construction activity (total housing starts) from 4,342 units in 2013, to 16,518 units in 2018; a 31% increase each year over the next five years3. That would return housing starts in the Sacramento region by 2018 to over three-quarters of the peak level of 21,546 experienced in 2004 (the Regional San service area is only a portion of the Sacramento region used in the UOP forecast).
The Regional San forecast continues to take a more conservative approach to forecasting growth in the regional construction market. Uncertainty driven by high unemployment and continuing challenges in the local, national, and global economies do not appear to support growth assumptions above 1% per year. The Sacramento region has a high concentration of government employers, many of which are facing structural fiscal problems throughout the 10 year forecast horizon. Nine of the region’s top 25 employers are government entities including the top employer, the State of California with about 60,895 full-time equivalent employees4. The fiscal problems facing these governments will continue to weigh heavily on the region’s unemployment rate which is currently at 6.4%. That is below the statewide average of 6.7% and above the national average of 5.5%, as of February 20155. On the positive side,
Sacramento County had the highest rate of employment growth (5.5%) among the 50 largest counties with the most employees between 2012 and 2013, according to the U.S. Census Bureau’s April 23, 2015, news release.
Interest Rates – Market interest rates for all taxable and tax-exempt debt were at all-time lows in 2012, at the beginning of 2013, and again at the beginning of 2015. Though there has been short-term volatility in rates, the trend has been generally declining since the early 1980s. Interest rates have gone from all-time highs in the 1980s to all-time lows in early 2013. Global economic influences coupled with recent inflation trends and government monetary policy decisions suggest this low interest rate environment may continue through 2015, and possibly into 2016.
1Sacramento Bee, March 18, 2015.
http://www.sacbee.com/news/business/real-estate-news/article15260567.html
2Sacramento County Assessors Annual Report 2014
3 California & Metro Forecast-January 2015; University of the Pacific Eberhardt School of Business 4 California State Controller’s Office, February 27, 2015.
Regional San 2015 Long Term Financial Plan Page 12
Low interest rates have both good and bad effects on the financial outlook for Regional San. On the positive side, low interest rates reflect the low inflation rates in the economy, which help control operating costs. Low interest rates also mean Regional San can issue or refund
(refinance) debt at a low cost. This in turn reduces the cost of capital projects and reduces the impact of the capital program on rates and fees.
On the negative side, Regional San is unable to earn a good return on invested cash balances. The District is limited by State law and local policy to investing in securities with maturities of five years or less. Most of the District’s cash reserves are invested in the Sacramento County Pooled Investment Fund as directed by the Sacramento County Treasurer (The Sacramento County Treasurer is the District’s Treasurer as specified in the Master Interagency Agreement that formed the District). The Pool had an average investment maturity of 162 days and an earnings rate of approximately 0.25% in fiscal year ended June 30, 2014. Returns this low are significantly below the rate of inflation which results in a loss of value over time for cash balances held by the District.
Even though interest rates all across the yield curve are near historical lows, the difference between short term and long term rates is particularly wide now. This interest rate relationship creates significant negative arbitrage (negative carry) that must be considered when managing debt. Arbitrage is the difference between the cost of debt (interest expense) and the
investment return that can be earned on unspent proceeds of that debt. When arbitrage is negative, the cost of debt exceeds the return on invested cash balances. This increases the net cost of holding unspent proceeds during construction periods or in reserve funds and reduces the efficiency of any escrow accounts that might be set up for refundings. This relationship also creates a compelling argument for using excess cash balances to pay off callable debt because the interest cost on the debt is substantially higher than the interest that the District can earn on invested cash.
Regional San 2015 Long Term Financial Plan Page 13
Critical Issues – Risks and Opportunities
Regional San management believes that the District has reached a financially stable position after a decade of significant average annual growth in the number of customers in the service area. During this time period the District also experienced significant increases in annual costs resulting from expansion of the interceptor system. Regional San will incur significant costs to plan, design, and construct the EchoWater Project, along with associated increases in operation and maintenance costs that will be on-going. This will result in rate increases in the first six years of the forecast period. Other issues can also impact the District’s financial condition and have a positive or negative impact on future rates and fees. The District maintains cash reserves to mitigate the potential negative impacts of these risks. Issues and risks that could have a significant impact on the financial position of the District and have the potential to occur in the next 10 years are as follows:
1. EchoWater Project – The EchoWater Project is expected to involve over a dozen construction projects, including the three main treatment-process components: ammonia and nitrate removal, filtration, and disinfection. The current estimate of EchoWater Project capital costs range between $1.5 and $2.1 billion, with the most probable cost at approximately $1.8 billion. Additional ongoing operation and maintenance costs for the new facilities are estimated at about $42 million per year when fully operational by fiscal year 2022-23. These cost estimates will continue to be refined throughout the design and construction phases over the next few years. 2. Other regulatory requirement changes – The California Sportfishing Alliance sued the
Central Valley Regional Water Quality Control Board (Regional Board) and won on three issues related the Regional San 2010 discharge permit. This requires the Regional Board to issue an amendment related to those issues and the most concerning to Regional San is potential effects on the current thermal plan exemption. A permit amendment must be issued before July 31, 2015. In addition, the current permit will expire in late 2015 and the District will submit a renewal application for a new permit by mid-2015. While requirements of the next permit (or subsequent future permits) are unknown at this time, regulatory agency concerns over the thermal exemption, and other water quality issues, may result in increased treatment requirements that could increase capital and operating expenses in the future.
3. Legal challenges – Lawsuits and other legal challenges have an ongoing financial impact on the District. In February 2015, the Center for Environmental Science, Accuracy and Reliability filed a lawsuit against Regional San, alleging unauthorized “take” of Delta smelt, a species listed as threatened under the Endangered Species Act. Regional San plans to aggressively contest the legitimacy of the lawsuit.
4. Employee benefit costs – Retirement and health benefit costs for government
Regional San 2015 Long Term Financial Plan Page 14
to continue to increase at high rates until more significant reforms are implemented. Recent labor settlements have labor groups that represent most of the District’s employees picking up a larger share of retirement benefit costs beginning in fiscal year 2014-15. This will reduce the level of cost increases for retirement benefits over the next three years. Fortunately for Regional San, these benefits only represent about 6.5% of the total revenue estimated in the 2015-16 budget.
5. Investment markets – Rising interest rates can benefit the District by providing additional non-operating income from higher returns on invested cash balances. In addition to offsetting rising operational and capital costs for the benefit of all
ratepayers, this type of income can provide resources for maintaining or expanding the Sewer Lifeline Rate Assistance Program for low income ratepayers. Rising interest rates can also have a negative impact on the District by increasing the cost of financing for capital projects. Interest-rate cost assumptions for the new debt to support the
EchoWater Project are now estimated to be less than 2.3% due to the Project qualifying for a CWSRF loan. In the previous LTFP the financing costs were estimated at 6.09% due to the uncertainty of issuing bonds over a 7 year timeframe. The District is still exposed to some interest rate risk related to the $1.4 billion in outstanding bonds that will continue to be serviced until 2045 unless paid off early.
6. Water Recycling – Water resource protection and sustainability in the Sacramento region and the Sacramento-San Joaquin Delta continues to be a critical economic and environmental concern. Regional San continues to promote better use of the regional water resources by its commitment to expanding water recycling programs. With completion of the EchoWater Project, Regional San will be able to produce high quality tertiary treated water that can be used for regional benefits such as agriculture and landscape irrigation, industrial uses, and in-lieu groundwater storage.
Regional San is currently working on a $16.2 million capital project with the Sacramento Power Authority (SPA) and the City of Sacramento to provide recycled water to the SPA cogeneration plant in South Sacramento. The project is expected to be funded with approximately $3.7 million from the State Prop 50 and Prop 84 grants, and $12.5 million from a State Clean Water Revolving Fund low interest loan. This project is currently in design, and construction is scheduled to begin in the fall of 2015, and be completed by early 2017.
Regional San is currently in the planning phase to potentially provide large scale recycled water to a portion of southern Sacramento County. Regional San is pursuing State and federal grants and loans, cost sharing with other agencies, and potential revenue from water sales to help fund the estimated $172 million in capital costs needed for this project. In 2013, using grant funds, Regional San completed a feasibility study that showed water recycling projects can improve regional water sustainability and provide environmental benefits to the Sacramento region. Although the Regional San Board has not yet committed to implementing this project, the applicable capital
Regional San 2015 Long Term Financial Plan Page 15
costs are included in the CFP. However, the estimated operating costs, or potential revenue offsets, are not included in the current forecast.
7. Natural Disaster and Other Emergencies – The potential for natural disasters such as earthquake or flood are issues the District considers in its emergency planning. The risk for earthquakes in the Sacramento Region is relatively small. However, the risk for flood in the region is significant. The District has taken, and will continue to take, measures to protect its critical infrastructure from flood damage. For example, the treatment plant in Elk Grove is surrounded by levees designed to protect from a 400-year storm event. These levees protect the entire process area and critical infrastructure at the treatment plant. In addition, the District is in the process of designing and constructing a levee to protect the South River Pump Station in Yolo County. This is a critical pump station that provides service to the northern portion of Sacramento County and the City of West Sacramento. This levee is expected to be completed in 2016. To further
mitigate these risks, the District maintains cash reserves to cover additional costs that could be incurred during times of emergency to preserve or repair essential
infrastructure.
8. Aging Infrastructure – Regional San has implemented programs to address the condition of the treatment plant and conveyance system assets through repairs, rehabilitations, or replacements to ensure reliable and sustainable wastewater treatment systems are maintained. These programs identify and properly prioritize resources to address aging facilities to reduce overall costs and improve the efficiency and effectiveness of operations. There is also a need for existing plant assets and systems to be brought to an improved condition to efficiently and effectively support the new facilities that will be constructed as part of the EchoWater Project.
For example, the District is in the process of improving the Secondary Sedimentation Tanks (SSTs), which are used to settle out solids in the treatment process. Regional San has 24 SSTs, and due to age, many of the tanks and associated components need rehabilitation. Regional San developed an SST Rehabilitation Strategy that includes condition assessment inspections, rigorous data analysis, and business case evaluations to determine the appropriate repairs, costs, and timing. Work has begun and will continue until all 24 tanks have been rehabilitated.
9. Rate and Fee Study – The implementation phase of the rate and fee study began in late 2012, following the Board of Directors approval of the revised rate and fee structure and modification to several special financial programs. The new structure resulted in the lowering of impact fees in 2013 from $7,450 to $4,304 per ESD for new areas, and from $2,800 to $2,543 per ESD for infill areas of the District. While the new fee structure resulted in lower impact fees, the high capital and operating costs associated with the EchoWater Project will drive both rates and fees higher in the future. Regional San Board has approved the rate and fee increases for the fiscal years, 2014-15 through 2016-17.
Regional San 2015 Long Term Financial Plan Page 16
The rate and fee study has also modified programs that affect rates and fees. Incentives for industrial customers are declining and may ultimately be phased out if interest revenues remain low for several more years. Industrial customers will pay higher rates due to reduced funds available for incentives. The Economic Development Treatment Capacity Bank Program that provided credits for impact fees was restructured in 2013 to minimize revenue loss to the District. The restructured program was implemented by all affected local agencies in early 2014. The value of the credits will be adjusted annually for inflation and ultimately sunset in 2020.
Regional San 2015 Long Term Financial Plan Page 17
Ten Year Financial Forecasts
Financial Performance Targets
One of the primary objectives of the Regional San Board and management is to maintain a financially sound and sustainable wastewater utility capable of delivering the highest quality service at the lowest long-term cost. Some financial benchmarks and performance targets are used to determine and maintain financial health. Those targets include cash balances, annual cash flow needs, and debt coverage ratios. The forecast model is designed to maintain total cash on hand of at least $300 million. Currently the District has approximately 1,200 days of operating cash on hand ($350 million), which is significantly above the industry median of 296 days6. In addition, the forecast model assumes designated reserve levels for specific types of reserves and also must maintain a positive unreserved cash balance. Another target of the forecast model is a senior debt coverage ratio of at least 1.30x, and total debt coverage of at least 1.20x. These targets are above the bond covenant requirements of 1.20x for senior coverage, and 1.10x for total debt coverage.
Regional San 2015 Long Term Financial Plan Page 18
Forecast Assumptions
The 10-year financial forecasts (Tables 3 and 4) are built using the following assumptions: 1. Rate Revenue – Service rate revenues are based on ESD growth conservatively estimated to
remain well below historical levels throughout the 10-year forecast period. Growth for fiscal year 2015-16 is estimated at 2,995 ESDs, or 0.50%. The growth rate is assumed to stay at 0.50% throughout the forecast period. Overall the growth rates are conservative given that the average annual growth rate over the past decade has been about 1.5%.
Industrial rates have been subsidized by non-rate and non-fee revenues to provide
economic incentives to increase and maintain jobs in the Sacramento area. As this type of revenue has declined over the past few years due to low interest earnings on the District’s cash balances, this subsidy will be phased out over the next few years. Industrial rates need to rise about 121% over the fiscal year 2013-14 level to reach the levels that residential and commercial customers pay. To reduce the impact on industrial customers, the increase is proposed to be phased in over several years using up a portion of the economic incentive reserve. This phase-in is shown in the pro-forma forecast as an expense (rebate) that declines each year until it is eliminated in 2021-22.
2. Impact-fee Revenue – The current impact fees in effect since July 1, 2014, are $2,781 for infill areas, and $4,729 for new communities. Impact fee levels will adjust each year by an inflation factor and estimated changes in capital spending throughout the forecast period. ESD growth assumptions used to forecast impact-fee revenue reflects the same slow growth assumptions used to forecast service rate revenue.
3. Non-operating Revenue – The main variable in this revenue category is interest income on invested cash balances. Interest income is projected to stay at the current historically low interest rate level through fiscal year 2015-16, and then increase by 5% each year through the remainder of the forecast period. This projection reflects higher interest income from rising cash balances in the early years of the forecast and predicted higher income from rising interest rates in the later years of the forecast. Interest rates on securities with maturities of five years or less could double from their current levels and still be well below historical averages.
4. Salaries & Benefits – This cost category is projected to increase between 3% and 4% annually through the end of the forecast period. These increases reflect expected cost-of-living adjustments negotiated in labor agreements, and rising retirement and health benefit costs. Those benefits are projected to continue increasing at a rate greater than general inflation. General inflation is estimated to remain near the recent historical range of 2% throughout the projection period.
5. Services & Supplies – This expenditure category is projected to increase 2.5% annually through the end of the forecast period. This is based on historical trends that include general inflation, customer growth, system growth, and increased regulatory requirements.
Regional San 2015 Long Term Financial Plan Page 19
6. Capital Costs – The cost estimates for capital-project expenditures are from the District’s Capital Funding Projection (CFP). In the past the CFP was updated annually and presented separately to the Board of Directors in the fall of each year. Beginning in 2015 the CFP is now included as a section of this Long-term Financial Plan update (see Table 3 for details of the CFP). In the Cash Flow Forecast (Table 5), capital costs are shown on three separate lines, one for costs related to existing infrastructure and water recycling projects and the other two for the new EchoWater Project.
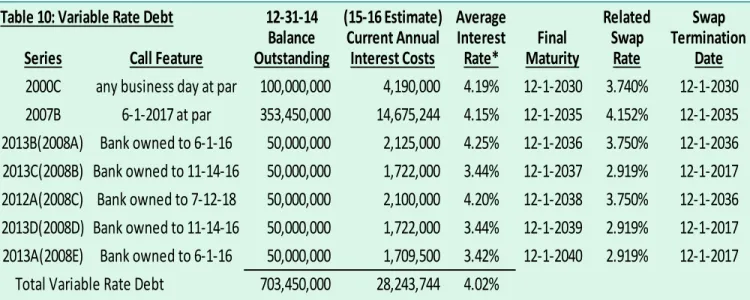
7. Debt Service – Debt service is based on current total outstanding bonded debt of
approximately $1.4 billion as well as projected new debt for the EchoWater Project. Annual level debt service for existing debt is estimated at approximately $91 million per year through 2036, at which point it begins to decline rapidly. The 2015 projection assumes that about $300 million of existing debt will be paid off early which will result in significantly less debt service after 2024-25 than the $91 million noted above for the existing debt.
Estimates of future debt issues over the next seven years to fund the EchoWater Project capital costs are an additional $1.576 billion. This is projected to increase annual debt service by approximately $72 million annually by fiscal year 2023-24 (which could be
partially offset by the early repayment of some of the District’s existing debt). Interest-rate cost assumptions for the new debt to support the EchoWater Project range from 1.6% to 2.3%. Sensitivity analysis on interest rates indicate that a 1% increase or decrease in interest rates on new debt will cost, or save, the District’s ratepayers about $2 per month per ESD.
8. Designated Reserves – In 2005, a reserve policy was approved by the Board of Directors that established the current reserves and the basis for their levels. At the beginning of fiscal year 2014-15 these reserves were designated at a total of $172,812,170, and are projected into the future based on the following needs and assumptions:
General Reserve ($25,861,650) – Covers emergency costs and other unexpected expenditures, such as lawsuit settlements, or to offset temporary fluctuations in revenues. This reserve is currently at its designated target level of 25% of operating expenses net of depreciation. Prior to fiscal year 2013-14 this reserve was targeted at 10% of operating expenses. The new higher level provides more protection from rate increases that might result from short-term cost spikes from emergencies, regulatory changes, or legal settlements.
Facility Replacement Reserve – was created to fund replacement of major system components that are beyond economic maintenance. Prior to fiscal year 2013-14, this reserve was maintained in the District’s Operating Fund, but it is redundant with the Replacement Reserve in the Capital Fund. For fiscal year 2013-14 and beyond this reserve is merged into the Replacement Reserve in the Capital Fund (see “Replacement Reserve”, below).
Regional San 2015 Long Term Financial Plan Page 20
Facilities Closure Reserve ($10,543,592) – is mandated by the State of California to finance closure and post-closure costs of the solids storage basins and the dedicated lined disposal sites at the Sacramento Regional Wastewater Treatment Plant. This reserve is increased as needed to ensure sufficient funding will be available at the time of closure of the facilities as mandated by State law.
Equipment Replacement ($1,000,000) – This reserve was created to replace existing heavy equipment (i.e., tractors, cranes) thereby eliminating the need for debt financing in years when heavy equipment is replaced. This reserve is increased by 2.5% each year after fiscal year 2013-14 to reflect inflation.
Economic Incentive Reserve ($3,500,000) – Provides economic incentive to the industrial community through a rate subsidy program. This reserve may be drawn upon over the next few years as non-rate and fee revenues needed to support the program are declining and priority for use of this type of revenue goes first to the Sewer Lifeline Rate Assistance Program.
Rate Assistance Program ($6,505,000) – This reserve was created to establish an endowment to generate revenue for the Sewer Lifeline Rate Assistance Program. This reserve was reduced from $10 million to $6.505 million in February 2013, to fund the $3.495 million termination payment on the Series 2000A/2001 Swap. This swap was the source of funding for the reserve when it was created in 2004. Terminating the swap allows the District to more effectively invest the remaining reserve to earn more income for the program and eliminated 15 years of swap risk.
Expansion Reserve ($20,908,124) – This reserve was created to fund facility
expansions required by customer growth. It is designed to be used when expansion projects are under construction but impact fees decline due to a sudden slowdown in growth. No changes to this reserve are envisioned for the forecast period.
Replacement Reserve ($75,429,250) – This reserve funds future rehabilitation and replacement of existing facilities and major components when they reach the end of their useful lives. This reserve serves the same function as the Facility Replacement Reserve and has been combined with that reserve after fiscal year 2012-13. The total combined Replacement Reserve will be increased by 2.5% each year during the forecast period to offset the impact of inflation. In addition, this reserve will
increase by an additional $1.1 million each fiscal year from 2020-21 through 2023-24 for the added components of the EchoWater Project that will need to be replaced in the future. This reserve helps avoid issuing debt to replace existing assets.
Debt Service Stabilization Reserve ($5,864,554) – This reserve is available to cover fluctuations in debt service for the District’s variable rate bonds. This reserve would only be used to pay interest expense if a failed remarketing occurred causing a temporary spike in interest expense. Using this reserve at that time would give the
Regional San 2015 Long Term Financial Plan Page 21
District time to restructure the debt. The need for this reserve is mitigated by the recent and continuing diversification of the types and tenor of variable rate debt in the portfolio to reduce remarketing and bank/credit provider risk.
Rate Stabilization Reserve ($23,200,000) – This reserve is available to ensure minimum debt coverage ratios as required by bond agreements are met when revenues decline or operating expenses increase unexpectedly, without requiring an immediate increase in rates. There is no projected need to change the level of this reserve throughout the forecast period.
CWSRF Loan Reserve ($0) – This will be a new reserve beginning in fiscal year 2016-17 as required by the terms of the CWSRF loan that will finance the EchoWater Project. The reserve will be equal to the annual debt service required under the loan agreements beginning at $480,681 in 2016-17, and reaching an estimated maximum of $72 million in fiscal year 2023-24.
Unreserved Cash – The role of unreserved cash is to provide a flexible source of funding to take advantage of opportunities to maximize long-term economic benefits for ratepayers, provide an additional cushion for unexpected expenses or revenue loss, and mitigate any negatives that might be noted by rating agencies. Unreserved cash also provides
policymakers with the
opportunity to consider the early repayment or restructuring of debt for savings, or financing of future capital project
expenditures without the need for additional debt. In this plan unreserved cash is used to fund a portion of the capital cost of the EchoWater Project and pay off older high cost debt early.
Regional San 2015 Long Term Financial Plan Page 22
Capital Funding Projection
In the past, the District reviewed the Capital Improvement Program in the fall of each year and identified the capital project funding needs for the next five years. Beginning in Fiscal Year 2014-15, the District has extended the capital funding projections to cover the next ten years and included it in this new separate section of the LTFP.
Table 3 below lists all of the Regional San capital projects already in progress or projects that are expected to begin within the ten-year projection timeframe. The projects are shown in a summary format and have been updated to reflect the most current cost and timing
information available. Over $2 billion in capital project costs are anticipated between Fiscal Years 2015-16 and 2024-25. The EchoWater Project at approximately $1.7 billion represents about 85% of all capital costs projected over this ten year period.
Approximately $1.576 billion of the EchoWater Project capital costs will be financed by the CWSRF loan program. Another $150 million of the projects planning and design costs are financed by the Series 2014A Bonds that were issued in July 2014, bringing the total financing for the EchoWater Project to $1.726 billion.
Approximately $140 million in water recycling projects are included in the CFP. While a portion of water recycling project costs may be funded from grants or low cost loan programs, the current 10 year projections do not include any grant or loan proceeds for these projects. All
other projects, except EchoWater Project, will be funded with on-going revenues and cash reserves.
Regional San 2015 Long Term Financial Plan Page 23
Table 3: Regional San Capital Funding Projection 2015-2025
(in thousands)Project #/Name Totals 15-16 16-17 17-18 18-19 19-20 20-21 21-22 22-23 23-24 24-25 1-EchoWater Project $1,674,355 $196,001 $207,656 $284,525 $307,705 $275,811 $242,164 $108,893 $35,339 $16,262
2-Information Tech Projects 7,606 2,460 925 700 1,040 400 150 250 1,681
3-Annual Small Interceptor Projects 4,150 350 350 350 350 350 350 350 350 350 1,000
4-Annual Small Plant Projects 7,350 650 650 650 650 650 650 650 650 650 1,500
5-Scour Study Response Projects 9,600 200 400 1,000 2,000 6,000
6-UNWI 1&2 Ground Improvements 500 500
7-SPA Water Recycling Phase 1 12,700 12,700
8-South River PS Flood Protection 12,500 5,000 6,000 1,500
9-ESB-D Liner Replacement 9,000 900 4,050 4,050
10-Boiler Room Rehab 5,200 208 312 2,080 2,600
11-CAA System Rehab, Channel 2,500 500 1,000 1,000
12-CAA System Rehab, Mechanical 5,200 208 312 2,080 2,600
13-Cathodic Protection Rehab 1,167 473 45 200 400 50
14-Construct L-DLD 5 18,500 1,850 8,325 8,325
15-DAFT Rehab 5,750 250 1,000 1,000 2,000 1,500
16-Digester Rehab 8,577 3,397 4,700 480
17-Heavy Equipment Replacements 900 100 100 100 100 100 100 100 100 100
18-I/E Pump Rehab 5,200 52 208 260 1,820 1,820 1,040
19-Odor Control Modifications 3,150 126 189 1,260 1,575
20-RTP I/O Bus Contr. Replacement 5,000 500 750 750 750 750 750 750
21-Secondary Sediment Tank Rehab 19,643 1,048 4,190 1,048 5,238 4,976 3,143
22-Pavement Restoration Projects 2,900 100 100 100 100 500 500 500 500 500
23-Solid Storage Basin Battery 4 75,000 750 3,000 3,750 26,250 26,250 15,000
24-SSB Mixer Replacement 1,200 200 200 200 200 200 200
25-Tunnel Pipe Rehab 520 208 312
26-South County Ag Water Recycle-1 96,000 4,800 4,800 29,000 38,400 19,000
27-South County Ag Water Recycle-2 32,900 3,300 3,300 26,300
28-Gas System Modifications 2,756 1,378 1,378
29-Folsom Interceptor Rehab 5,000 1,667 1,667 1,667
30-Sump 2/2A Reconstruction 3,492 582 582 582 582 582 582
Regional San 2015 Long Term Financial Plan Page 24
Forecast Results Tables
The following two pages contain the ten year financial forecast tables for Regional San as of April 2015. The forecast includes Tables 4 and 5 showing the prior actual year, the current budget year, and ten years of projections to fiscal year 2024-25. Table 4 is a pro-forma statement of operations showing projected total revenues, operating expenditures, and debt coverage ratios. Table 5 shows all projected cash flows, including capital expenditures not included in the pro-forma statement. This table also shows reserve projections.
These tables represent the District’s financial forecast assuming the EchoWater Project facilities will be constructed and operational within the next ten years. These facilities at the current most likely cost estimate level would result in total capital costs of about $1.835 billion, of which approximately $1.726 billion would be debt financed.
The forecast projects the need for a monthly service rate per ESD of $39.50 by fiscal year 2020-21. Projected rate increases for fiscal years beyond 2016-17, as shown in Table 4, have not yet been recommended to the Board of Directors for approval.
Regional San 2015 Long Term Financial Plan Page 25
Table 4: Regional San Pro Forma (Baseline; 0.5% Annual Growth) - As of May 18, 2015 (Total EchoWater Capital Cost = $1.8 Billion)
($000s unless noted otherwise) 2013-14 2014-15 2015-16 2016-17 2017-18 2018-19 2019-20 2020-21 2021-22 2022-23 2023-24 2024-25 Operating Revenues Actual Projected Projected Projected Projected Projected Projected Projected Projected Projected Projected Projected
Total ESDs (adjusted for partials) 596,161 599,027 601,727 604,722 607,731 610,754 613,793 616,847 619,916 623,000 626,100 629,215 Monthly rate per ESD ($) $ 26.00 $ 29.00 $ 32.00 $ 35.00 $ 36.00 $ 37.00 $ 38.00 $ 39.50 $ 39.50 $ 39.50 $ 39.50 $ 39.50 Residential/commercial revenue 186,002 208,461 231,063 253,983 262,540 271,175 279,890 292,385 293,840 295,302 296,771 298,248 Industrial revenue 5,125 7,601 8,387 9,174 9,436 9,698 9,960 10,353 10,353 10,353 10,353 10,353 Total revenue from service charges 191,128 216,062 239,450 263,157 271,975 280,873 289,850 302,738 304,193 305,655 307,124 308,601
ESD Growth Rate 0.55% 0.45% 0.50% 0.50% 0.50% 0.50% 0.50% 0.50% 0.50% 0.50% 0.50% 0.50%
Infill ESDs (60% in 2015) (25% after 2016) 1,703 1,134 1,797 752 756 760 763 767 771 775 779 783 New ESDs (40% in 2015) (75% after 2016) 1,572 1,566 1,198 2,256 2,268 2,279 2,290 2,302 2,313 2,325 2,336 2,348
Infill impact fee/ESD $2,543 $2,781 $2,861 $3,094 $3,450 $3,695 $3,993 $4,265 $4,586 $5,052 $5,393 $5,754
Expansion impact fee/ESD $4,304 $4,729 $4,996 $5,346 $5,973 $6,327 $6,848 $7,237 $7,796 $8,569 $9,032 $9,527 Infill impact fee revenue 4,251 5,636 5,141 2,327 2,608 2,807 3,048 3,272 3,536 3,915 4,200 4,503 Expansion impact fee revenue 3,079 4,081 5,985 12,063 13,545 14,419 15,684 16,658 18,034 19,920 21,101 22,368 Total Impact fee revenue 7,330 9,718 11,127 14,390 16,153 17,226 18,733 19,930 21,570 23,835 25,301 26,871 Subtotal operating revenue 198,458 225,780 250,577 277,547 288,128 298,099 308,582 322,668 325,763 329,490 332,425 335,472 Non-operating revenue (interest, misc rev) 12,879 16,000 15,000 15,750 16,380 17,035 17,546 18,073 18,615 19,173 19,748 20,341
Goethe Building Lease Revenue
Total revenue 211,337 241,780 265,577 293,297 304,508 315,134 326,128 340,741 344,378 348,663 352,174 355,813 Operating expense
Salaries & Benefits 54,218 56,698 58,966 61,177 63,471 65,693 67,992 70,032 72,132 74,296 76,525 78,821 Services & Supplies 46,385 47,047 48,223 49,428 50,664 51,931 53,229 54,560 55,924 57,322 58,755 60,224 Depreciaton/Amortization 47,323 47,363 47,732 48,448 49,417 50,899 53,953 60,428 78,556 98,195 99,766 101,013 Less BRF Savings (176)
Increased operaring expenses for EchoWater 12,438 23,303 32,988 41,017 42,247 43,515 Industrial non-rate/fee rebate 2,317 1,524 998 842 661 453 215
Less depreciation/amortization/landfill (47,323) (47,363) (47,732) (48,448) (49,417) (50,899) (53,953) (60,428) (78,556) (98,195) (99,766) (101,013) Total expense, net of depr. & amort. 100,428 103,744 109,506 112,129 115,133 118,465 134,320 148,347 161,259 172,635 177,527 182,559 Net revenue for coverage test 110,909 138,036 156,072 181,168 189,375 196,669 191,809 192,394 183,119 176,028 174,646 173,254
Debt Coverage
Senior debt service 67,794 67,116 77,547 76,640 80,700 90,964 90,957 92,797 125,858 114,949 133,425 126,265 Total debt service 80,102 80,309 90,740 89,834 91,203 100,095 100,088 99,506 132,567 121,658 140,134 132,974 Senior revenue coverage (must be at least 120%) 1.64 x 2.06 x 2.01 x 2.36 x 2.35 x 2.16 x 2.11 x 2.07 x 1.45 x 1.53 x 1.31 x 1.37 x Total revenue coverage (must be at least 110%) 1.38 x 1.72 x 1.72 x 2.02 x 2.08 x 1.96 x 1.92 x 1.93 x 1.38 x 1.45 x 1.25 x 1.30 x
Regional San 2015 Long Term Financial Plan Page 26
Table 5:
SRCSD Cash Flow Projection - May 18, 2015 Audited
(EchoWater Project Capital Cost = $1.8 Billion) Actuals Projected Projected Projected Projected Projected Projected Projected Projected Projected Projected Projected
(Baseline Growth, 0.5%) FY 2013/14 FY 2014/15 FY 2015/16 FY 2016/17 FY 2017/18 FY 2018/19 FY 2019/20 FY 2020/21 FY 2021/22 FY 2022/23 FY 2023/24 FY 2024/25
Beginning Unrestricted Cash $306,681,308 $289,549,600 $367,405,019 $385,169,653 $330,254,132 $403,654,988 $434,022,198 $503,038,035 $520,714,287 $447,038,658 $413,945,508 $371,360,380 Cash Inflow
Impact Fees 7,329,801 9,717,732 11,126,927 14,390,301 16,152,884 17,226,129 18,732,600 19,929,860 21,569,591 23,834,987 25,300,809 26,871,412 Monthly Service Charges 191,127,721 216,062,396 239,450,478 263,156,917 271,975,417 280,872,773 289,849,555 302,738,472 304,193,162 305,655,089 307,124,289 308,600,799 Interest/Other 14,295,249 16,000,000 15,000,000 15,750,000 16,380,000 17,035,200 17,546,256 18,072,644 18,614,823 19,173,268 19,748,466 20,340,920 Bond/Loan Proceeds - Claimed 5,510,417 116,978,261 190,000,000 200,000,000 280,000,000 300,000,000 270,000,000 235,000,000 105,000,000 30,000,000
Subtotal Cash In $218,263,188 $358,758,389 $455,577,405 $493,297,219 $584,508,301 $615,134,101 $596,128,411 $575,740,976 $449,377,576 $378,663,343 $352,173,564 $355,813,130 Cash Outflow
Operating Expenses 104,294,634 103,744,412 109,505,770 112,129,237 115,133,452 118,465,111 134,319,532 148,346,996 161,258,751 172,635,009 177,527,450 182,559,500 Capital Costs (other than EchoWater) 12,753,141 18,749,260 31,265,249 28,593,119 20,246,606 8,502,206 16,894,006 18,048,273 43,154,267 82,124,667 60,835,210 54,294,800
Capital, EchoWater Project 35,725,662 76,600,000 194,500,931 206,656,430 284,524,788 307,704,653 275,811,049 242,163,756 108,892,848 35,338,814 16,262,018 Capital, EchoWater Pilot Plant 2,519,554 1,500,000 1,500,000 1,000,000
Debt Service Costs (EchoWater Bonds) 6,729,600 6,729,600 6,729,600 6,729,600 6,729,600 6,729,600 6,729,600 6,729,600 6,729,600 6,729,600 6,729,600 Debt Service Costs (EchoWater CWSRF Loan) 480,681 4,542,253 14,669,936 14,669,936 16,531,176 49,603,215 49,603,215 72,142,594 72,142,594
Debt Service Costs (Existing Bond Debt) 80,101,906 73,579,698 84,010,490 82,623,673 79,930,746 78,695,385 78,688,451 76,244,923 76,234,523 65,325,189 61,261,820 54,101,742 Early Pay-off of Existing Debt 10,300,730 110,000,000 50,000,000 50,000,000 77,180,000
Subtotal Cash Out $235,394,897 $280,902,970 $437,812,770 $548,212,740 $511,107,445 $584,766,891 $527,112,574 $558,064,724 $523,053,204 $411,756,494 $394,758,692 $369,828,236 Ending Unrestricted Cash $289,549,600 $367,405,019 $385,169,653 $330,254,132 $403,654,988 $434,022,198 $503,038,035 $520,714,287 $447,038,658 $413,945,508 $371,360,380 $357,345,274
New Debt Issuance (Total = $1.727 Billion) $150,000,000 $11,381,965 $96,173,212 $233,789,527 $40,015,742 $711,032,393 $484,585,422
Unreserved Cash $116,737,430 $193,232,849 $208,931,960 $150,928,135 $217,502,159 $234,851,123 $297,794,265 $309,705,148 $196,386,179 $157,022,017 $87,161,780 $68,288,226 Designated Reserves General 25,861,650 27,221,650 27,376,443 28,032,309 28,783,363 29,616,278 33,579,883 37,086,749 40,314,688 43,158,752 44,381,863 45,639,875 Facility Replacement Rate Stabilization 23,200,000 23,200,000 23,200,000 23,200,000 23,200,000 23,200,000 23,200,000 23,200,000 23,200,000 23,200,000 23,200,000 23,200,000 CWSRF Loan Reserve 473,936 4,542,253 14,669,936 14,669,936 16,531,176 49,603,215 49,603,215 72,142,594 72,142,594 Facilities Closure 10,543,592 10,543,592 10,543,592 10,543,592 10,543,592 10,543,592 10,543,592 10,543,592 10,543,592 10,543,592 10,543,592 10,543,592 Equipment Replacement 1,000,000 1,000,000 1,025,000 1,050,625 1,076,891 1,103,813 1,131,408 1,159,693 1,188,686 1,218,403 1,248,863 1,280,085 Economic Incentive 3,500,000 3,500,000 3,500,000 3,500,000 3,500,000 3,500,000 3,500,000 3,500,000 3,500,000 3,500,000 3,500,000 3,500,000 Rate Assistant Program 6,505,000 6,505,000 6,505,000 6,505,000 6,505,000 6,505,000 6,505,000 6,505,000 6,505,000 6,505,000 6,505,000 6,505,000 Expansion 20,908,124 20,908,124 20,908,124 20,908,124 20,908,124 20,908,124 20,908,124 20,908,124 20,908,124 20,908,124 20,908,124 20,908,124 Replacement & Rehabilitation 75,429,250 75,429,250 77,314,981 79,247,856 81,229,052 83,259,778 85,341,273 88,574,805 91,889,175 95,286,404 98,768,564 102,337,778 Debt Service Stabilization 5,864,554 5,864,554 5,864,554 5,864,554 5,864,554 5,864,554 5,864,554 3,000,000 3,000,000 3,000,000 3,000,000 3,000,000 Total Designated Reserves $172,812,170 $174,172,170 $176,237,694 $179,325,996 $186,152,829 $199,171,075 $205,243,770 $211,009,139 $250,652,479 $256,923,490 $284,198,600 $289,057,048
---Regional San 2015 Long Term Financial Plan Page 27
Growth Sensitivity Analysis
The financial forecast as noted above is based on conservative ESD growth assumptions that do not exceed 0.5% each year. The long-term growth rate experienced by the District exceeds 1% (1.5% for the past ten years). The conditions for growth continue to exist throughout the District’s service area. The main underlying conditions for this growth are land available for development and a growing population. The amount of growth that occurs in the short term can vary widely as was experienced in the past decade. ESD growth for the District varied from a high of 5.7% in 2008, to a low of -0.11% in 2014. This is due to economic factors affecting employment, government and consumer spending, and construction in the Sacramento region. One fundamental growth factor that has remained relatively constant is population growth. Population growth in the Sacramento area has not dipped below 0.9%, even in the lowest
growth years between 2009 and 20127. Population in the Sacramento area is projected to
continue growing above 1% per year for the foreseeable future.
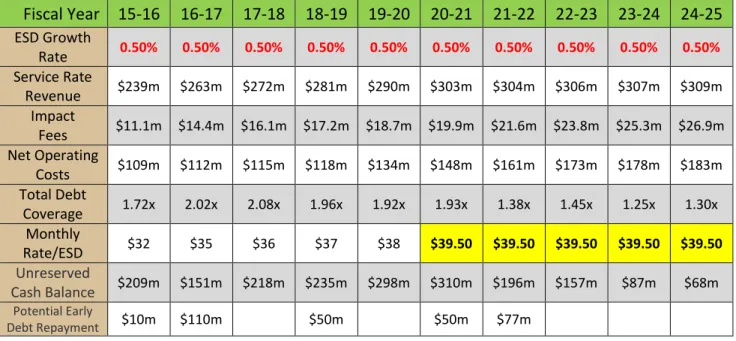
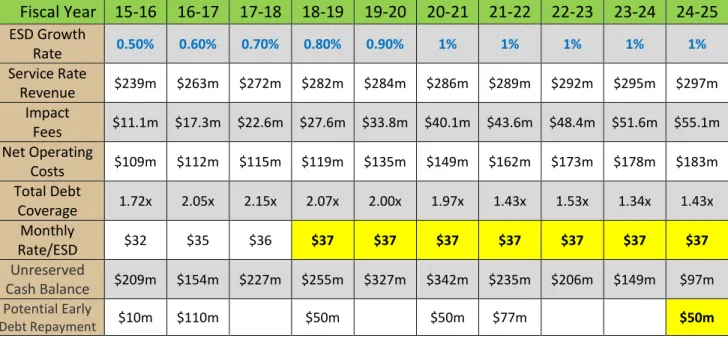
Table 6 below summarizes the results from the baseline forecast from Tables 4 and 5 above. Table 7, on the next page, shows summary forecast metrics that would be expected with a growth rate increasing from current levels to 1% by fiscal year 2020-21, then staying level at 1%. This is still a relatively conservative growth assumption when compared with historical growth rates in the Sacramento area and population projections for the future.
Table 6:
Baseline 0.5% Growth Metrics Summary
Fiscal Year 15-16 16-17 17-18 18-19 19-20 20-21 21-22 22-23 23-24 24-25 ESD Growth Rate 0.50% 0.50% 0.50% 0.50% 0.50% 0.50% 0.50% 0.50% 0.50% 0.50% Service Rate Revenue $239m $263m $272m $281m $290m $303m $304m $306m $307m $309m Impact Fees $11.1m $14.4m $16.1m $17.2m $18.7m $19.9m $21.6m $23.8m $25.3m $26.9m Net Operating Costs $109m $112m $115m $118m $134m $148m $161m $173m $178m $183m Total Debt Coverage 1.72x 2.02x 2.08x 1.96x 1.92x 1.93x 1.38x 1.45x 1.25x 1.30x Monthly Rate/ESD $32 $35 $36 $37 $38 $39.50 $39.50 $39.50 $39.50 $39.50 Unreserved Cash Balance $209m $151m $218m $235m $298m $310m $196m $157m $87m $68m Potential Early Debt Repayment $10m $110m $50m $50m $77m
7California & Metro Forecast-January 2015; University of the Pacific Eberhardt School of Business, Business
Regional San 2015 Long Term Financial Plan Page 28
Table 7:
1% Growth Metrics Summary
Fiscal Year 15-16 16-17 17-18 18-19 19-20 20-21 21-22 22-23 23-24 24-25 ESD Growth Rate 0.50% 0.60% 0.70% 0.80% 0.90% 1% 1% 1% 1% 1% Service Rate Revenue $239m $263m $272m $282m $284m $286m $289m $292m $295m $297m Impact Fees $11.1m $17.3m $22.6m $27.6m $33.8m $40.1m $43.6m $48.4m $51.6m $55.1m Net Operating Costs $109m $112m $115m $119m $135m $149m $162m $173m $178m $183m Total Debt Coverage 1.72x 2.05x 2.15x 2.07x 2.00x 1.97x 1.43x 1.53x 1.34x 1.43x Monthly Rate/ESD $32 $35 $36 $37 $37 $37 $37 $37 $37 $37 Unreserved Cash Balance $209m $154m $227m $255m $327m $342m $235m $206m $149m $97m Potential Early Debt Repayment $10m $110m $50m $50m $77m $50m
Under the baseline forecast (Table 6), the District would need to increase monthly service rates from the approved level of $35 per ESD in fiscal year 2016-17, to $39.50 by fiscal year 2021-22. The rates are projected to remain flat through the remainder of the forecast period. Under the baseline scenario, rates are projected to rise at an average annual rate of about 4.6% between 2011, when the new permit was issued, and the end of the forecast period in 2025. These rate increases are driven mostly by rising capital cost, debt service, and operating costs required by the EchoWater Project. Under a 1% growth scenario (Table 7), the District would not need to increase monthly service rates as much and rates would level out at $37 per ESD by fiscal year 2018-19, and remain flat for the remainder of the forecast period. Under this scenario, rates would rise at an annual rate of 4.2% between 2011 and the end of the forecast period. In addition, more debt could be retired early with a 1% growth rate because more revenue would be collected from impact fees from new connections. This could allow Regional San to keep monthly service rates flat for a longer period of time.
Regional San 2015 Long Term Financial Plan Page 29
A Look Back – How Has The Forecast Changed?
The financial projections have improved significantly since the 2014 LTFP was presented in February 2014. Most of the improvement is the result of lower financing costs due to approval of the CWSRF loan to cover most of the EchoWater Project capital costs, and the issuance of the Series 2014A Bonds at an annual debt service cost of 4.4% as opposed to the 5.50% estimated in the 2014 projection. As a result of these improvements the District projects that it will be able to pay-off some of the older high cost debt to realize more savings in the near future. These additional debt service savings could allow the District to keep rates level for several years after completion of the EchoWater Project. The table below illustrates key projection attribute improvements from the 2014 plan to the 2015 update:
Table 8:
Financial Outlook Improvement 2014 to 2015
Attribute 2014 Plan 2015 Plan Change
Early Debt Retirement $0 $298 million $298 million (100%) Total debt service cost FY 24-25 $154.6 million $133 million $21.6 million (14%) Outstanding Total Debt 2025 $2.206 billion $2.190 billion $16 million (1%)
Average cost of all debt 5.1% 3.2% 1.9% (37%)
Total debt coverage in FY 22-23 1.32x 1.45x .13x (10%) Total cash balance in FY 22-23 $250 million $414 million $164 million (66%) Total 10-year CFP Capital Cost $1.775 billion $2.038 billion $263 million (15%) Monthly Rate/ESD in FY 22-23 $44.00 $39.50 $4.50 (14%)