Multiple instance learning for computer aided detection and diagnosis
of gastric cancer with dual-energy CT imaging
Chao Li
a, Cen Shi
b, Huan Zhang
b, Yazhu Chen
a, Su Zhang
a,⇑ aDepartment of Biomedical Engineering, School of Biomedical Engineering, Shanghai Jiao Tong University, Shanghai, China b
Department of Radiology, Ruijin Hospital, Shanghai Jiao Tong University School of Medicine, Shanghai 200025, China
a r t i c l e i n f o
Article history:Received 18 May 2015 Revised 27 July 2015 Accepted 14 August 2015 Available online 28 August 2015 Keywords:
Multiple instance learning Computer aided diagnosis Circular Gabor features Dual-energy CT Gastric cancer
a b s t r a c t
Multiple instance learning algorithms have been increasingly utilized in computer aided detection and diagnosis field. In this study, we propose a novel multiple instance learning method for the identification of tumor invasion depth of gastric cancer with dual-energy CT imaging. In the proposed scheme, two level features, bag-level features and instance-level features are extracted for subsequent processing and classification work. For instance-level features, there is some ambiguity in assigning labels to selected patches. An improved Citation-KNN method is presented to solve this problem. Compared with benchmarking state-of-the-art multiple instance learning algorithms using the same clinical dataset, the proposed algorithm can achieve improved results. The experimental evaluation is performed using leave-one-out cross validation with the total accuracy of 0.7692. The proposed multiple instance learning algorithm serves as an alternative method for computer aided diagnosis and identification of tumor invasion depth of gastric cancer with dual-energy CT imaging techniques.
Ó2015 Elsevier Inc. All rights reserved.
1. Introduction
Gastric cancer, or stomach cancer is among the most common cancers in the world, with more than 951,000 new cases diagnosed in 2012 (7% of the total). Stomach cancer incidence rates are the highest in Eastern Asia. With aggressively developing diagnostic imaging equipment and treatments, the mortality rate of gastric cancer provided by the World Health Organization (WHO) [1] was declined significantly in countries all over the world[2]. The early detection and early treatment of gastric cancer contribute a lot to the drop in morbidity and mortality. Developing accurate and efficient screening programs is of great help to further improve the survival rate and prognosis of the patients. Surgery is the fundamental curative option for gastric cancer patients. The correlation between radiology exams and pathology is crucial for appropriate treatment planning[3].
Traditional lesion assessment imaging techniques include mul-tiple detector computed tomography (MDCT), magnetic resonance imaging (MRI), Endoscopic ultrasonography (EUS). Various
imag-ing modalities for preoperative stagimag-ing of invasion depth have been abundantly investigated. Conventional endoscopy was found to provide reliable accuracy for T staging of early gastric cancer (EGC) and may be an effective method for assessing penetration depth[4]. EUS is currently the most reliable nonsurgical method available for evaluating the primary tumor [5,6]. Hwang et al. showed the performance of preoperative accessing T and N staging with MDCT was similar with EUS[7,8]. Joo et al. compared the diagnostic performance of 3T MRI with diffusion-weighted imag-ing (DWI) and MDCT for the preoperative tumor, node, metastasis (TNM) staging of gastric cancer, and concluded that the diagnostic accuracy of 3T MRI is comparable to that of MDCT for the preoper-ative TNM staging[9].
Recent advances in dual-energy CT scanner technologies make dual-energy CT systems available for routine clinical use. A fast-kVp (kilovolts peak) switching dual-energy CT imaging method, where kVp is rapidly switched between low- and high-kVp in adja-cent views, has readja-cently been proposed[10,11]. Dual-energy spec-tral CT can provide material density images, which depict how much of each material would be needed to produce the observed low and high kVp attenuation measurements[12]. For instance, water and iodine are the low and high attenuating materials, often selected as the basis pair. Monochromatic images may be synthe-sized from the material density images, which describe how the imaged object would look under an assumed single energy from the X-ray source[13]. This technique provides more quantitative
http://dx.doi.org/10.1016/j.jbi.2015.08.017 1532-0464/Ó2015 Elsevier Inc. All rights reserved.
⇑Corresponding author at: Room 123, Med-X Research Institute, Shanghai Jiao Tong University, No. 1954 Huashan Road, Xuhui District, Shanghai, China. Tel.: +86 13621606436; fax: +86 021 62932156.
E-mail addresses:[email protected](C. Li),[email protected](C. Shi), [email protected](H. Zhang),[email protected](Y. Chen),suzhang@sjtu. edu.cn(S. Zhang).
Contents lists available atScienceDirect
Journal of Biomedical Informatics
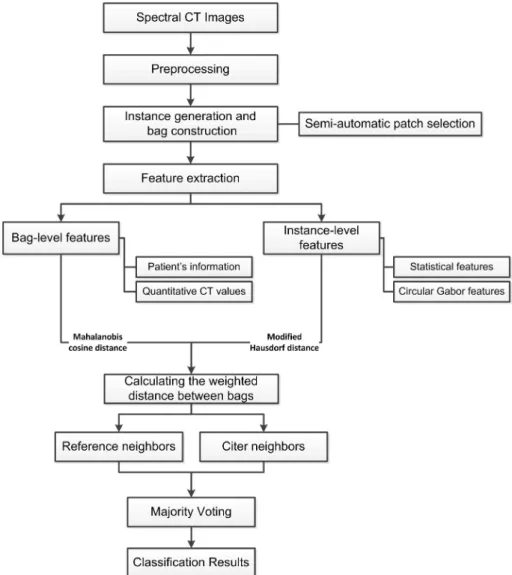
Fig. 1.The flowchart of the multiple instance learning based CAD system
information, which is difficult for radiologists to make full advantage of the obtained data. Lin et al. [14] assessed dual-energy spectral CT imaging of insulinoma in comparison with conventional MDCT, and demonstrated that the combination of monochromatic image and iodine density image can improve the diagnostic sensitivity of insulinoma. Pan et al.[15]evaluated the clinical utility of dual-energy spectral CT (DEsCT) in staging and characterizing gastric cancers and concluded that monochromatic images may be used to improve theNstaging accuracy for gastric cancers, and the quantitative iodine concentration measurements from the material-decomposition images may be helpful for
Fig. 4.Selected patches (instances)
Table 1
Extracted bag-level features of each bag Feature Name Description 1 Age Patient’s information 2 Gender Patient’s information 3 Cardia (thickness) Gastric wall thickness in cardia 4 Gastric body
(thickness)
Gastric wall thickness in gastric body 5 Antrum (thickness) Gastric wall thickness in antrum 6 Location Lesion location
7 Long axis Lesion size 8 Short axis Lesion size 9–19 Quantitative CT
values
Monochromatic (40–140 keV), Bag-level feature
20–21 Material densities Iodine-Water basis pair, Bag-level feature
Table 2
Extracted features of each instance
Feature Name Description
1 Mean intensity Mean intensity of the extracted patch 2 Maximum intensity Maximum intensity of the extracted
patch
3 Minimum intensity Minimum intensity of the extracted patch
4 Skewness A measure of the asymmetry of the data probability distribution 5 Kurtosis A measure of the peakedness of the
data probability distribution 6–895 Circular Gabor features
differentiating between different types of carcinoma. These studies indicate the effectiveness of information provided by DEsCT.
Computer aided detection and diagnosis (CAD)[16] has been extensively studied and applied in the detection of various abnor-malities in medical images. Many machine learning and pattern recognition algorithms, such as Artificial Neural Network [17], Boosting[18], support vector machine (SVM)[19]have been devel-oped and successfully applied to analysis of medical images obtained from various imaging modalities. Fung et al.[20]pointed out that many CAD problems can be best modelled as a multiple-instance learning (MIL) problem. Compared to supervised learning algorithms, MIL algorithms greatly reduced the image annotation work for experts and radiologists [21]. MIL-based CAD schemes have been proposed in many applications, such as cardiac event prediction [22], detection of tuberculosis on chest radiographs [23], and dementia in brain MRI[24]. To the best of our knowledge, however, there is few study discussed CAD system for determina-tion of tumor invasion depth of gastric cancer. In our earlier study [25], we proposed a CAD system used to analyze additional quantitative information provided by dual-energy CT without the combination of intensity and texture information of the images. In this paper, a general framework for semi-automatically detect-ing gastric tumor lesions and identifydetect-ing the tumor invasion depth in dual-energy spectral CT images is presented. A novel MIL algorithm was therefore proposed to deal with this problem.
The arrangement of this paper is as follows. Section 2 intro-duces the related works. Section3describes the instance genera-tion in the pre-processing step and discusses extracgenera-tion of the
features using circular Gabor filters and bag-level features in the dual-energy CT images. An improved Citation-KNN algorithm is discussed in Section 4. In Section5, we show the experimental results of the proposed CAD scheme. The results are discussed in Section6and finally, the paper concludes in Section7.
2. Review of MIL algorithms
In 1997, Dietterich et al. [26] created the multiple instance learning concept for dealing with drug activity prediction prob-lems, and described axis-parallel rectangles (APR) learning based algorithms to solve the problems. The basic idea of MIL is that instead of assigning a label for each training instance (sample), some of the training samples wrap in a group called bag and asso-ciates a label with each bag. Each bag is called positive if at least one sample in it should be positive, and each bag is labeled nega-tive when all samples in it are neganega-tive. The main advantage of MIL problem is that less effort is required to build such datasets. Many MIL algorithms have been proposed by researchers, such as Diverse Density (DD), EM-DD[27], MI-SVM and mi-SVM[28], and MILES [29]. Wang et al. [30] present two variants of the K-nearest neighbor algorithm, Bayesian-KNN and Citation-KNN, solving the multiple instance problem. Fung et al. [20] and Krishnapuram et al. [31]first employed the MIL algorithms in computer aided diagnosis. Zhu et al.[32]modeled lung cancer image classification as a multi-class multi-instance learning problem. This scheme first extracted the features for cells in all images as bags, and then transformed each bag into a new bag feature space by computing
the Hausdorff distance in all of the bags. Finally, the AdaBoost algo-rithm was used to select the bag features and two-level classifiers were built to solve the multi-class classification problem. Quellec et al.[33] proposed a multiple-instance learning framework for diabetic retinopathy screening. Tong et al. [24] proposed using MIL methods for the detection of Alzheimer’s disease (AD) and its prodromal stage mild cognitive impairment (MCI). Xu et al. [34]proposed method named multiple clustered instance learning (MCIL) for histopathology image segmentation and classification.
To our knowledge, existing MIL algorithms only utilized instance level features for the classification. However, in some practical problems, useful features are also extracted in bag-level, which may be neglected with traditional MIL algorithms. There-fore, we proposed an improved MIL algorithm to deal with this scenario.
3. Material and methods
3.1. DEsCT datasets
This is a retrospective study. The dual-energy CT images were acquired using the GE Discovery CT750 HD scanner (Discovery CT750 HD; GE Healthcare, Milwaukee, WI, USA). Total 26 patients with gastric cancer invaded either mucosa layer or serosa layer were collected from the clinical database.
3.2. Pre-processing and feature extraction
An overview of the proposed MIL based CAD framework is illustrated in Fig. 1. The collected images are first preprocessed
and then instances were generated using semi-automatic methods. Thirdly, features extracted from the images were denoted as the bag-level features and instance-level features. Finally, an improved MIL algorithm was proposed in the following section.
3.2.1. Instance generation
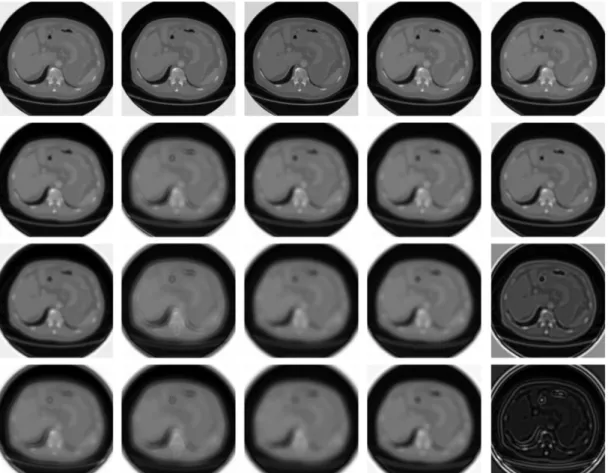
In the proposed scheme, each image is regarded as a bag and patches extracted from each image are regarded as instances. The patches were selected semi-automatically by experimenters. Cui et al.[35]pointed out in their study that 70 keV monochromatic images (as shown in Fig. 2) which usually yield significantly greater tissue-to-fat contrast to noise ratio (CNR) and lower noise. A simple way to extractSpatches is to randomly select patches from the image. However, this cannot guarantee that there are pos-itive patches in pospos-itive bags and is not optimal for the extraction of patches. Therefore, due to the tissue complexity of the cross sec-tional images, we selectSinitial seed points in both the suspected and normal region in the gastric wall which can guarantee that there are positive patches on positive bags (as shown inFigs. 3 and 4). Moreover, special knowledge is not required for selection and the experimenters could easily be trained to do this. Compare with automatic methods, this semi-automatic patch generation procedure avoids the inference of similar intensity regions of other tissue and greatly reduces the computational complexity as well. We aim to extract patches with high discriminative power for classification.
3.2.2. Feature extraction
3.2.2.1. Bag-level feature. Two experienced radiologists, with 3 and 15 years of experience in abdominal imaging, respectively,
reviewed 26 sets of images retrospectively. The radiologists recorded the location, maximal cross-sectional dimension (long axis), minimal cross-sectional dimension (short axis), and morpho-logical characteristics (e.g., nodule and calcification) of each gastric lesion. These features were categorized as statistical features. For each patient, elliptical regions of interest (ROIs) that encompassed the tumor were placed on the selected monochromatic image, and an Excel file containing monochromatic CT values (Hu) at different energy levels ranging from 40 keV to 140 keV (at 10 keV incre-ment), iodine and water material density measurements (mg/ml), and Effective-Zvalues were created. The quantitative information recorded here is categorized as spectral CT features. The quantita-tive information recorded here is categorized as spectral CT features. These patients’ information (statistical features) and quantitative CT values constitute the bag-level features. All these features mentioned above are listed inTable 1.
3.2.2.2. Instance-level feature.Instance-level features are composed of image statistical information, spatial information and texture information extracted by various descriptors. The selected patches are extracted from the original images and their corresponding cir-cular Gabor bank filtered images and regarded as instance-level features. The features are tabulated inTable 2.
Effective and efficient texture feature extraction is critical for the classification and prediction work. Circular Gabor filter (CGF) is a modified version of traditional Gabor filter, which has been successfully used for invariant texture extraction [36]. In our specific application, the tumor lesion appears in different locations of the gastric wall, thus the texture information is invariant. The circular Gabor filter can be written as
cGðx;y;F;
r
Þ ¼ 1 2pr
2exp x2þy2 2r
2 exp 2np
iFpffiffiffiffiffiffiffiffiffiffiffiffiffiffiffix2þy2o ð1Þ whereFis the central frequency of the circular Gabor filter.The frequency domain representation of the circular Gabor filter is given by Fðu;
v
Þ ¼ ffiffiffiffiffiffiffi 2p
p 2a
exp ffiffiffiffiffiffiffiffiffiffiffiffiffiffiffiffi u2þv
2 p F 2 2a
2 ( ) ð2Þ wherea
= 1/2pr
.There are two parameters, central frequency F and standard deviation
r
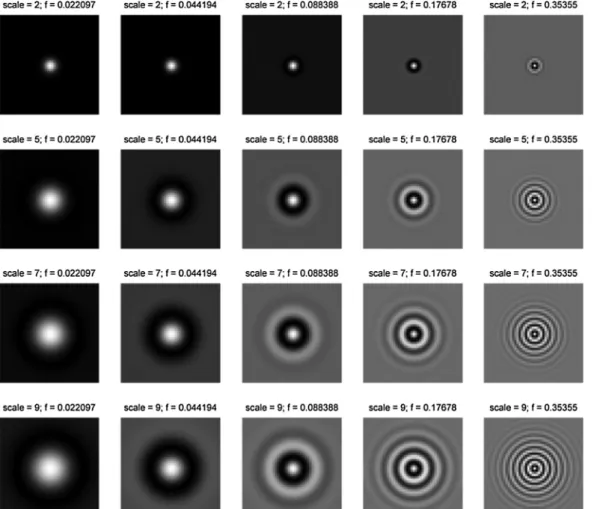
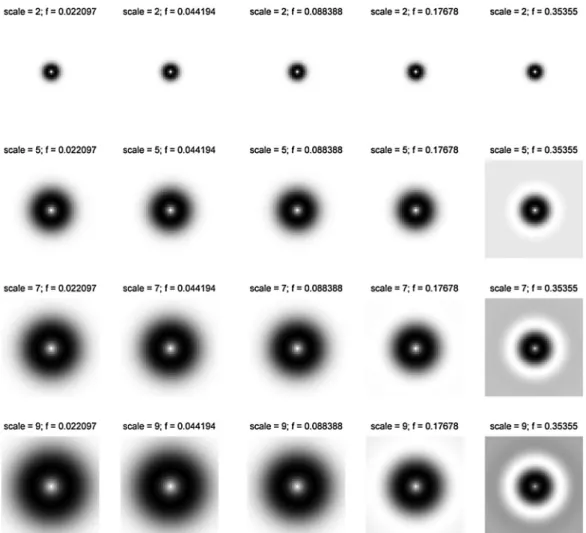
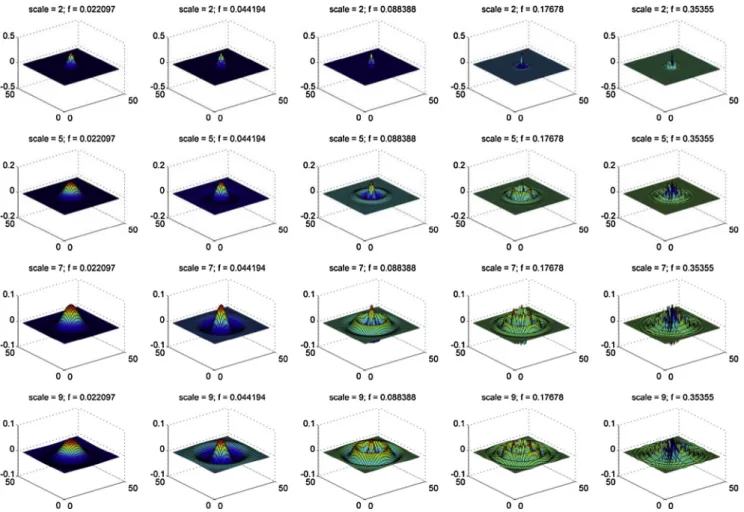
for circular Gabor filter, which are needed to be specified. It is a lot easier compared with the design of traditional Gabor filters. Various combinations of the two parameters produce a set of circular Gabor filters. The parameters are chosen according to Jain’s method[37].Figs. 5 and 6show the 2-D views of the real and imaginary part of the circular Gabor filter bank at 4 scales, 5 frequencies. Figs. 7 and 8 are the 3-D views of Figs. 5 and 6, respectively.For a circular Gabor filter, F and
r
satisfy the following condi-tion that is controlled by the bandwidthBof the Gabor filter[37].F2 ffiffiffi 2 p 1;2;4;8;. . .;N=22 n o N ð3Þ F
r
¼kð2 Bþ1Þ ð2B1Þ ð4Þ wherek¼pffiffiffiffiffiffiffiffi2 ln 22p , and the bandwidth are selected to be 1 octave, that isB= 1. Thus we have
F
r
¼3k ð5Þ Zhang et al.[38]pointed out that this parameter setting of the circular Gabor filter may result in very good texture representa-tion. The texture features are calculated from the corresponding filtered image as follows:/ðx;yÞ ¼rðx;yÞ mðx;yÞ ð6Þ
wherer(x,y) is the response of the filtered image at different spatial frequencies.represents convolution andm(x,y) is the mask used to localize the region to obtain texture measurement. The mask windows with small size produce finer texture information, while mask windows with large size produce coarse but reliable texture measurements.
4. Multiple instance classification
Two types of features are extracted from dual-energy CT images, bag-level features and instance-level features. Traditional MIL classification algorithms only learn and classify features on the instance level. To tackle this problem, we improved the Citation-KNN algorithm by calculating the distance between bags contributed by bag-level and instance-level features.
The Citation-KNN algorithm adapts classical supervised KNN algorithm to the multiple-instance problem. Citation-KNN intro-duces the concept of citation from library and information science field. The notion of citation is to take not only into account the neighbors of a bagXbut also the bags that countXas a neighbor. KNN algorithm only takes into account theKnearest neighbors of a bag X. Actually, we could use both references and citers of an unseen example to predict the class of the example rather than only use the references. Therefore, the parameter Kis replaced
by two parameters R and C as R-nearest references and the C -nearest citers for solving the multiple instances learning problems. The Mahalanobis cosine distance and modified Hausdorff dis-tance are used for the measurement of bag-level disdis-tance and instance-level distance respectively. Firstly, for the bag-level distance, we intend to measure the similarity between the two vectors. Mahalanobis distance and cosine distance are both com-monly used similarity measures. Mahalanobis distance is unitless and scale-invariant, and takes into account the correlations of the data set. Cosine similarity is a measure of similarity between two vectors of an inner product space that measures the cosine of the angle between them, and thus it is a judgment of orientation and not magnitude. Mahalanobis Cosine is the cosine of the angle between the images after they have been projected into the recog-nition space and have been further normalized by the variance estimates. Mahalanobis Cosine obtains the best performance in the CSU Face Identification Evaluation System among previous measures. We have tested all the three measures in our experi-ment and the Mahalanobis cosine outperforms the other two which we didn’t mention in our experiment. Secondly, Wang et al.[30]pointed out that the Hausdorff distance is very sensitive to even a single outlying point. This modified version of Hausdorff distance is given by taking thekth ranked distance rather than the maximum, or the largest ranked one and therefore increase the robustness of this distance. And the Citation-KNN algorithm is pro-posed by using this modified Hausdorff distance as a basis for adapting KNN to the multiple-instance problem. So we retain the modified Hausdorff distance in our proposed improved Citation-KNN algorithm.
Given the bagX¼fx1;. . .xi;. . .xmgandY¼ y1;. . .yi;. . .yp
,xi
andyiare the corresponding instances of the bagXandY. X !
and
Y !
are the bag-level feature vectors of corresponding bags, and~xi,~yj
denote the instance-level feature vectors of bag X and Y, respectively.
The cosine distance of bagXand bagYcan be calculated by the following formula, similarity¼cosðhÞ ¼ X ! !Y k!XkkY!k¼ Pn i¼1XiYi ffiffiffiffiffiffiffiffiffiffiffiffiffiffiffiffiffiffiffiffiffi Pn i¼1ðXiÞ2 q ffiffiffiffiffiffiffiffiffiffiffiffiffiffiffiffiffiffiffiffiffiPn i¼1ðYiÞ2 q ð7Þ
Mahalanobis distance is calculated by dðX!;!YÞ ¼
ffiffiffiffiffiffiffiffiffiffiffiffiffiffiffiffiffiffiffiffiffiffiffiffiffiffiffiffiffiffiffiffiffiffiffiffiffiffiffiffiffiffiffiffiffiffiffi
ðX!!YÞTS1ð!X!YÞ
r
ð8Þ whereS1is the covariance matrix of!X and!Y.
The bag-level features contributed distance is calculated using Mahalanobis cosine distance,
Mahcosdist¼ X
! S1!YT ffiffiffiffiffiffiffiffiffiffiffiffiffiffiffiffiffiffiffi X ! S1!XT q ffiffiffiffiffiffiffiffiffiffiffiffiffiffiffiffiffiffiffi Y ! S1!YT q ð9Þ
whereS1is the covariance matrix.
The instance-level features contributed distances are calculated using modified Hausdorff distance here we employ the minimal Hausdorff distance[30] DðX;YÞ ¼min 16i6n 16j6m ðDistðxi;yjÞÞ ¼minmin ~x2X;~y2Y k~x~yk ð10Þ h1ðA;BÞ ¼minmin ~x2X ~y2Y kabk ¼minmin~x2X~y2Y kabk ¼h1ðB;AÞ ð11Þ
The total distance contributed both by the bag-level and instance-level features can be calculated as
TotalDist ¼Mahcosdistþ
c
Hausdorffdist¼ !XS1!YT ffiffiffiffiffiffiffiffiffiffiffiffiffiffiffiffi X ! S1!XT q ffiffiffiffiffiffiffiffiffiffiffiffiffiffiffiffi Y ! S1!YT q þ
c
minmin ~x2X ~y2Y k~x~yk ð12Þwhere
c
controls the tradeoff between Mahalanobis cosine distance and modified Hausdorff distance.The Citation-KNN adapts KNN algorithm to the multiple-instance problem. Citation-KNN introduces the concept of citation from library and information science field. The notion of citation is to take not only into account the neighbors of a bagXbut also the bags that count X as a neighbor. KNN algorithm only takes into account the Knearest neighbors of a bag X. Actually, we could use either references or citers of an unseen example to predict the class of the example rather than only use the references. There-fore, the parameterKis replaced by two parametersR andCas
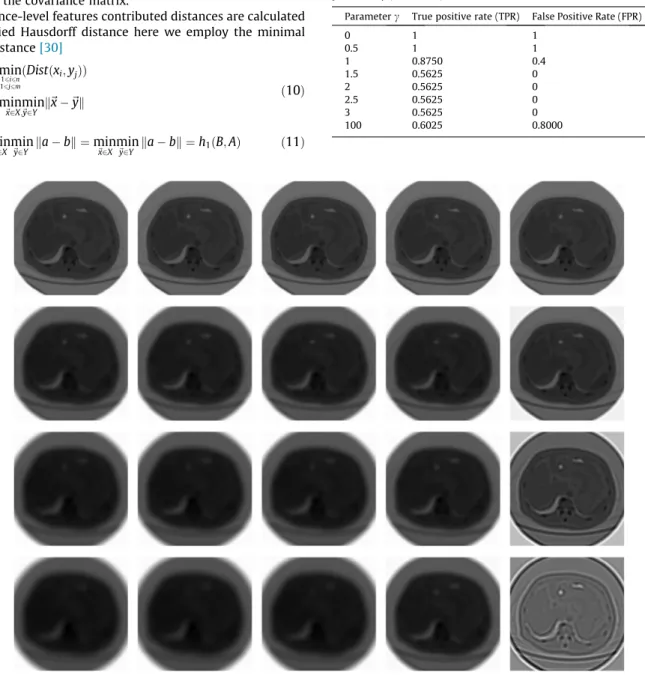
Fig. 10.The phase responses of circular Gabor bank filtered spectral CT image Table 3
The performance of proposed weighted Citation KNN algorithm with different parameterc(C= 2,R= 3)
Parameterc True positive rate (TPR) False Positive Rate (FPR) Accuracy
0 1 1 0.6154 0.5 1 1 0.6154 1 0.8750 0.4 0.7692 1.5 0.5625 0 0.7038 2 0.5625 0 0.7038 2.5 0.5625 0 0.7038 3 0.5625 0 0.7038 100 0.6025 0.8000 0.4615
R-nearest references and theC-nearest citers for solving the multi-ple instances learning problems.
The detail of improved Citation-KNN algorithm is described as follows:
Algorithm: Improved weighted distance based Citation-KNN algorithm
Input: Training set (bags and labels), testing set (bags) Output: Predicted labels of testing set
(1) Extract instance-level and bag-level features, and normalized these features
(2) Calculate the weighted distances between testing bags and training bags according to formula(12)
(3) SelectRreference neighbors andCciter neighbors of the test bag
(4) The label of the test bag is predicted by a majority vote of its neighbors
5. Experiments
The image size of the collected dataset is 512512 which meansN= 512, then the radial frequencies
F2npffiffiffi2=26;p2ffiffiffi=25;pffiffiffi2=24;pffiffiffi2=23;p2ffiffiffi=22o
The circular Gabor filter bank filtered CT images at 5 frequencies, 4 scales are shown inFigs. 9 and 10.
The experimental dataset was collected from our cooperating hospital. 26 cases were gathered eventually due to the difficulty of clinical data collection. There are two types of ROIs in our exper-iment, the elliptical ROI and the rectangle ROI. The elliptical ROIs encompassed the tumor were placed on the selected monochro-matic image by experienced radiologists. The patches (instances inside bags) were selected semi-automatically by experimenters under the principle that putSinitial seed points in both the thick-ened and normal region on the gastric wall. Features extracted from elliptical ROIs are regard as bag-level features, and features extracted from patches are regard as instance-level features. We used leave-one-out cross validation (LOOCV) for performance estimation of dif-ferent MIL algorithms, making the best use of limited data.
Table 3 shows the performance of the proposed weighted Citation-KNN algorithm with different parameter
c
. TheR-nearest references andC-nearest citers are combined[30]to predict the label of an unseen bag. The two parameters are empirically set to beC= 2,R= 3. From the results of the table, we can tell that when
c
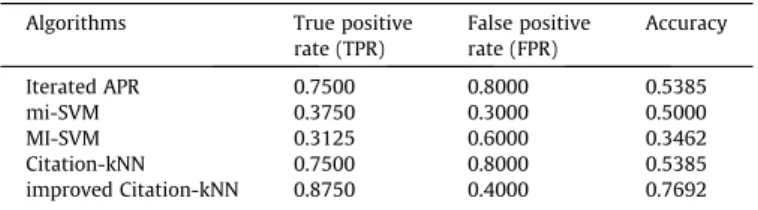
= 1, the highest classification accuracy is achieved. On the basis of 26 obser-vations, the true positive rates (TPR) and false positive rates (FPR) are also tabulated in theTable 3. When these two kinds of distances were combined, the cumulative effect of these features was improved to an accuracy of 76.92%, sensitivity (TPR) of 87.5% and specificity (1-FPR) of 60.0% using improved weighted Citation-KNN algorithm.The TPRs, FPRs and total accuracies of different MIL algorithms [39], Iterated APR, mi-SVM, MI-SVM, Citation-KNN, and the proposed algorithm are shown inTable 4. In addition, receiver operating char-acteristic (ROC) curves of these algorithms for this classification task are given in Fig. 11. The classification accuracies obtained by improved Citation-KNN are higher than other state-of-the-art algo-rithms, which demonstrate the effectiveness of the proposed method.
6. Discussion
In this paper, we designed a new CAD scheme to treat the problem of gastric tumor invasion depth identification. A certain Table 4
The performance of different MIL algorithms Algorithms True positive
rate (TPR) False positive rate (FPR) Accuracy Iterated APR 0.7500 0.8000 0.5385 mi-SVM 0.3750 0.3000 0.5000 MI-SVM 0.3125 0.6000 0.3462 Citation-kNN 0.7500 0.8000 0.5385 improved Citation-kNN 0.8750 0.4000 0.7692
number of patches are extracted from the monochromatic images to describe the texture information of the suspected region of lesion. However, it is a difficult task to label these patches. Thus, MIL was proposed to deal with ambiguous labels of the training patches, or instances. Traditional MIL algorithms make use of instance-level features; nevertheless, we believe that bag-level features also provide useful information. In our computer aided diagnosis for gastric tumor invasion depth identification, we aim to capture more complementary information about the morpho-logical structure. According to the results obtained in this study, traditional MIL algorithms just utilize the intensities and texture information within the patches thus neglects bag-level informa-tion. This study has presented a novel semi-automatic CAD system for gastric cancer diagnosis. The core of the system is based on combining local features for characterizing the texture information of lesions and global features for characterizing the morphology of the tumor as well as patients’ personal information and quantita-tive spectral CT values. Subsequently, the corresponding MIL classification algorithm is proposed by modifying the Citation KNN method through the combination of two kinds of distances. Finally, the bag label is predicted with a simple majority vote.
Circular Gabor filter-based representations were employed for texture feature analysis. The technique exploits the local character-istics of gastric tumor. Each CT image is filtered in a number of fre-quencies and scales and a fixed-length feature vector is extracted in each patch inside the lesion. The feature vector is compact and informative, which provide good performance in this study. Apart from the instance-level features, the patients’ personal information and quantitative CT values and material density values obtained from dual-energy CT imaging techniques are regarded as bag-level features, which provide global information for each case.
The parameter
c
regulates the proportion between instance-level feature vector calculated distance and bag-instance-level feature vec-tor calculated distance for the total distance between bags. The experimental results indicate that the best performance is achieved when the two levels of calculated distances contribute equally. In other words, the bag-level features are as important as instance-level features for calculating bag distance.The results of the individual MIL algorithms are analyzed using leave-one-out cross validation method and ROC analysis. The pro-posed algorithm yields the best performance (as the best tradeoff between the measures) among all the MIL test algorithms. With moderate sample size, the overall running times of KNN based MIL algorithms are significantly shorter than SVM or Iterated-discrim APR MIL algorithms.
In our future work, we intend to explore more useful and con-cise feature sets for gastric tumor invasion depth identification. Xie et al. [40] proposed a novel texton learning and encoding approach developed for effective and efficient texture classification algorithm, especially when the number of training samples is small. This texton learning scenario is appropriate for this specific CAD application. We believe that texton learning based approach will obtain more discriminative information and yield improved results.
7. Conclusion
Spectral CT imaging provides more additional quantitative information compared with traditional MDCT imaging. In this paper, for the identification of tumor invasion depth of gastric can-cer, two levels of feature are extracted from the original monochro-matic CT images; bag-level features denote the characteristics of the whole image, while the instance-level features describes the intensity and texture characteristics of the patches in the suspected regions and normal gastric wall. Experimental results
indicate the bag-level features and instance-level feature equally contributed to the final classification results. With the extracted features and proposed MIL based CAD system, the overall accuracy is comparable or even superior to the state-of-the-art MIL algorithms.
Conflict of interest
The authors declare that no conflict of interest. Acknowledgments
This work was supported by the National Basic Research Pro-gram of China (973 ProPro-gram, No. 2010CB732506), National Natural Science Foundation of China (NSFC No. 81272746) and National Natural Science Foundation of China (NSFC No. 60972110). References
[1] database Wm, World Health Organization Statistical Information System, 2012.
[2]A. Ferro, B. Peleteiro, M. Malvezzi, C. Bosetti, P. Bertuccio, F. Levi, et al., Worldwide trends in gastric cancer mortality (1980–2011), with predictions to 2015, and incidence by subtype, Eur. J. Cancer 50 (2014) 1330–1344. [3]R. Seevaratnam, R. Cardoso, C. Mcgregor, L. Lourenco, A. Mahar, R. Sutradhar,
et al., How useful is preoperative imaging for tumor, node, metastasis (TNM) staging of gastric cancer? A meta-analysis, Gastric Cancer 15 (2012) 3–18. [4]J. Choi, S.G. Kim, J.P. Im, J.S. Kim, H.C. Jung, I.S. Song, Endoscopic prediction of
tumor invasion depth in early gastric cancer, Gastrointest. Endosc. 73 (2011) 917–927.
[5]C.R. Habermann, F. Weiss, R. Riecken, H. Honarpisheh, S. Bohnacker, C. Staedtler, et al., Preoperative staging of gastric adenocarcinoma: comparison of helical CT and endoscopic US 1, Radiology 230 (2004) 465–471.
[6]J. Choi, S. Kim, J. Im, J. Kim, H. Jung, I. Song, Comparison of endoscopic ultrasonography and conventional endoscopy for prediction of depth of tumor invasion in early gastric cancer, Endoscopy 42 (2010) 705–713.
[7]C. Yan, Z.G. Zhu, M. Yan, H. Zhang, Z.L. Pan, J. Chen, et al., Value of multidetector-row computed tomography in the preoperative T and N staging of gastric carcinoma: a large-scale Chinese study, J. Surg. Oncol. 100 (2009) 205–214.
[8]S.W. Hwang, D.H. Lee, S.H. Lee, Y.S. Park, J.H. Hwang, J.W. Kim, et al., Preoperative staging of gastric cancer by endoscopic ultrasonography and multidetector-row computed tomography, J. Gastroenterol. Hepatol. 25 (2010) 512–518.
[9]I. Joo, J.M. Lee, J.H. Kim, C.I. Shin, J.K. Han, B.I. Choi, Prospective comparison of 3T MRI with diffusion-weighted imaging and MDCT for the preoperative TNM staging of gastric cancer, J. Magn. Reson. Imaging (2014).
[10] B. Li, Dual-Energy CT with Fast-kVp Switching and Its Applications in Orthopedics, OMICS J. Radiol. (2013).
[11]N. Chandra, D.A. Langan, Gemstone detector: dual energy imaging via fast kVp switching, in: T. Johnson, C. Fink, S.O. Schönberg, M.F. Reiser (Eds.), Dual Energy CT in Clinical Practice, Springer-Verlag, Berlin, Germany, 2011. [12]D. Langan, Gemstone Spectral Imaging: GE White Paper, GE Healthcare,
Waukesha, Wis, 2008.
[13]D.E. Morgan, Dual-energy CT of the abdomen, Abdom. Imaging 39 (2014) 108– 134.
[14]X.Z. Lin, Z.Y. Wu, R. Tao, Y. Guo, J.Y. Li, J. Zhang, et al., Dual energy spectral CT imaging of insulinoma-Value in preoperative diagnosis compared with conventional multi-detector CT, Eur. J. Radiol. 81 (2012) 2487–2494. [15]Z. Pan, L. Pang, B. Ding, C. Yan, H. Zhang, L. Du, et al., Gastric cancer staging
with dual energy spectral CT imaging, PLoS One 8 (2013) e53651.
[16]J. Shiraishi, Q. Li, D. Appelbaum, K. Doi, Computer-aided diagnosis and artificial intelligence in clinical imaging, Seminars in Nuclear Medicine, Elsevier, 2011. pp. 449–462.
[17]J. Dheeba, N.A. Singh, S.T. Selvi, Computer-aided detection of breast cancer on mammograms: a swarm intelligence optimized wavelet neural network approach, J. Biomed. Inform. 49 (2014) 45–52.
[18]U. Acharya, G. Swapna, S. Sree, F. Molinari, S. Gupta, R. Bardales, et al., A Review on ultrasound-based thyroid cancer tissue characterization and automated classification, Technol. Cancer Res. Treat. (2013).
[19]A. Oliver, A. Torrent, X. Lladó, M. Tortajada, L. Tortajada, M. Sentís, et al., Automatic microcalcification and cluster detection for digital and digitised mammograms, Knowl.-Based Syst. 28 (2012) 68–75.
[20] G. Fung, M. Dundar, B. Krishnapuram, R.B. Rao, Multiple instance learning for computer aided diagnosis, in: Advances in Neural Information Processing Systems, vol. 19, 2007, p. 425.
[21]M. Kandemir, F.A. Hamprecht, Computer-aided diagnosis from weak supervision: a benchmarking study, Comput. Med. Imaging Graph. (2014). [22]Q. Liu, Z. Qian, I. Marvasty, S. Rinehart, S. Voros, D.N. Metaxas, Lesion-specific
multiple instance support vector machines, Medical Image Computing and Computer-Assisted Intervention – MICCAI 2010, Springer, 2005, pp. 484–492. [23]J. Melendez, C. Sánchez, R. Philipsen, P. Maduskar, B. van Ginneken,
Multiple-instance learning for computer-aided detection of tuberculosis, SPIE Med. Imag. Int. Soc. Optics Photon. (2014) (90351J-J-6).
[24]T. Tong, R. Wolz, Q. Gao, R. Guerrero, J.V. Hajnal, D. Rueckert, Multiple instance learning for classification of dementia in brain MRI, Med. Image Anal. 18 (2014) 808–818.
[25]C. Li, C. Shi, H. Zhang, C. Hui, K.M. Lam, S. Zhang, Computer-aided diagnosis for preoperative invasion depth of gastric cancer with dual-energy spectral CT imaging, Acad. Radiol. (2014).
[26]T.G. Dietterich, R.H. Lathrop, T. Lozano-Pérez, Solving the multiple instance problem with axis-parallel rectangles, Artif. Intell. 89 (1997) 31–71. [27] Q. Zhang, S.A. Goldman, EM-DD: An improved multiple-instance learning
technique, in: Advances in Neural Information Processing Systems, 2001, vol. 14, pp. 1073–1080.
[28] S. Andrews, I. Tsochantaridis, T. Hofmann, Support vector machines for multiple-instance learning, in: Advances in Neural Information Processing Systems, 2002, pp. 561–568.
[29]Y. Chen, J. Bi, J.Z. Wang, MILES: multiple-instance learning via embedded instance selection, IEEE Trans. Pattern Anal. Mach. Intell. 28 (2006) 1931–1947. [30] J. Wang, J.-D. Zucker, Solving Multiple-Instance Problem: A Lazy Learning
Approach, 2000.
[31]B. Krishnapuram, J. Stoeckel, V. Raykar, B. Rao, P. Bamberger, E. Ratner, et al., Multiple-instance learning improves CAD detection of masses in digital mammography, in: Digital Mammography, Springer, 2008, pp. 350–357.
[32]L. Zhu, B. Zhao, Y. Gao, Multi-class multi-instance learning for lung cancer image classification based on bag feature selection, in: Fifth International Conference on Fuzzy Systems and Knowledge Discovery, 2008 FSKD’08, IEEE, 2008, pp. 487–492.
[33]G. Quellec, M. Lamard, M.D. Abràmoff, E. Decencière, B. Lay, A. Erginay, et al., A multiple-instance learning framework for diabetic retinopathy screening, Med. Image Anal. 16 (2012) 1228–1240.
[34]Y. Xu, J.-Y. Zhu, E.I. Chang, M. Lai, Z. Tu, Weakly supervised histopathology cancer image segmentation and classification, Med. Image Anal. 18 (2014) 591–604.
[35]Y. Cui, S.Y. Gao, Z.L. Wang, X.T. Li, Y.S. Sun, L. Tang, et al., Which should be the routine cross-sectional reconstruction mode in spectral CT imaging: monochromatic or polychromatic?, Br J. Radiol. 85 (2012) e887–e890. [36]A. Ghandehari, R. Safabakhsh, Palmprint verification using circular gabor filter,
in: Advances in Biometrics: Springer, Springer, 2009, pp. 675–684. [37]A.K. Jain, F. Farrokhnia, Unsupervised texture segmentation using Gabor filters,
in: IEEE International Conference on Man and Cybernetics, 1990 Conference Proceedings, IEEE, 1990, pp. 14–19.
[38]J. Zhang, T. Tan, L. Ma, Invariant texture segmentation via circular Gabor filters, in: Proceedings 16th International Conference on Pattern Recognition, 2002, IEEE, 2002, pp. 901–904.
[39]J. Yang, Review of Multi-instance Learning and its Applications, Tech. Rep, 2005.
[40]J. Xie, L. Zhang, J. You, S. Shiu, Effective texture classification by texton encoding induced statistical features, Pattern Recogn. (2014).