Abstract: An effective automatic region growing was developed in this work for the segmentation of suspected lung nodules from the Computed Tomography (CT) lung images. After the segmentation of the suspected lung nodules the eccentricity and area features were calculated to eliminate line like structures and tiny clusters below 3mm. The centroid analysis, contrast, autocorrelation and homogeneity features were extracted for the suspected lung nodules. The extracted features were trained and tested with Artificial Neural Network (ANN) to remove the blood vessels and calcifications (calcium deposition in the lungs). This work was carried out on 106 patients images retrospectively collected from Bharat Scans, Chennai, which had 56 cancerous nodules and 745 non-cancerous nodules (size greater than 3 mm). The proposed work yielded sensitivity, specificity and accuracy of 100%, 93% and 94%, respectively.
Keyword: Computed tomography, CAD, lung cancer, cluster, morphology, nodules.
I. INTRODUCTION
C
ancer is one of the diseases which lead to maximum deaths in the world [1]. Out of all other cancer, lung cancer leads to more deaths [2]. Lung cancer is difficult to diagnose because of the soft nature of lung tissue. The process called lung biopsy (taking a cancerous tissue out for microscopic analysis) is really painful. Hence physicians will not suggest for biopsy unless there is a strong evidence of lung cancer. Computer Tomography (CT) scans is usually preferred by the physicians who come up with the lung cancer symptom. The new CT technology will produce nearly 300 scans for a complete lung cross section. The radiologist job becomes tough as they need to analyse all these scan images for every patient. The development of Computer Aided Diagnosing (CAD) is concentrated in this work, which helps the physicians to diagnose the lung cancer accurately. Developed CAD algorithm for lung cancer analysis have three critical stages: 1. segmenting the suspected cancerous indicator called 'nodule', 2. extracting the discriminative feature to define the suspected nodules mathematically andRevised Manuscript Received on November 22, 2019.
* Correspondence Author
Manikandan T, Professor, Department of ECE, Rajalakshmi Engineering College, Chennai, Email: [email protected]
Devi B, Assistant Professor, Department of ECE, Rajalakshmi Engineering College, Chennai, India, Email: [email protected]
Helanvidhya T, Assistant Professor, Department of ECE, Rajalakshmi Engineering College, Chennai, India, Email: [email protected]
3. Classification of real malignant nodules from the benign nodules.
To segment the suspected lung nodules from CT images threshold technique was described in many studies [3,4]. The selection of threshold value varies slice to slice and depends on x-ray dose and technology. Hence threshold based segmentation is not reliable and it will not work universally. To overcome this draw back many researchers implemented automatic thresholding techniques. Many studies revealed the region grow algorithm to segment the lung nodules effectively. The problem with region grow techniques are it will take more time for segmentation. Active contour based segmentation will overcome this time constraint and perform the segmentation quickly [5,6].
In many literatures 2D approaches were reported for the segmentation of suspected nodules from the single CT scan slice [7,8,9]. Suspected lung nodules analysis based on the single slice approaches (2D) will increases false positive prediction. Three dimensional (3D) approaches are reported in the literature to overcome the 2D approaches effectively to reduce the false positives [10,11].
In this work we make use of region growing technique for the segmentation of the suspected lung nodules. The shape features and texture features are calculated to remove tiny clusters and calcifications from the segmented suspected nodules. The extracted features are trained and tested with ANN classifier to detect the malignant (cancerous) and benign (non-cancerous) nodules.
II. STUDYPOPULATION
The patients included in this study are who had lung cancer and visited the Bharat Scans, Chennai, between the month of June 2014 and December 2014 and participated in our symptom based earlier study. Since this study is focused to detect the lung cancer at its initial stage (stages I and II), the patients with cancer in advanced stage (stages III and IV) were excluded from the study.
The written well-versed consent was obtained from all the patients before the start of the study and ethical committee of Bharat Scans approved the study protocol. The total of 56 cancerous patients (24 stage I and 32 stage II) CT scan images were retrospectively collected from the scan centre. To make the automatic diagnosis system, 50 non-cancerous subjects with lung infections were also included. Thus, our study population comprises of 106 subjects. The scan centre
allotted 2 radiologists to analyse all the 106 subjects CT
A Computer-Aided Diagnosis System for Lung
Cancer Detection with Automatic Region
Growing, Multistage Feature Selection and
Neural Network Classifier
images, which had 56 malignant nodules and 745 benign nodules with size greater than 3 mm
III. PROPOSEDMETHODOLOGY
The proposed work first uses optimum filter (Wiener filter) for the noise removal, followed by automatic region growing for segmenting the suspected lung nodules, the multistage feature selection for removal of lines and other unwanted tiny clusters and calcifications. Finally neural network classifier is utilized to classify the suspected lung nodules as either malignant or benign.
A. Preprocessing for Noise Removal
The noise is getting added in the CT images during image acquisition process. Hence preprocessing stage is focused to reduce the noise which is getting added during the image acquisition. In general, filtering techniques are applied on the input CT images for the noise removal. The filters such as alpha trimmed, contra harmonic, mean, median, max, Gaussian and Wiener are applied on the input image. The filter size is so important to balance between noise removal and blurring at the edges. Therefore the filter size is optimized as 3x3. The Peak Signal-to-Noise Ratio (PSNR) is computed for all the filtered images. The result show that, the Wiener filter has outplayed all the filters in terms of PSNR. Hence the Wiener filter output is further processed to segment the suspected lung nodules. The PSNR value for various filtered image is given in Table 1.
Table 1. PSNR value for various filters
S.No. Name of the Filter PSNR Value
1. Alpha Trimmed Image 3.820 dB
2. Contra Harmonic Filtered Image 3.832 dB
3. Mean Filtered Image 18.9984 dB
4. Median Filtered Image 19.918 dB
6. Max Filtered Image 20.418 dB
7. Gaussian Filtered Image 38.743 dB
8. Weiner Filtered Image 39.304 dB
B. Automatic Region Growing (ARG) for the suspected lung nodules segmentation
The threshold based segmentation methods are not fully automatic as the thresholds need to be fixed after analyzing the given lung CT image. We have developed a completely automatic algorithm to segment the nodule structures from the CT scan sections. The region growing was applied in such a way that the initial seed position can be automatically decided by the algorithm. Morphological operations were applied on the region grown to mask efficiently and segment the well-circumscribed nodule from the lung parenchyma in the CT images.
The algorithm steps used were as follows:
1. The initial seed position was automatically chosen as [(m/2), (n/2)], where m is the number of rows and n is the number of columns in the CT image. The algorithm was implemented to check the intensity value of the pixel at
(m/2, n/2) before it starts growing. If the seed position value is close to black region (vessel hole), the initial seed was shifted for few positions away in x and y before region grow was started.
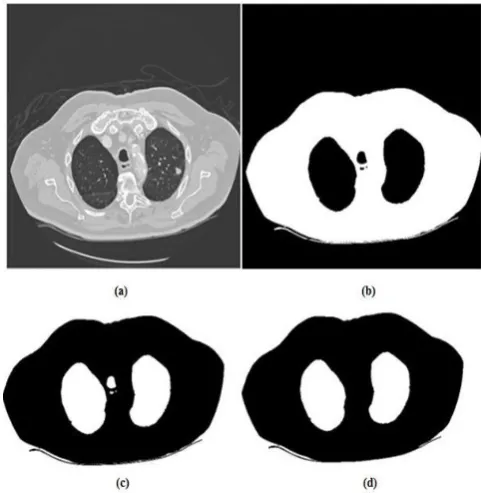
2. Region growing was performed automatically with chosen seed in the step 1, which created the mask for the muscle/fat portion in the CT slice as '1' and remaining portion as '0' (Figure 1 b). The neighbor pixels with less difference made as 1 and other pixels changed in to 0. This process iteratively continue for every new '1' pixel position produced in last iteration until no more pixel difference is minimum.
3. The image mask produced in step 2 was inverted as shown in the Figure 1c.
4. In the inverted image mask produced in step 3 the lung lobes appeared as white region with some major central vessels and background region. To remove this, the morphological opening was performed. All the white regions with less connected white pixels were made as black as shown in Figure 1 d.
Figure 1 Region grow algorithm masks (a) Before applying region grow, (b) Region grow mask, (c) Inverted region grow mask, and (d) after opening of small clusters
5. The remaining white regions in the mask were lung lobes. All the connected white regions were counted and labeled. Thus, after step 5 only the lung lobes were segmented from the entire lung CT scan slice as shown in Figure 2 a.
6. The lung lobe was masked with the original CT slice, so that the parenchymal region alone was segmented successfully. The lung parenchyma has shown dark background with bright nodules and vessels (Figure 2 b). By simply converting this into binary image, the suspected nodules and vessels part became 1 and all background dark portions became 0. Thus, the mask of suspected lung nodules with vessel lines segmented are shown in Figure 2c. After applying shape, eccentricity and area criteria, the final suspected nodules are
[image:2.595.306.547.292.539.2]Figure 2. Segmented lung lobe and nodule image: (a) Lung lobe mask, (b) Original lung lobe, (c) Nodules and vessels mask, (d) Candidate nodules
C. 2-D Shape/size Features to Eliminate Insignificant Clusters
The line like irregular structures in the suspected clusters is not nodules. These structures may be due to the other tissues in the lung. It is essential to remove these structures and keep only the nodule like structures in the segmented image before finding out the different features. Also, the very tiny structures less than 3 mm diameter or area less than 10 pixels (threshold T1) will be eliminated as these small clusters
do not have any significant information to process further. The eccentricity and area features are calculated by using the equations (1) and (2) respectively.
m
i 1 n
j i
max I(i,:)
Eccentricity
max I(:, j)
(1)m n b i 1 j 1
Area
I
(i, j)
(2)
Where Ib(i,j) is the binary segmented nodules.
The suspected clusters with high and low eccentricity values are eliminated (thresholds T21-T22). Nodules
candidates usually have a shape close to circle for which the eccentricity is around one. Hence all the clusters whose eccentricity values deviate much away from '1' are left out. The remaining nodules (called initial suspected) after applying the area and eccentric are still not cancerous. Some of them may be cancerous and some of them may be non-cancerous (blood vessels and calcifications). Hence further analysis should be carried out in order to eliminate the non-cancerous nodules.
D. 3-D Centroid analysis to eliminate blood vessels The entire nodules like structures which were remaining after elimination of small tiny clusters and line like structures need not to be malignant nodules. Hence it is essential to find the discriminative feature to classify malignant nodule from
benign. One interesting observation that the physicians in clinical practice follow to identify the real malignant nodules are their changes in position and shape in the consecutive slices of CT scan. The centroid position of the real nodules will not deviate much, but their shape will vary much in the consecutive slices. The centroids for all the discrete clusters segmented in the consecutive slices were computed using the equation (3)
m n m n
b b
i 1 j 1 i 1 j 1
x y m n m n
b b
i 1 j 1 i 1 j 1
[image:3.595.277.552.383.591.2]i * I (i, j) j* I (i, j)
[C , C ] ,
I (i, j) I (i, j)
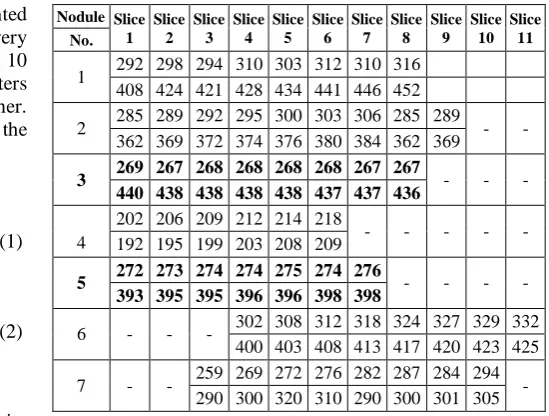
(3)The centroid change of each 7 nodules in the consecutive slices were computed and tabulated in Table 2. The nodules with more centroid changes were eliminated (threshold T3).
Thus, the nodules 1, 2, 4, 6 and 7 were eliminated. The nodules 3 and 5 (called final suspected nodules) are having minimum centroid change, therefore these four nodules need to be analyzed more. Even after removing all the small clusters, line like irregular structures and blood vessels from the CT images, the remaining suspected nodules (called suspected nodules) need not to be malignant.
Table 2 A cancerous patient slices with centroid (x,y) changes in consecutive CT slices
Nodule Slice 1
Slice 2
Slice 3
Slice 4
Slice 5
Slice 6
Slice 7
Slice 8
Slice 9
Slice 10
Slice 11 No.
1 292 298 294 310 303 312 310 316 408 424 421 428 434 441 446 452
2 285 289 292 295 300 303 306 285 289 - - 362 369 372 374 376 380 384 362 369
3 269 267 268 268 268 268 267 267 - - - 440 438 438 438 438 437 437 436
4
202 206 209 212 214 218
- - - - -
192 195 199 203 208 209
5 272 273 274 274 275 274 276 - - - - 393 395 395 396 396 398 398
6 - - - 302 308 312 318 324 327 329 332 400 403 408 413 417 420 423 425 7 - - 259 269 272 276 282 287 284 294 -
290 300 320 310 290 300 301 305
E. 3-D Texture features to eliminate calcifications The calcium deposits are known as calcifications and look like nodule structure with minimum centroid shift in consecutive slices. Calcifications can be spotted well on texture measures than shape. Some calcifications inside the lung parenchyma region looks like nodule, but these calcifications are benign, not cancerous. Therefore, it is essential to remove these calcifications. Calcifications are having more contrast, and it is homogeneous throughout its region. The auto-correlation value of the calcification is on the higher side as it is uniform throughout the region. Further, calcification patterns texture
consecutive slices. Therefore, texture features such as contrast, homogeneity and auto-correlation were extracted from the consecutive slices to discriminate malignant nodules from calcifications (threshold values T4, T5 and T6). This
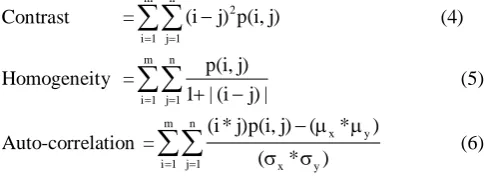
approach is greatly help to eliminate False Positive (FP) nodules which look like a nodule structure in 2-D image. The texture features on a co-occurrence matrix of the suspected nodules were computed using the equations (4) to (6).
Contrast =
m n 2 i 1 j 1
(i j) p(i, j)
(4)Homogeneity =
m n
i 1 j 1
p(i, j) 1 | (i j) |
(5)Auto-correlation =
m n
x y i 1 j 1 x y
(i * j)p(i, j) ( * )
( * )
(6)Where p[i,j] is the occurrence of the gray level pixel pair (i,j), µx , µy are the mean in row and column direction and σx, σy
are the standard derivatives in row and column direction.
[image:4.595.46.289.160.248.2]The texture features extracted from the final suspected nodules are tabulated in Table 3. The texture values remain almost same in consecutive slices were eliminated. The nodule 3 in table 3 have high contrast value compared to nodule 5. The homogeneity and auto-correlation value are uniform and close to 1 for the nodule 3, hence these nodule was calcified. The nodule 5 has less and variable contrast value in consecutive slices. The auto-correlation and homogeneity values for nodule 5 vary across slices and the values are reasonably less than 1, which means the nodule 5 texture pattern is not uniform. Hence nodule 5 is only malignant from the 7 suspected nodules.
Table 3. Texture features of final suspected lung nodules of a cancerous subject
Nodule No. Slice
No. Contrast Homogeneity Auto-Correlation
Nodule 3 (Exists in 8 consecutive
slices)
Slice 1 0.071 0.898 0.82
Slice 2 0.070 0.898 0.89
Slice 3 0.072 0.899 0.80
Slice4 0.072 0.897 0.81
Slice 5 0.071 0.899 0.81
Slice 6 0.073 0.898 0.82
Slice 7 0.073 0.899 0.83
Slice 8 0.072 0.895 0.81
Nodule 5 (Exists in 7 consecutive
slices)
Slice 1 0.033 0.443 0.52
Slice 2 0.044 0.451 0.43
Slice 3 0.046 0.462 0.49
Slice 4 0.041 0.592 0.44
Slice 5 0.046 0.454 0.43
Slice 6 0.043 0.423 0.48
Slice 7 0.044 0.432 0.40
IV. ARTIFICIALNEURALNETWORK(ANN) Neural network consists of artificial neurons which replaces the functions of neurons in the human brain. It consists of three layers. They are input layer, hidden layer and output layer. The extracted final suspected lung nodule features (centroid shift, homogeneity, auto-correlation and
contrast) were fed to the input layer and then it is propagated to output layer through the hidden layer.
The feed forward-back propagation algorithm was employed in the neural network classifier. During the training process, the weights between input layer and hidden layer and hidden layer and output layer were adjusted to minimize the mean square error between neural network output value and target value. Once the training got over, it will have the capability of making the decision about the final suspected lung nodules as either malignant or benign during the testing phase.
V. EXPERIMENTALANALYSIS
Totally, 106 patient cases CT images retrospectively collected from Bharat Scans, Chennai and they were analyzed critically. 60% of the subjects (34 cancerous and 30 non-cancerous) who had 34 cancerous and 510 non-cancerous nodules were used for training and remaining 40% of subjects (22 cancerous and 20 non-cancerous) who had 22 cancerous and 235 non-cancerous nodules used for testing. The implemented classifiers for the lung cancer detection are compared to evaluate their performance based on the detection of True Positives (TP), False Positives (FP), True Negatives (TN), False Negatives (FN), Sensitivity, Specificity and Accuracy.
The TP is the condition where the cancerous nodules segmented from a CT slice are classified as cancerous. Correspondingly, the FP is the condition where the non-cancerous nodules segmented from a CT slice are classified as cancerous. The TN is the situation where the non-cancerous nodules segmented from a CT slice are classified as non-cancerous. Correspondingly, the FN is the situation where the cancerous nodules segmented from a CT slice are classified as non-cancerous.
The proposed region growing technique with ANN classifier detected 22 malignant nodules correctly in the testing phase. Hence the true positive is 22 and false negative is 0. Out of 235 non-cancerous nodules, the proposed system correctly identified 219 nodules as non-cancerous nodules. Hence, the true negative is 219 and false positive is 16.
The sensitivity, specificity and accuracy are measured to analyse the system performance. The sensitivity and specificity are the measures of proportion of actual positives and actual negatives which are correctly identified. The accuracy is the measure of true results in a diagnostic test. The sensitivity, specificity and accuracy for the proposed system is found to be 100%, 93% and 94% respectively.
VI. CONCLUSION
The malignant lung nodules successfully detected in this work by eliminating the benign nodules effectively. The automatic region growing segmentation used here in this work successfully segmented all the possible suspected nodule clusters. The region growing algorithm is developed such that to choose its initial cluster seed value automatically based on the maximum and minimum value of each row of an image. The shape features, area and eccentricity are calculated to eliminate all the unwanted and small (less than 3mm diameter) clusters from the segmented output image. Further centroid shift, homogeneity, auto-correlation and contrast are used as input to the ANN classifier to discriminate the calcifications.
and 745 benign nodules and produced a sensitivity, specificity and accuracy of 100%, 93% and 94%, respectively.
Acknowledgement
This study was supported by Bharat Scans, Royapettah, Chennai, following approval (Ref:IEC-BERF/Approval Lr./Date: 4-6-2014) by the ethical committee of the Bharat Education and Research Foundation. The authors wish to express their gratitude to the authorities of Bharat Scans for providing required facilitative infrastructure to carry out this work.
REFERENCES
[1] American cancer society. Cancer facts & figures 2014. Atlanta: American Cancer Society, 2014.
[2] T. Manikandan and N. Bharhathi, „Lung cancer diagnosis from CT images using fuzzy inference system,‟ in Computer Intelligence and Information Theory, Springer-Verlag Berlin Heidelberg, Vol. 250, pp.642-647, 2011,DOI:10.1007/978-3-642-25734-6_110.
[3] W.J. Choi and T.S. Choi, “Genetic programming-based feature transform and classification for the automatic detection of pulmonary nodules on computed tomography images,” Information Sciences, vol. 212, pp. 57–78, 2012.
[4] T. Messay, R. Hardie and S. Rogers, “A new computationally efficient CAD system for pulmonary nodule detection in CT imagery,” Med Image Anal, vol. 14, pp. 390–406, 2010.
[5] T. Manikandan and N. Bharathi, „Lung cancer detection by automatic region growing with morphological masking and neural network classifier‟, Asian Journal of Information Technology, ISSN: 1682-3915, vol. 15, no. 21, pp. 4189-4194, 2016.
[6] R. Nagata, T. Kawaguchi and H. Miyake, “Automated detection of lung nodules in chest radiographs using a false-positive reduction scheme based on template matching,” 5th
IEEE International conference on Biomedical Engineering and Informatics (BMEI), pp. 216-223, Chongqing, 2012.
[7] Jo, H. Hee, H. Hong, and J.M Goo, "Pulmonary nodule registration in serial CT scans using global rib matching and nodule template matching," Comput Biol Med, vol. 45, pp. 87-97, 2014.
[8] T. K. Senthilkumar and E.N. Ganesh, “Proposed technique for accurate detection/segmentation of lung nodules using spline wavelet techniques,” Int J Biomed Sci, vol. 9, pp. 9-17, 2013.
[9] J. Wang, M. Betke, and J. P. Ko, Pulmonary fissure segmentation on CT, MedImage Anal, vol. 10, pp. 530–547, 2006.
[10] M. Alilou, V. Kovalev, E. Snezhko, and V. Taimouri, “A comprehensive framework for automatic detection of pulmonary nodules in lung ct images,” Image Anal Stereol, vol. 33, pp. 13-27, 2014.
[11] L. Lu, Y. Tan, L.H. Schwartz, and B. Zhao, "Hybrid detection of lung nodules on CT scan images," Med Phys, vol. 42, pp. 5042-5054, 2015.
AUTHORS PROFILE
Dr. T. Manikandan is a Professor working at Rajalakshmi Engineering College, Thandalam, Chennai. He has completed his Ph.D titled “A study on computer-aided diagnosis systems for lung cancer detection and its three dimensional visualization using machine learning techniques” at Anna University, Chennai during January, 2017. He did his bachelor‟s degree in Engineering from Vellore Engineering College, Chennai under Madras University & master‟s degree in Engineering from College of Engineering, Anna University, Guindy, Chennai during 1998 & 2007, respectively. He is having 21 years of teaching experience which includes both UG and PG. He also guided many projects at UG & PG levels. He has 50 papers in refereed international journals and conferences in his credit. He is serving as editorial board member for various international journals such as International journal of Biomedical and Healthcare Sciences, Archives of General Internal Medicine, Journal of Cancer Diagnosis, Journal of Medical and Clinical Oncology, Journal of Clinical Epigenetics and Integrative Cancer Biology and Research.
Ms. B. Devi is working as Assistant Professor at Rajalakshmi Engineering College, Thandalam, Chennai. She did her Bachelor‟s degree in Engineering from Thiruvalluvar College of Engineering and Technology, Vandhavasi, secured 14th Rank in Madras University, \
and Master‟s degree in Engineering from Rajalakshmi Engineering College, Thandalam during 2004 and 2009 respectively. She is having 12 years of teaching experience and also guided projects in UG and PG level. She has attended many NPTEL courses and obtained topper, silver and elite in various subjects like Digital VLSI Testing, Digital Circuits, Microprocessor and Microcontroller, Control System and Joy of Computing using Python.