Vol. 20, (2) 2020
DOI 10.24815/jn.v20i2.16440 pISSN 1411-8513 eISSN 2541-4062 ORIGINAL RESEARCH
Vol. 20 | No. 2 | June 2020 24
Comparison of interpolation methods based on
Geographic Information System (GIS) in the spatial
distribution of seawater intrusion
MAULINA TANJUNG
1, SAUMI SYAHREZA
1*,
MUHAMMAD RUSDI
21Physics Department, Faculty of Mathematics and Natural Science, Syiah Kuala University, Banda Aceh, Indonesia
2Remote Sensing and Cartography Lab, Syiah Kuala University, Banda Aceh, Indonesia
Abstract. The study of monitoring seawater intrusion and groundwater quality in a coastal area needs to be done regularly to prevent the clean water crisis problems in the future. Accurate and reliable interpolation of seawater intrusion over a region is the requirement of an efficient monitoring. In this study, different interpolation methods were investigated and compared to determine the best interpolation method for predicting the spatial distribution of seawater intrusion in the coastal area of Banda Aceh. Groundwater electrical conductivity (EC) was analyzed to identify the contamination of seawater intrusion into the coastal aquifers. Four interpolation methods such as Empirical Bayesian Kriging (EBK), Global Polynomial Interpolation (GPI), Inverse Distance Weighting (IDW), and Local Polynomial Interpolation (LPI), were used to create the spatial distribution of the groundwater electrical conductivity. The accuracy of interpolation methods was evaluated by using a cross-validation technique through the coefficient of determination (R2) and the Root Mean Square
Error (RMSE). The results showed that IDW performed the most accurate prediction values and the best surface which were indicated by the least RMSE and the highest R2 value. It can be concluded that IDW interpolation
method is the best method for interpolating the groundwater electrical conductivity associated with seawater intrusion in the coastal area of Banda Aceh.
Keywords: coastal area, comparison, electrical conductivity, groundwater, interpolation, seawater intrusion, spatial distribution
INTRODUCTION
Seawater intrusion is the process of infiltration of seawater into the pores of rocks and contaminates its groundwater quality [1]. This process causes the suppression in groundwater by seawater on aquifers in coastal areas. Seawater intrusion occurs naturally in most coastal aquifers which are caused by hydraulic connections and density differences between groundwater and seawater. The amount of dissolved salt and the groundwater salinity are the indicators of seawater intrusion [2]. They can be determined by using the approach of the Electrical Conductivity (EC) measurement method [3]. The spatial distribution of seawater intrusion is an important indicator of groundwater quality. Spatial
and temporal information about the distribution of clean and contaminated the groundwater is very important to avoid problems of the water crisis in the future. Measurement of EC parameter in groundwater in all research locations requires a lot of time and cost so it is impossible to retrieve data in all coastal areas of Banda Aceh. Therefore, estimating prediction values at un-sampled locations is very important to be carried out. This study is used to investigate the comparison of interpolation methods based on Geographic Information System (GIS) in the spatial distribution of seawater intrusion in all coastal areas of Banda Aceh. The GIS-based interpolation method can be used to obtain predictive values at un-sampled locations [4]. GIS software provides various interpolation methods consisting of deterministic and geo-statistical interpolation methods that can be used in earth science. Geo-statistical analysis of the *Corresponding author:
Received: April 2020 | Revised: May 2020 Accepted: May 2020
Vol. 20 | No. 2 | June 2020 25 GIS-based interpolation methods can bridge the gap
between earth statistics and GIS commonly found in spatial data analysis [5]. Therefore, this study compares four interpolation methods namely Empirical Bayesian Kriging (EBK), Global Polynomial Interpolation (GPI), Inverse Distance Weighting (IDW), and Local Polynomial Interpolation (LPI).
Many researchers had conducted various research related to the comparison of interpolation methods in various fields of study, such as hydrology and earth science [6,7,8]. Inverse Distance Weighting (IDW) and Kriging are interpolation methods that are generally used in spatial analysis of seawater intrusion and groundwater quality [9]. There is one of the Kriging interpolation methods namely Empirical Bayesian Kriging (EBK) is the best interpolation method in predicting the number of dissolved solids in drinking water [10]. The EBK also works more optimal than the IDW in predicting groundwater contamination [11]. However, no interpolation method can always work optimally for all cases. The best interpolation method for certain situations can only be obtained by comparing the results of each interpolation process [8].
The objectives of this study are to determine the best interpolation method in creating a spatial distribution of seawater intrusion in the coastal area of Banda Aceh because there are no specific provisions regarding interpolation methods that should be used in the mapping process of the spatial distribution of seawater intrusion. Moreover, it is necessary to evaluate the best interpolation method which can generate the most accurate prediction value in the mapping process of the spatial distribution of seawater intrusion. The accurate prediction value will produce better spatial distribution mapping. The results are expected to be one of the references which can be used to predict the spatial distribution of seawater intrusion following the characteristics of the coastal region in Indonesia.
METHODOLOGY
Time and site
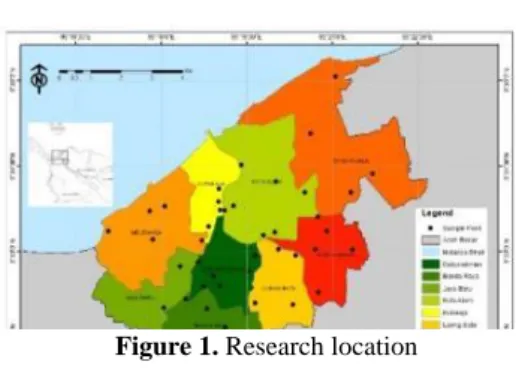
The research was conducted from March to October 2019 in 9 sub-districts of Banda Aceh (5o30’45’’ –
5o36’16’’ latitude and 95o16’15’’ – 95o22’35’’
longitude), which is located in Aceh Province. The map of research location can be seen in Figure 1
.
Data collection
In general, this research used a quantitative descriptive method. Field data analysis was performed analytically using geo-statistical analysis methods based on Geographic Information Systems (GIS) [5]. The technique of selecting groundwater samples at the study site used a non-probability
sampling technique namely the purposive sampling method in order to cover the whole research area which has different distance among the sampling points and also to avoid bias [12,13].
Groundwater sampling was carried out at 57 points in the study site covering all sub-districts of Banda Aceh. The groundwater sample data was then divided into two data groups. A total of 37 data samples in the first group were used in the interpolation process to produce prediction values at un-sampled locations. The second group consisted of 20 sample data were used to validate prediction values resulting from the interpolation process that had been done previously.
Interpolation methods
a. Empirical Bayesian Kriging (EBK) The EBK interpolation method is a geo-statistical interpolation method that assumes variations in z values are statistically homogeneous across locations on the surface and uses different kinds of semi variogram [6]. The EBK interpolation method counts the error value based on the estimated basic semi variogram. Semi variograms are calculated based on its distance h, different values of Z, and the number of data samples n, based on the equation (1): 𝛾 (h) = 1 2𝑛∑ {𝑍(𝑥𝑖) − 𝑍(𝑥𝑖 + ℎ)} 2 𝑛 𝑖=1 (1)
Semi-variance depends on the distance. The semi-variance is higher at the greater distance. It indicates that the variation of the Z value is no longer related to the distance of the sample point. In small datasets, the EBK interpolation method works more accurately [6].
b. Global Polynomial Interpolation (GPI) The GPI interpolation method produces gradually various surfaces using low-order polynomials that can describe some of the physical processes [7]. The GPI interpolation method with first-order polynomial works based on the equation (2):
Vol. 20 | No. 2 | June 2020 26
Zxy = b0 + b1x + b2y (2) The GPI interpolation method is useful for creating smooth surfaces and identifying long-term trends in a dataset [7].
c. Inverse Distance Weighting (IDW)
The IDW interpolation method calculates the prediction values based on observation values around it [15]. The resulting weight is inversely proportional to distance so that the prediction value (interpolated value) depends on the distance of the observation value (the value of the sample data) around it. The IDW method calculates values at un-sampled locations through the equation (3):
Z
j=
∑ 𝑍𝑖 𝑑𝑖𝑗𝑛 𝑖 ∑ 1 𝑑𝑖𝑗𝑛 𝑖(3)
Zj shows the prediction value at un-sampled location, dij represents the distance between the known point i and the unknown point j, Zi shows the observation value, and n is the user-defined exponent for weighting. The IDW interpolation method depends on the weighting of the average distance so that the average value cannot be greater than the highest input value or less than the lowest input value [4].
d. Local Polynomial Interpolation (LPI)
The LPI interpolation method is a type of deterministic interpolation method that uses polynomials on all surfaces and has algorithmic functions that correspond to polynomial sequences (zero, first, second, third, and so on) [7].
The equation used in the LPI interpolation method is derived from the equation in the GPI interpolation method by using a surface trend with a higher polynomial order as written in equation (4):
Zxy = b0 + b1x + b2y + b3x2 + b4xy + b5y2 + b6x3 + b7x2y + b8xy2 + b9y3 (4) The LPI interpolation method only uses the surrounding sample points and does not use the entire data as in the GPI interpolation method [12,13].
The accuracy of different interpolation method
The accuracy of each interpolation method is compared by using cross-validation techniques. The cross-validation technique illustrates how well a model predicts unknown values and helps determine a model that provides the most accurate predictions [6,14,15].
The calculated statistics serve as a diagnostic that shows whether the model is feasible to produce a map or not. The Root Mean Square Error (RMSE) method is used to compare the observation value
with the prediction value of the model through the equation (5):
RMSE = √∑ (𝑌𝑖− Ỳ𝑖)² 𝑛
𝑖=1
𝑛 (5)
where n is number of samples, 𝑌𝑖 is the observation value, and Ỳ𝑖 is the prediction value. Thus, the error measurement can be determined correctly.
In addition to estimate the accuracy of the interpolation methods, the coefficient of determination (R2 value) should be
evaluated [15,16]. Most of regression analysis problems use the coefficient of determination (R2 value) to estimate the
contribution of some independent variables (x-variable) to other dependent variables (y-variable) [14]. Thus, it can show the impact of independent variables on dependent variables in some situations simultaneously.
RESULT AND DISCUSSION
Geo-statistical analysis
Prediction of sea water intrusion and groundwater quality in a region can be determined based on the spatial distribution pattern of the electrical conductivity (EC) in groundwater through various interpolation methods available in the Geographic Information System (GIS) [17,18].
Spatial analysis results based on GIS interpolation method found the indications of sea water intrusion in the northern part of the coastal area of Banda Aceh, start from Meuraksa district, Kuta Raja district, some areas in Kuta Alam sub-district, to the Syiah Kuala sub-district. They can be indicated by the higher observations and prediction values of EC in the groundwater. The interpolation results show that the groundwater is contaminated by saltwater and cause the degradation of groundwater quality in the regions.
However, the mapping results of EC spatial distribution by the four interpolation methods show areas (polygons) that produce maximum values which are far enough from the coast (Table 1). The highest value of the measurement of EC in the groundwater is obtained in Baiturrahman sub-district which is located farther from the coastline. It is probably caused by other external factors such as the formation of aquifer, rock lithology composition, minerals content, and so on [2].
Vol. 20 | No. 2 | June 2020 27
Table 1. Statistics of Electrical Conductivity (EC) in Banda Aceh coastal region
Ground water Parameter Min (𝝁𝑺/ 𝒄𝒎) Max (𝝁𝑺/ 𝒄𝒎) Average (𝝁𝑺/ 𝒄𝒎) Standard Deviation EC 217 6.270 1208,14 1288,94
Comparison of interpolation methods
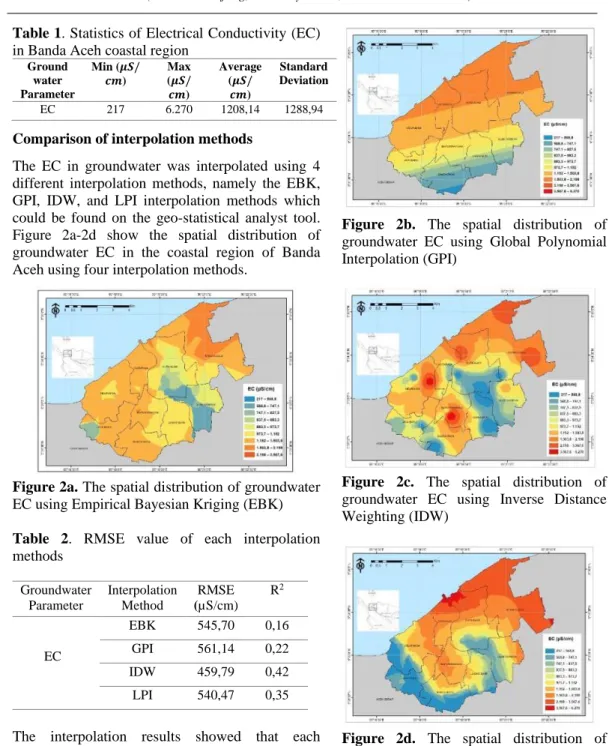
The EC in groundwater was interpolated using 4 different interpolation methods, namely the EBK, GPI, IDW, and LPI interpolation methods which could be found on the geo-statistical analyst tool. Figure 2a-2d show the spatial distribution of groundwater EC in the coastal region of Banda Aceh using four interpolation methods.
Figure 2a. The spatial distribution of groundwater EC using Empirical Bayesian Kriging (EBK)
Table 2. RMSE value of each interpolation methods
The interpolation results showed that each interpolation method produced different surface outputs. Based on the comparison of the four interpolation methods used, it can be seen that IDW produced a smooth surface output and the prediction values were centered in a circle (Figure 2c). The pattern of the surface outputs produced by EBK and LPI spread evenly (Figure 2a and Figure 2d, respectively)
.
The spatial distribution pattern produced on the GPI surface output was divided into several polygons horizontally (Figure 2b). The IDW interpolation method produced the lowest RMSE value (Table 2) compared to the other three interpolation methods (EBK, GPI, and LPI). As shown in Table 2, it can be seen that Inverse Distance Weighting (IDW) interpolation method produced the lowest RMSE value than three other interpolation methods (EBK, GPI, and LPI).Figure 2b. The spatial distribution of groundwater EC using Global Polynomial Interpolation (GPI)
Figure 2c. The spatial distribution of groundwater EC using Inverse Distance Weighting(IDW)
Figure 2d. The spatial distribution of groundwater EC using Local Polynomial Interpolation(LPI)
The RMSE value of each interpolation method is IDW < LPI < EBK < GPI, thus indicating that IDW is the most optimal interpolation method in the spatial distribution of EC groundwater in the coastal region of Banda Aceh.
The comparison of prediction and observation values using four interpolation methods are shown in Figure 3a-3d. The validation results showed that the comparison of prediction and observation values on the IDW interpolation method has the strongest regression relationship based on the coefficient of determination (R2 value
= 0,42). Groundwater Parameter Interpolation Method RMSE (µS/cm) R2 EC EBK 545,70 0,16 GPI 561,14 0,22 IDW 459,79 0,42 LPI 540,47 0,35
Vol. 20 | No. 2 | June 2020 28
Figure 3a. Cross-validation for Empirical Bayesian Kriging (EBK) interpolation method
Figure 3b. Cross-validation for Global Polynomial Interpolation (GPI) interpolation method
Figure 3c. Cross-validation for Inverse Distance Weighting (IDW) interpolation method
Figure 3d. Cross-validation for Local Polynomial Interpolation (LPI) interpolation method
Validation of interpolation methods
The comparison of cross-validation among the most optimal interpolation methods (IDW) and the three other interpolation methods (EBK, GPI, and LPI) on the spatial distribution mapping of EC groundwater over the coastal region in Banda Aceh are shown in Figure 4.
Figure 4a-c presented a comparison of cross-validation between the best interpolation method and other interpolation methods as an example to validate the interpolation results. The results showed a stronger correlation between IDW and LPI than other interpolation methods. Overall, the performance of deterministic methods (IDW and LPI) were better than geo-statistical methods in terms of the spatial distribution of groundwater EC in the Banda Aceh coastal region. It can be seen that IDW and LPI yielded the highest coefficient of determination (R2 value = 0,53).
Figure 4a. Cross-validation between IDW and EBK interpolation method
Figure 4b. Cross-validation between IDW and LPI interpolation method
Figure 4c. Cross-validation between IDW and GPI interpolation method
Vol. 20 | No. 2 | June 2020 29
CONCLUSION
The groundwater EC in the coastal region of Banda Aceh was interpolated using Geostatistical Analyst Tools in ArcGIS software. The interpolation results showed that the Inverse Distance Weighting (IDW) produced a smooth surface output and the prediction values were centered in a circle. Based on the result of the cross-validation technique, it can be seen that IDW interpolation method generated the smallest error (RMSE value = 459,79 µS/cm) and the highest coefficient determination (R2 value
= 0,42) compared to the other three interpolation methods for mapping the spatial distribution of EC groundwater in Banda Aceh coastal region. It can be concluded that IDW is the best interpolation method for generating the spatial distribution of groundwater EC in terms of seawater intrusion in the coastal region of Banda Aceh.
The result of the EC groundwater-surface showed that the spatial distribution of seawater intrusion in the coastal area of Banda Aceh was spread in the northern part of Banda Aceh (start from Meuraksa sub-district, Kuta Raja sub-district, some regions of Kuta Alam district, to Syiah Kuala sub-district).
Generally, the level of seawater intrusion in the study area was still modest. The effect on groundwater quality was not too significant in most coastal regions of Banda Aceh (Meuraksa, Kuta Raja, Kuta Alam, and Syiah Kuala sub-district). However, a higher groundwater EC value was found in some locations further from the coastline (Baiturrahman sub-district) that can be caused by other external factors such as the formation of aquifer, rock lithology composition, minerals content, and so on.
ACKNOWLEDGEMENT
This research is part of the first author's thesis. We extend our thanks to the Department of Physics, Faculty of Mathematics and Natural Sciences at Syiah Kuala University for all the facilities and assistance that support this research activity. Our thanks to Dr. Faisal, S. Si, M.Sc; Dr. Muhammad Isa, S. Si, M. Si; and Dr. Suhrawardi Ilyas, S. Si, M.Sc who provided guidance, direction, and input in this study. Also, we thanked the editor and the reviewers for their constructive comments and suggestions.
REFERENCES
[1] Liu, L. 2016. Saline water intrusion.
Encyclopedia of Life Support Systems, Natural and Human Induced Hazards2 1-7. [2] Afrianita, R.; Edwin, T.; Alawiyah, A. 2017.
Analisis intrusi air laut dengan pengukuran Total Dissolved Solids (TDS) air sumur gali di
Kecamatan Padang Utara. Jurnal Teknik Lingkungan UNAND 14 62 – 72.
[3] Cahyadi, A.; Adji, T.N.; Marfai, M.A.; Noviandaru, S.; Agniy, R. F. 2017. Analisis dampak intrusi air laut terhadap air tanah di pulau Koral Pramuka. Majalah Geografi Indonesia
31 61-64.
[4] Burrough, P.A.; Mc Donnel, R.A. 1998.
Principles of geographical information systems. (New York: Oxford University Press).
[5] Johnston, K.; VerHoef, J. M.; Krivoruchko, K.; Lucas, N. 2001.
Using ArcGIS geostatistical analyst. (New York: United States of America). [6] Gunarathna, M. H. J. P.; Kumari, M. K.
N.; Nirmanee, K. G. S. 2016. Evaluation of interpolation methods for mapping pH of groundwater.
IJLTEMAS5 1-5.
[7] Wang, S.; Huang, G. H.; Lin, Q. G.; Li, Z.; Zhang, H.; Fan, Y. R. 2014. Comparison of interpolation methods for estimating spatial distribution of precipitation in Ontario, Canada. Int. J. Climatol. 34 3746-3750.
[8] Sun, Y.; Kang, S.; Li, F.; Zhang, L. 2009. Comparison of interpolation methods for depth to groundwater and its temporal and spatial variations in the Minqin oasis of Northwest China.
Environ. Modell. Softw. 10 1163-1170. [9] Murphy, R. R.; Curriero, F. C.; Ball, W.
P.; ASCE, M. 2010. Comparison of spatial interpolation methods for water quality evaluation in the Chesapeake Bay. J. Environ. Eng. 136(2) 160-171. [10] Hussain, I.; Shakeel, M.; Faisal, M.; Soomro, Z.A.; Hussain, T. 2014. Distribution of total dissolved solids in drinking water by means of Bayesian Kriging and Gaussian spatial predictive process water quality. Water Qual. Expo. Health6 177-185. [11] Mirzaei, R. and Sakizadeh, M. 2015.
Comparison of interpolation methods for the estimation of groundwater contamination in Andimeshk Shush Plain Southwest of Iran. Environ. Sci. Pollut. Res.23 2758-2769.
[12] Sriyono; Qudus, N.; Setyowati, D. L. 2008. Model spasial ketersediaan air tanah dan intrusi air laut untuk penentuan zona konservasi air tanah. (Semarang: Universitas Negeri Semarang).
Vol. 20 | No. 2 | June 2020 30 [13] Purnomo, N. A.; Wahyudi; Suntoyo. (2013).
Studi pengaruh air laut terhadap air tanah di wilayah pesisir Surabaya Timur. Jurnal Teknik POMITS1 1 – 5.
[14] Nagelkerke, N. J. D. 1991. A note on a general definition of the coefficient of determination. Biometrika78 691-692. [15] Bhunia, G.S.; Shit, P.K.; Maiti, R. 2015.
Comparison of GIS-based interpolation methodsfor spatial distribution of soil organic carbon (SOC). J. Saudi Soc. Agri. Sci.17 114-123.
[16] Adhikary, P.P. and Dash, C.J. 2017. Comparison of deterministic and stochastic methods to predict spatial variation of groundwater depth. Appl. Water Sci.7 339-348.
[17] Fadel, M.; Tomaszkiewicz, M.; Adra, Y.; Sadek, S.; Najm, M. A. (2014). GIS-based assessment for the development of a groundwater quality index towards sustainable aquifer management. Water Resour. Manag.10 2-9.
[18] Gnanachandrasamy, G.; Ramkumar, T.; Venkatramanan, S.; Vasudevan, S.; Chung, S. Y.; Bagyaraj, M. 2015. Accessing groundwater quality in lower part of Nagapattinam district,
Southern India: using
hydrogeochemistry and GIS interpolation techniques. Appl. Water Sci.5 39 -55.