IMPROVING INTERNET CONGESTION CONTROL AND
QUEUE MANAGEMENT ALGORITHMS
by
Wu-chang Feng
A dissertation submitted in partial fulfillment of the requirements for the degree of
Doctor of Philosophy
(Computer Science and Engineering) in The University of Michigan
1999
Doctoral Committee:
Professor Kang G. Shin, Chair Assistant Professor Peter Chen Associate Professor Farnam Jahanian Assistant Professor Sugih Jamin Dilip Kandlur, Manager, IBM Research Assistant Professor Kimberly Wasserman
c
Wu-chang Feng 1999
ACKNOWLEDGEMENTS
Throughout my graduate school career, I’ve been fortunate enough to have the help and support of a large number of people. I would especially like to thank
Professor Kang Shin, my advisor, for giving me a chance to “walk on” to his team of
re-searchers, for his patience in allowing me to explore different avenues of research, and for his guidance throughout the years.
Dilip Kandlur and Debanjan Saha for giving me the invaluable opportunity to work at IBM
Research. Thanks also to the IBM Corporation for their generosity and financial support over the last two years.
Professors Peter Chen, Farnam Jahanian, Sugih Jamin, and Kimberly Wasserman, my
com-mittee members, for their insightful comments on the dissertation. Special thanks to Farnam for his technical and academic guidance and to Sugih for pushing me to go the extra mile in finishing the thesis.
The National Science Foundation, the Office of Naval Research, and the Defense Advanced
Research Projects Agency, for their initial financial support.
Jim Dolter, Jennifer Rexford, and Ashish Mehra, for all of their technical and academic help
and for teaching me the arcane ways of being a graduate student in computer science.
Scott Dawson, Todd Mitton, Anees Shaikh, Tarek Abdelzaher, Rob Malan, and Steve Vlaovic,
for their many useful and insightful discussions about networking and other random topics.
B.J. Monaghan for making everything around RTCL run so smoothly and for the many years
of betting on the PSU/MSU football games. Blow-pops never tasted so good.
YF, for all of the help and support throughout the year. Food never tasted so good.
930 Dewey (the house that ultimate built) and MagnUM, for a great run at Nationals and for
always reminding me that there’s more to life than work.
Finally, I would most like to thank my parents, Tse-yun and Elaine, and my brothers, Wu-chun, Wu-chi, and Wu-che for their continual encouragement, guidance and support. This thesis is a testament to our many years of academic perseverance.
TABLE OF CONTENTS
DEDICATION . . . . ii
ACKNOWLEDGEMENTS . . . . iii
LIST OF TABLES . . . . vii
LIST OF FIGURES . . . . viii
CHAPTERS 1 INTRODUCTION . . . 1
1.1 Congestion Control in the Internet . . . 1
1.2 Quality of Service in the Internet . . . 2
1.3 Structure of Thesis . . . 3
2 BACKGROUND . . . 5
2.1 TCP and Active Queue Management . . . 5
2.2 Integrated and Differentiated Services . . . 10
3 TECHNIQUES FOR ELIMINATING PACKET LOSS IN CONGESTED TCP/IP NETWORKS . . . 14
3.1 Introduction . . . 14
3.2 Active Queue Management . . . 15
3.2.1 Traffic load and early detection . . . 16
3.2.2 Avoiding deterministic congestion notification . . . 19
3.2.3 Adaptive RED . . . 20
3.2.4 Round-trip time sensitivity . . . 23
3.2.5 Implementation . . . 25
3.2.6 Using packet loss for congestion notification . . . 27
3.3 End Host Congestion Control . . . 30
3.3.1 Adjusting the minimum transmission rate . . . 31
3.3.2 Adjusting linear increase . . . 33
3.4 Tuning for Optimal Performance . . . 37
3.5 Conclusion and Future Work . . . 39
4 BLUE: A NEW CLASS OF ACTIVE QUEUE MANAGEMENT ALGORITHMS 42 4.1 Introduction . . . 42
4.2 The Inadequacy of RED . . . 43
4.3.1 The algorithm . . . 46
4.3.2 Packet loss rates using REDand BLUE . . . 47
4.3.3 Understanding BLUE . . . 49
4.3.4 The effect ofECNtimeouts . . . 52
4.3.5 Implementation . . . 53
4.4 Stochastic Fair BLUE . . . 55
4.4.1 The algorithm . . . 56
4.4.2 Evaluation . . . 58
4.4.3 Limitations ofSFB . . . 60
4.4.4 SFBwith moving hash functions . . . 63
4.4.5 Round-trip time sensitivity . . . 66
4.5 Comparisons to Other Approaches . . . 67
4.5.1 REDwith penalty box . . . 67
4.5.2 FRED . . . 68
4.5.3 REDwith per-flow queueing . . . 69
4.5.4 Stochastic Fair Queueing . . . 69
4.5.5 Core-Stateless Fair Queueing . . . 69
4.6 Conclusion and Future Work . . . 70
5 UNDERSTANDING TCP DYNAMICS IN A DIFFERENTIATED SERVICES IN-TERNET . . . 72
5.1 Introduction . . . 72
5.2 Integrated Services . . . 74
5.2.1 Policing and marking . . . 74
5.2.2 Packet handling . . . 75
5.3 UnderstandingTCPDynamics . . . 77
5.3.1 Effect of service rate . . . 78
5.3.2 Effect of token bucket depth . . . 81
5.4 TCPAdaptations . . . 83
5.4.1 Timed transmissions . . . 83
5.4.2 Rate adaptive windowing . . . 86
5.5 Fine-Grained Timers . . . 89 5.5.1 Timer overheads . . . 89 5.5.2 Buffer requirements . . . 90 5.6 Transient Behavior . . . 91 5.7 Path of Evolution . . . 93 5.8 CBQand ERED . . . 95 5.9 Conclusions . . . 97
6 ADAPTIVE PACKET MARKING FOR PROVIDING DIFFERENTIATED SER-VICES IN THE INTERNET . . . 99
6.1 Introduction . . . 99
6.2 Service Model . . . 101
6.3 Source Transparent Marking . . . 103
6.3.1 TCP-independent marking . . . 104
6.3.2 TCP-friendly marking . . . 106
6.3.3 Marking aggregates . . . 108
6.5 Deployment Issues . . . 114
6.5.1 Handling oversubscription . . . 114
6.5.2 Dealing with non-responsive flows . . . 116
6.5.3 Handling heterogeneity . . . 119
6.6 Conclusions . . . 122
7 CONCLUSION . . . 124
LIST OF TABLES
Table
4.1 SFBloss rates in
Mbs
(one non-responsive flow) . . . 604.2 SFBloss rates (one non-responsive, one oscillating flow) . . . 66
LIST OF FIGURES
Figure
2.1 Example ofTCPcongestion window behavior . . . 7
2.2 TCP/IP headers . . . 8
2.3 The marking/dropping behavior of RED . . . 9
2.4 DIFFSERV architecture . . . 11
3.1 Network topology . . . 16
3.2 Aggressive early detection (
max
p
= 0.250) . . . 173.3 Conservative early detection (
max
p
= 0.016) . . . 183.4 Impact of early detection aggressiveness on RED-ECN . . . 19
3.5 Impact of
max
th
and queue size . . . 203.6 Adaptive REDalgorithm . . . 21
3.7 The marking/dropping behavior of Adaptive RED . . . 21
3.8 Static random early detection . . . 21
3.9 Adaptive RED . . . 22
3.10 Network topology with varying round-trip times . . . 24
3.11 Static random early detection over varying round-trip times . . . 24
3.12 Adaptive REDover varying round-trip times . . . 24
3.13 Testbed . . . 25
3.14 Queue management performance . . . 26
3.15 Impact of early detection aggressiveness on RED . . . 27
3.16 Example network . . . 29
3.17 SUBTCP algorithm . . . 30
3.18 Network topology . . . 32
3.19 Minimum sending rates and the performance ofTCP . . . 33
3.20 Queue plots for decreased segment size and increased window size . . . 34
3.21 Scaled sub-linear SUBTCPalgorithm . . . 35
3.22 Bandwidth-based SUBTCPalgorithm . . . 36
3.23 Performance of modified linear-increase algorithms . . . 37
3.24 Sub-linear SUBTCPperformance . . . 38
3.25 Performance across traffic load . . . 39
3.26 Performance comparisons . . . 40
3.27 Extension to Adaptive RED . . . 41
4.1 REDexample . . . 44
4.3 The BLUEalgorithm . . . 46
4.4 Network topology . . . 47
4.5 Packet loss rates of REDand BLUE . . . 48
4.6 Queue length plots of REDand BLUE . . . 50
4.7 Marking behavior of RED . . . 51
4.8 Marking behavior of BLUE(
p
m
) . . . 524.9 Queue length plots of REDand BLUEwithECNtimeouts . . . 53
4.10 Marking behavior withECNtimeouts . . . 54
4.11 Performance of REDand BLUEwithECNtimeouts . . . 55
4.12 Experimental testbed . . . 56
4.13 Queue management performance . . . 57
4.14 SFBalgorithm . . . 58
4.15 Example ofSFB . . . 59
4.16 Bandwidth ofTCPflows usingSFB(45
Mbs
flow) . . . 614.17 Bandwidth ofTCPflows using REDandSFQ (45
Mbs
flow) . . . 624.18 Probability of misclassification . . . 63
4.19 Bandwidth ofTCPflows usingSFB . . . 64
4.20 Bandwidth ofTCPflows using modifiedSFBalgorithms . . . 65
4.21 Bandwidth ofTCPflows (one non-responsive, one oscillating flow) . . . 67
4.22 Bandwidth ofTCPflows over varying round-trip times. . . 68
5.1 Network topology . . . 77
5.2 Effect of reservation on end-to-end throughput. . . 78
5.3 Packet trace of4
Mbs
connection. . . 805.4 Compliant throughput of4
Mbs
connection over various token buckets. . . 815.5 Timed transmission algorithm. . . 84
5.6 Throughput with timer-triggered transmissions. . . 85
5.7 Rate adaptive windowing algorithm. . . 87
5.8 Throughput with timer and windowing modifications. . . 88
5.9 Throughput of4
Mbs
connection over various timer intervals. . . 905.10 Dynamics of unmodifiedTCP. . . 91
5.11 TCPwith timer and windowing modifications. . . 92
5.12 All nodes using drop-tail queues. . . 93
5.13 Effect of selective reservation. . . 94
5.14 CBQexperiment. . . 96
6.1 Packet marking scenarios . . . 101
6.2 TCPindependent algorithm . . . 104
6.3 Network topology. . . 105
6.4 Effect of external packet marking. . . 106
6.5 Burstiness of packet marking schemes . . . 107
6.6 TCP-friendly algorithm for changing
P
mark
. . . 1086.7 Performance ofTCP-friendly algorithm. . . 109
6.8 Bandwidth sharing using source-transparent marking . . . 110
6.9 CustomizedTCPcongestion window opening. . . 111
6.11 Bandwidth sharing using source-integrated marking . . . 113
6.12 TCPwith integrated packet marking . . . 114
6.13 TCPwith transparent packet marking . . . 115
6.14 Oversubscription . . . 116
6.15 Oversubscription and multiple priorities . . . 117
6.16 Network topology . . . 118
6.17 Non-responsive flows . . . 119
6.18 Performance over an all drop-tail network . . . 120
CHAPTER 1
INTRODUCTION
The success of the Internet can largely be attributed to the strength of its protocols. By providing users and developers with robust, interoperable services, the Internet has effectively provided all of the essential building blocks for constructing applications such as theWWW. As one looks at almost
all of the applications in widespread deployment on the Internet today, it is no coincidence that they are all built uponTCP/IP. Over the last decade, TCP/IP has consistently met the challenge of new
applications and has been able to provide a solid foundation from which to build them.
With the rapid proliferation of theWWW, the Internet has seen an enormous growth in both the demand for access from its users and in the demand for new services from its applications. As a result of these new challenges, weaknesses in TCP/IP have become increasingly apparent. Rising
packet loss rates and decreasing network efficiency have caused significant problems to users. In addition, the inability to support new services has severely hindered the widespread deployment of bandwidth-sensitive applications. This thesis focuses on these extremely important challenges to today’s Internet and describes how current congestion control and queue management techniques can be modified to solve them.
1.1
Congestion Control in the Internet
At the heart ofTCP/IP’s success over the last decade is its ability to deliver service in times of extremely high demand. The key reason behind this isTCP’s congestion control mechanisms [34]. The idea behindTCP congestion control is to control network load by having sources adjust their
or observes packet loss based on information on the packets which it has sent, it backs off its sending rate in order to avoid further packet loss and congestion. If aTCPsource observes that all of
its packets are being delivered, it slowly increases its sending rate in order to fully utilize network capacity. In this way, TCP has been able to effectively minimize packet loss while maximizing
network utilization over the last decade.
Recently, as demand for access has outpaced the ability for providers to upgrade network paths, the ability ofTCPto provide best-effort service efficiently has deteriorated. In particular, an alarming rise in packet loss rates has been observed across a number of network links [53]. This rise in packet loss has resulted in the steady decline of network efficiency as sources and routers continually generate and forward packets which are then dropped. In order to address the steady rise in packet loss rates in the Internet, the Internet Engineering Task Force (IETF) is considering the deployment of Explicit Congestion Notification (ECN) [23, 55] and active queue management [4, 26] as a means
to prevent packet loss. The idea behind ECN is to give the network the ability to explicitly signal
TCPsources of congestion and to have theTCP sources reduce their transmission rates in response to the signal. Since TCP sources currently only reduce their transmission rates upon detecting a packet loss, withoutECN, the amount of packet loss observed across the Internet will always remain non-zero. WhileECN provides the network a mechanism for reducing packet loss, it must be used in conjunction with active queue management in order to be effective. The goal of active queue management is to detect congestion early and to convey congestion notification to sources before queue overflow and packet loss occur. By decoupling congestion notification from packet loss and using active queue management mechanisms, it is the hope of the IETFthat packet loss rates in the Internet can be controlled.
1.2
Quality of Service in the Internet
The service realized byTCP over today’s Internet is commonly known as “best-effort”. Using simple FIFO queueing in the network combined with TCP congestion control at the end points,
sources maintain approximate fairness between themselves when they are multiplexed over the same bottleneck link. As the need for new services has grown, the lack of service differentiation in the network has become problematic. As a result, a growing number of applications such as multimedia
streaming applications continually circumvent TCPand its congestion control mechanisms in favor ofUDP and their own rate control mechanisms.
In an attempt to address the growing needs of applications, theIETFhas developed a number of architectural enhancements to the current Internet infrastructure which allow the network to provide predictable services to applications on an end-to-end basis. The result of this effort has been the standardization of the Resource Reservation Setup Protocol (RSVP) [6, 69] and its associated suite of service classes [59, 68]. In this approach, individual applications signal their resource require-ments to the network on an end-to-end basis. Given this, intermediate network elerequire-ments (routers, switches, etc.) set aside the appropriate amount of resources for the application. When subsequent packets arrive at each network element, they are then scheduled in a manner which satisfies the requirements of the application. While this service architecture provides a solid foundation for providing different classes of service in the Internet, it mandates fairly significant changes to the network. In addition, support for such services can add a significant amount of overhead in packet processing within the network. Because of this, theIETF is also considering a more evolutionary approach to provide service differentiation in the Internet. This approach, as outlined by the Differ-entiated Services (DIFFSERV) working group, relies on the use of the type-of-service bits (ToS) bits in theIPheader [2, 13, 54, 58] to provide coarse-grained quality of service to applications. The goal of the DIFFSERV effort is to define a minimal set of building blocks which can be used to construct
a variety of services to emerging applications.
1.3
Structure of Thesis
This thesis presents effective techniques for supporting an explosion in the number of users and for supporting a myriad of new applications which require more out of the network than the best-effort service the current Internet infrastructure affords. Chapter 2 surveys related work on controlling congestion and on providing quality of service in the Internet. Chapter 3 and Chapter 4 address the problem of maximizing network efficiency in times of extremely heavy congestion. Chapter 3 demonstrates a significant weakness in current active queue management techniques in that they are not sensitive to the level of congestion in the network. In order to address this short-coming, an adaptive queue management algorithm which can effectively reduce packet loss over
a wide range of workloads is developed, implemented and evaluated. While adaptive queue man-agement provides some benefit, Chapter 3 also shows that high packet loss rates are, in part, an artifact of TCP congestion control. As a result, a conservative modification to TCP’s congestion control algorithm is proposed and evaluated. Together, these two modifications can provide an
or-der of magnitude improvement in packet loss rates using a significantly smaller amount of buffer
space in the network. Chapter 4 extends this work by addressing several problems with current ac-tive queue management algorithms. In particular, this chapter demonstrates that the dependence on queue lengths to perform congestion management is inherently flawed. To address this limitation, BLUE, a fundamentally different active queue management algorithm is proposed, implemented, and evaluated. This algorithm outperforms all current active queue management algorithms by a large margin in terms of packet loss rates and buffer space requirements. In addition, this chapter also proposes an extension to BLUEwhich allows the network to scalably enforce fairness between
a large number connections. This extension uses an extremely small amount of buffer space and state.
Chapter 5 and Chapter 6 address the problem of supporting quality of service across the Inter-net. In particular, these chapters focus on building scalable, deployable mechanisms for support-ing bandwidth guarantees across the Internet based on the DIFFSERV approach. Chapter 5 first demonstrates how DIFFSERV-style mechanisms can be ineffective in providing predictable service
to applications. One of the major problems is that the end-to-end rate control mechanism ofTCPis disjunct from the rate-based marking being done in the network. In order to address this problem, this chapter proposes and evaluates several modifications to the congestion control mechanisms at the end host in order to fully take advantage of DIFFSERV-marking in the network and to deliver predictable service to applications. Chapter 6 extends this work by developing an architecture for providing soft bandwidth guarantees in a scalable, easily deployable, manner. In particular, the the bandwidth sharing and marking behavior of connections using DIFFSERV-style marking is analyzed
and some of the weaknesses of current approaches are shown. This chapter then describes novel mechanisms for integrating packet marking into end hosts in order to (1) obtain optimal marking rates between sources, (2) detect heterogeneity and lack of service differentiation in the network, and (3) allow for incremental deployment. Finally, Chapter 7 concludes with a summary of research contributions.
CHAPTER 2
BACKGROUND
This chapter reviews the important features of today’s congestion control and queue manage-ment algorithms as well as the current state of providing quality of service in the Internet.
2.1
TCP and Active Queue Management
It is important to avoid high packet loss rates in the Internet. When a packet is dropped before it reaches its destination, all of the resources it has consumed in transit are wasted. In extreme cases, this situation can lead to congestion collapse [34]. Loss rates are especially high during times of heavy congestion, when a large number of connections compete for scarce network bandwidth. With the explosion of the WWW, recent measurements have shown that the growing demand for
network bandwidth has driven loss rates up across a number of congested links in the Internet [53]. When a network is congested, a large number of connections compete for a share of scarce link bandwidth. Over the last decade, TCP congestion control has been used to effectively regulate the rates of individual connections sharing network links. TCP congestion control is window-based. The sender keeps a congestion window (CWND) whose size limits the number of unacknowledged packets the sender can have outstanding in the network. Upon receiving acknowledgments for successfully transmitted data, the sender increases its transmission rate by incrementing the size of its congestion window. At some point in time, the rate at which TCP sends its packets eventually exceeds the network’s capacity to deliver them. When this happens, queues build up in the network routers and overflow, causing packets to be dropped. TCP assumes that all packet loss is due to
algorithm is fairly straightforward. When a connection starts up, it attempts to ramp up its sending rate quickly by exponentially increasing its congestion window until it reaches an implementation-specific value (SSTHRESH). This stage is called slow-start and allows the source to double its congestion window, and thus its sending rate, every round-trip time. In order to prevent excessive losses due to an exponentially-increasing sending rate,TCPsenders typically employ what is known as the congestion-avoidance algorithm [34, 61], a modification toTCPfirst deployed in Reno variants ofTCP. In this algorithm,TCPuses theSSTHRESHvalue to approximate the window size which the network can support. When the window size exceeds this threshold, TCP enters the congestion
avoidance phase. In this phase, the window is increased at a much slower rate of one segment per round-trip time. When the offered load increases above network capacity, packets are eventually dropped. One way in whichTCPdetects a packet loss is through the receipt of a number of duplicate cumulative acknowledgments from the receiver [35]. Upon receiving a given number of duplicate acknowledgments, TCPinfers that a packet loss has occurred and immediately reduces its sending rate in half by halving its congestion window and setsSSTHRESHto the new value of the congestion window. These mechanisms are called fast retransmit and fast recovery.
When congestion is severe enough such that packet loss cannot be inferred in such a manner,
TCP relies on a separate, retransmission timeout mechanism to trigger subsequent retransmissions of lost packets. When a retransmission timeout occurs,TCPreduces its window size to one segment
and retransmits the lost segment. To prevent continual retransmissions in times of severe congestion and network outages,TCP employs an exponential back-off algorithm. In particular, if the sender continually sends the same segment, but receives no acknowledgments for it, TCP doubles its re-transmission timeout interval. Upon receipt of an acknowledgment for subsequent new segment,
TCPresets the timeout interval and resumes its normal sending.
Figure 2.1 shows a graphical picture of howTCPslow-start and congestion avoidance work. As the figure shows,TCP initially starts with a congestion window of 1. The window is then doubled
every round-trip time. When the congestion window reaches SSTHRESH, TCP slows its rate of increase. Eventually, when the transmission rate of the connection overwhelms the bottleneck link, packets are dropped. This loss is detected by TCP which then reacts by halving the congestion window (assuming the fast-retransmit and fast-recovery mechanisms are triggered). As the figure shows, upon recovering from congestion, the TCP sender enters the congestion avoidance phase
Congestion Window Time RTT RTT 4 2 1 ssthresh RTT W/2 3W/2 W
Figure 2.1: Example ofTCPcongestion window behavior
in which the window is increased linearly at a rate of one segment per round trip time. In steady state,TCPthen oscillates between a window of
W
andW
2
where
W
depends on the capacity of the network and the number of connections currently active over the bottleneck link.Given the importance ofTCP and its congestion control mechanisms to the health of the
Inter-net, there have been a number of proposed modifications to its algorithms. One modification which has been proposed is selective acknowledgments (SACK) [45]. SACK augments TCP’s cumula-tive acknowledgment mechanism with additional information that allows the receiver to inform the sender which segments it is missing. By specifying this information, theTCPsender can make more intelligent decisions in determining when packets have been lost and in identifying which segments should be retransmitted. This helps TCP detect congestive loss more quickly and eliminates
un-necessary retransmissions by TCP senders. Another set of proposedTCP modifications focuses on congestion recovery. TCP is ACK-clocked, often sending only after it has received acknowledg-ments for previously transmitted packets. When there are insufficient packets or acknowledgacknowledg-ments in flight to triggerTCPsends, a retransmission timeout must occur before theTCPsource can resume
sending. Because the Reno variant of TCP freezes its window while recovering from congestion, it often induces a subsequent retransmission timeout since the source does not send packets upon receiving acknowledgments in the recovery phase. To address this problem, a simple observation is made. When aTCP sender receives any type of acknowledgment, it is a signal that a packet has
16-bit identification 3-bit
32-bit source IP address
32-bit destination IP address
16-bit header checksum 13-bit fragment offset 16-bit total length (in bytes)
flags 4-bit header
length 4-bit
version
8-bit time to live (TTL) 8-bit protocol
S F I R S P T Y N N H S A C K U R G
16-bit source port number 16-bit destination port number
32-bit sequence number
32-bit acknowledgment number
4-bit header
length Reserved
16-bit TCP checksum 16-bit urgent pointer 16-bit window size
IP
TCP
ECN Echo CWR
8-bit Type of Service/DS Field C E T E C DSCP Figure 2.2: TCP/IPheaders
left the network and should thus allow theTCPsender to inject an additional packet without causing further congestion. This modification allowsTCPto maintain its ACK-clocking and prevents unnec-essary retransmission timeouts. Both the FACK [44] and NewReno [24, 32] modifications use this observation to improveTCPperformance. Finally, more radical changes toTCP’s congestion control algorithms have been proposed. In current incarnations of TCP, the congestion window follows a
sawtooth-like pattern where the congestion window is continually increased until packet loss occurs. While this allowsTCPto probe for additional bandwidth, such behavior eventually induces packet loss. The idea behind the Tri-S [66, 67] and Vegas [7] modifications is to change the congestion avoidance phase so that it only performs its linear increase when the network is not congested. In both algorithms, if the round-trip times indicate an increase in delay due to queues being built up in the network, theTCP source either decreases or fixes the size of the congestion window rather than increasing it. While these mechanisms have the potential for improving loss rates in the Internet, it is unclear how well each scheme performs when congestion is persistent. In addition, by modifying the linear-increase/multiplicative-decrease algorithm ofTCP, these modifications cannot ensure that max-min fair sharing occurs between connections which are multiplexed across the link [8, 38].
With the exception of Tri-S and Vegas, one of the problems with theTCP congestion control
minth maxth Dropping/Marking Probability 0
Average Queue Length
1
max p
Figure 2.3: The marking/dropping behavior of RED
after detecting packet loss due to queue overflow. This is a problem since a considerable amount of time may pass between when the packet is dropped at the router and when the source actually detects the loss. In the meantime, a large number of packets may be dropped as sources continue to transmit at a rate that the network cannot support. Because of this, theIETF is advocating the use of explicit congestion notification (ECN) [23, 55] and active queue management as a means to prevent packet loss. The idea behind ECN is to decouple packet loss from congestion notification. In this proposal,ECNis implemented using two bits of the type-of-service/DS field of theIPheader and two bits of the currently reserved flags field of theTCPheader as shown in Figure 2.2. When a
network router experiences congestion, it can explicitly signal the sources instead of dropping their packets. In order to do so, the router first examines the ECN-capable Transport bit (ECT) to see if the flow is ECN-capable. If it is notECN-capable, the packet is simply dropped. If the flow is
ECN-capable, the congestion experienced bit (CE) is set and used as a signal to theTCPreceiver that
congestion has occurred. The TCPreceiver, upon receiving this signal, modifies theTCP header of the return acknowledgment using a currently unused bit in theTCPflags field. As Figure 2.2 shows, a bit labeled “ECN-echo” is used by theTCP receiver to indicate the presence of congestion to the sender. Upon receipt of aTCPsegment with theECN-echo bit set, theTCPsender invokes congestion control mechanisms as if it had detected a packet loss. In addition, it sets the “Congestion Window Reduced” (CWR) bit of its next packet to the receiver in order to signal the receiver that it has, in fact, reduced its sending rate.
In conjunction with ECN, the IETF is also advocating the use of active queue management. The idea behind active queue management is to detect incipient congestion early and to convey congestion notification to the end hosts, in order to allow them to reduce their transmission rates before queue overflow and packet loss occur. One form of active queue management being proposed by theIETFfor deployment in the network is RED(Random Early Detection) [4, 26]. REDmaintains an exponentially weighted moving average (EWMA) of the queue length which it uses to detect congestion. RED detects increases in the average queue length and uses it to determine whether or not to drop or ECN-mark a packet. More specifically, Figure 2.3 plots the marking/dropping
probability of REDas a function of the average queue length. As the figure shows, when the average queue length exceeds a minimum threshold (
min
th
), packets are randomly dropped or marked with a given probability. A connection receiving congestion notification in the form of an ECN mark, cuts its congestion window in half as it would if it had detected a packet loss. The probability that a packet arriving at the RED queue is either dropped or marked depends on, among other things, the average queue length and an initial probability parameter (max
p
). As Figure 2.3 shows, the calculated marking/dropping probability is a linear function of the average queue length. The probability is 0 when the average queue length is less than or equal tomin
th
and linearly increases tomax
p
when the average queue length approaches a maximum threshold (max
th
). When the average queue length exceedsmax
th
, all packets are dropped or marked.With the deployment ofECN and RED, it is the hope of theIETF that packet loss rates in the Internet can be controlled. Unfortunately, as Chapter 3 and Chapter 4 show, there are significant weaknesses in both TCP congestion control and in REDqueue management which prevent packet loss from being eliminated. Given these weaknesses, a number of congestion control and queue management algorithms which effectively prevent packet loss are proposed and evaluated.
2.2
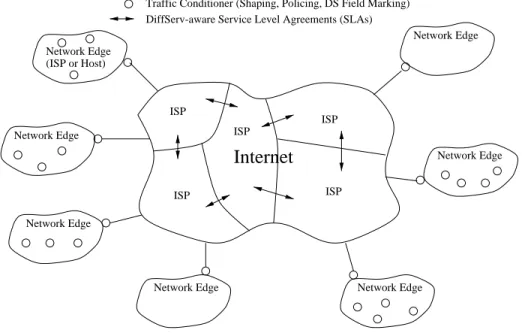
Integrated and Differentiated Services
As the Internet evolves, the number of diverse applications being deployed has increased signif-icantly. Unfortunately, many of these applications require more stringent performance guarantees in terms of bandwidth and end-to-end delay than the current Internet infrastructure and its best-effort service provide [5, 12]. Because the best-effort service model in place today cannot support every
Network Edge (ISP or Host)
Network Edge
Network Edge
Network Edge Network Edge
Network Edge Network Edge
Internet
ISP ISP ISP ISP ISPDiffServ-aware Service Level Agreements (SLAs) Traffic Conditioner (Shaping, Policing, DS Field Marking)
Figure 2.4: DIFFSERV architecture
application, a great deal of effort has been taken to construct additional services in order to meet the demands of new applications.
In an attempt to enrich and augment the services provided by the network, the Internet Engineer-ing Task Force (IETF) has developed a number of architectural extensions that permit the allocation of different levels of service to different users. One of the outcomes of this effort is an architec-ture that provides service discrimination by explicit allocation and scheduling of resources in the network. This model, based on the Resource Reservation Setup Protocol (RSVP) [6, 69] and its as-sociated suite of service classes [59, 68], is the Internet incarnation of the traditional “circuit-based” quality of service architecture. While this service architecture provides a solid foundation for pro-viding different classes of service in the Internet, it mandates significant changes to the Internet infrastructure. Because of this, a more evolutionary approach to provide service differentiation in the Internet using the type-of-service (ToS) bits in the IPheader [2, 13, 54, 58] has recently gained
a lot of momentum. Through the Differentiated Services (DIFFSERV) working group, these bits, as shown in Figure 2.2, have been renamed as the “DS field” and the functions associated with them have been redefined. The crux of the DIFFSERV approach is to standardize a simple set of mechanisms for handling packets with different priorities [3, 11, 19, 50], as encoded in the DS field of theIP header. Figure 2.4 shows the basic architecture of the DIFFSERV approach. As the figure
shows, traffic conditioners such as shapers, DS-markers, and droppers are placed at the edges of the network. Given this functionality at the edge, the interior routers then use the priority markings of packets in order to deliver differentiated services to various packets. This provides a very basic QoS architecture in which most of the complexity is pushed to the edges of the network where it is the most scalable.
Because of the limited amount of bits available for use in the DS field, the DIFFSERV working group has defined a small set of building blocks which are used by routers to deliver a number of services. These building blocks, called per-hop behaviors (PHBs), are encoded in the Differentiated Services Codepoint (DSCP) part of the DS field and specify the forwarding behavior each packet receives by individual routers in the Internet. When used on an end-to-end basis, it is envisioned that these building blocks can be used to construct a variety of services which are able to support a range of emerging applications. Among the initial PHBs being standardized are the Expedited Forward-ing (EF) [37] and the Assured ForwardForward-ing (AF) [31] PHBs. The EF PHB specifies a forwardForward-ing behavior in which packets see a very small amount of loss and a very low queueing delay. In order to ensure every packet marked with EF receives this service, EF requires every router to allocate enough forwarding resources so that the rate of incoming EF packets is always less than or equal to the rate at which the router can forward them. In order to preserve this property on an end-to-end basis, EF requires that traffic be shaped and reshaped in the network. The AF PHB group, on the other hand, specifies a forwarding behavior in which packets see a very small amount of loss. The AF PHB group consists of four, independently forwarded classes. Within each class, two or three drop preference levels are used to differentiate between flows in the class. The idea behind AF is to preferentially drop best-effort packets and packets which are outside of their contract when con-gestion occurs. By limiting the amount of AF traffic in the network and by managing the best-effort traffic appropriately, routers can then ensure low loss behavior to packets marked with the AF PHB. While it is relatively clear how to build predictable services using the protocols and mechanisms provided by RSVP and INTSERV, the ability to construct predictable services using the coarse-grained mechanisms provided by DIFFSERV is an open issue. Since DIFFSERV specifies only the local forwarding behavior given to packets at individual routers, one of the biggest challenges is to be able to concatenate DIFFSERVmechanisms on an end-to-end basis to construct useful services for
end-to-end services using DIFFSERV mechanisms based on the AF PHB. Key among these problems is the complex interaction of current congestion control and queue management algorithms with the priority marking and handling of packets in the network. As a result of these problems, an architecture and a number of mechanisms are described which allow applications to effectively take advantage of DIFFSERV support.
CHAPTER 3
TECHNIQUES FOR ELIMINATING PACKET LOSS IN
CONGESTED TCP/IP NETWORKS
3.1
Introduction
As described in Chapter 2, one of the reasons for high packet loss rates is the failure of the network to provide early congestion notification to sources. This has led to proposals for active queue management such as REDand variations thereof [26, 41]. While REDcertainly outperforms traditional drop-tail queues, this chapter shows that it is difficult to parameterize RED queues to perform well under different congestion scenarios. The key problem is that congestion notification does not directly depend on the number of connections multiplexed across the link. In order for early detection to work, congestion notification must be given at a rate which is high enough to prevent packet loss due to buffer overflow, while low enough to prevent underutilization of the bottleneck link.
This chapter demonstrates the ineffectiveness of the current REDqueue management algorithm and shows how REDqueues can be self-parameterized depending on traffic load in order to reduce packet loss and maintain high link utilization. While adaptive queue management techniques can provide some benefit, high loss rates at heavy loads are, in part, an artifact of TCP’s congestion control algorithm. When a large number of small TCP connections share a common bottleneck, the traffic generated can cause rapid fluctuations in queue lengths which result in packet loss. This chapter also investigates several ways of modifyingTCP’s congestion control mechanism in order to make the aggregate traffic generated by a large number of TCP connections better-behaved. In
particular, using a scaled linear increase or a bandwidth-based linear increase in the window size, instead of the linear increase algorithm used byTCP, is shown to substantially reduce packet losses.
When used together, the adaptive queue management mechanisms and the proposed enhancements toTCP’s windowing algorithm can effectively eliminate packet loss even in highly-congested
net-works.
3.2
Active Queue Management
One of the inherent weaknesses of RED and some of the other proposed active queue
manage-ment schemes is that congestion notification does not directly depend on the number of connections multiplexed over the link. In order for early detection to work in congested networks, congestion notification must be given to enough sources so that the offered load is reduced sufficiently to avoid packet loss due to buffer overflow. Conversely, the RED queue must also prevent congestion notifi-cation from being given to too many sources in order to avoid situations where the bottleneck link becomes underutilized. For example, consider a bottleneck link of capacity10
Mbs
which is equallyshared amongst several connections. Assuming TCP windowing, when 100 connections share the link, sending congestion notification to one connection reduces the offered load to9
:
95Mbs
. On theother hand, when only 2 connections share the link, sending congestion notification to one of them reduces the offered load to7
:
5Mbs
. In general, with a bottleneck link that supportsN
connections,giving congestion notification to one connection reduces the offered load by a factor of(1, 1
2
N
). As
N
becomes large, the impact of individual congestion notifications decreases. Without modifying the REDalgorithm to be more aggressive, the REDqueue degenerates into a simple drop-tail queue. On the other hand, asN
becomes small, the impact of individual congestion notifications increases. In this case, without modifying the REDalgorithm to be less aggressive, underutilization can occur as too many sources back off their transmission rates in response to the observed congestion. This section examines the impact that traffic load has on active queue management techniques such as REDand proposes on-line mechanisms for optimizing performance.10Mbs 10Mbs 10Mbs 10Mbs 10Mbs 10Mbs 45Mbs 45Mbs
RED: MINth=20KB, MAXth=80KB, Qsize=80KB
n5 n6 n7 n8 n4 n3 n2 n1 n0 5ms 5ms 5ms 5ms
Figure 3.1: Network topology
3.2.1 Traffic load and early detection
To examine the impact that traffic load has on early detection mechanisms, a set of experiments using thenssimulator [46] was performed. Thenssimulator has been used extensively in a number of studies reported in the literature. While nsdoes not use production TCP code, it implements congestion and error control algorithms used in different implementations of TCPwith remarkable accuracy. In these experiments, both the aggressiveness of the early detection algorithm and the total number of connections multiplexed on the bottleneck link were varied. Figure 3.1 shows the network topology used in the experiments. Each connection originates at one of the leftmost nodes (
n
0;n
1;n
2;n
3;n
4) and terminates atn
8, making the link betweenn
5andn
6the bottleneck. Theperformance of of RED usingECN [23] is examined first. By using RED and end hostTCPsources enabled with ECN, all packet losses from the RED queue can be attributed to buffer overflow. In order to isolate the effects of congestion notification triggered by
min
th
from that triggered bymax
th
, themax
th
parameter is set to the queue size. This, in effect, disablesmax
th
and causes packet loss to occur whenever early detection does not work. Additional experiments usingmax
th
values which are below the queue size are described in Section 3.2.2. Figure 3.2 shows the queue length plot of the congested queue located fromn
5 ton
6 when there are 8 and 32 connectionssimultaneously competing for bandwidth over the link. In these experiments, the RED algorithm is made aggressive by changing
max
p
, RED’s initial drop probability. As Figure 3.2(a) shows, when0.0 2.0 4.0 6.0 8.0 10.0 Time (s) 0.0 20.0 40.0 60.0 80.0 Queue Length (KB) Actual Length Average Length 0.0 2.0 4.0 6.0 8.0 10.0 Time (s) 0.0 20.0 40.0 60.0 80.0 Queue Length (KB) Actual Length Average Length
(a) 8 Connections (b) 32 Connections Figure 3.2: Aggressive early detection (
max
p
= 0.250)sending sources at a rate which is too high, causing the offered load to be significantly smaller than the bottleneck link bandwidth at certain times. This causes periodic underutilization where the queue is empty and the bottleneck link has no packets to send. Figure 3.2(b) shows the queue plot when the number of connections is increased to 32. In contrast, aggressive early detection performs as desired, sending congestion notification at a rate which can both avoid packet loss and achieve high link utilization.
Figure 3.3 shows the same set of experiments using conservative early detection. In contrast to Figure 3.2(a), Figure 3.3(a) shows that by using less aggressive early detection, the RED queue can maintain high link utilization while avoiding packet loss over smaller numbers of connections. However, when the number of connections is increased to 32, as Figure 3.3(b) shows, conservative early detection does not deliver enough congestion notification to the sending sources. Thus, the queue continually overflows causing the RED queue to behave more like a drop-tail queue. The figure also shows that the bottleneck queue never drains even though it is dropping a significant number of packets. This indicates that TCP is not aggressive enough in backing off its sending rate in response to congestion and that the packets which are successfully delivered through the bottleneck queue are enough to trigger subsequent rate increases in the sendingTCPsources. Thus, the bottleneck queue remains close to fully occupied through the duration of the experiment.
To quantitatively evaluate the impact of
max
p
, the experiments were repeated across a range of traffic loads and the loss rates and link utilizations observed were plotted. In each experiment, connections are started within the first 10 seconds of simulation. After 100 seconds, both the loss0.0 2.0 4.0 6.0 8.0 10.0 Time (s) 0.0 20.0 40.0 60.0 80.0 Queue Length (KB) Actual Length Average Length 0.0 2.0 4.0 6.0 8.0 10.0 Time (s) 0.0 20.0 40.0 60.0 80.0 Queue Length (KB) Actual Length Average Length
(a) 8 connections (b) 32 connections Figure 3.3: Conservative early detection (
max
p
= 0.016)rates and the link utilization for the bottleneck link are recorded for 100 seconds. The loss rate is calculated as the number of packets dropped by the queue divided by the total number of packets which arrive at the queue. Link utilization is calculated as the total number of packets sent divided by the maximum number of packets the link could send. Figure 3.4(a) shows the loss rates observed for experiments using 4, 8, 32, and 64 connections. The figure plots the loss rates when a drop-tail queue is used at the bottleneck link. As the drop-tail results show, loss rates at the bottleneck link increase proportionally to the number of connections using the link. There are two main reasons why this is the case. One reason, as described earlier, is that with a large number of connections, it takes a larger amount of congestion notification (i.e. packet drops), to sufficiently signal the end hosts to back off their sending rates. The other reason is due to a fundamental problem withTCP
congestion control which is described in Section 3.3. Figure 3.4(a) also shows the loss rates using RED-ECN over a range of
max
p
values. The corresponding bottleneck link utilization for each experiment is shown in Figure 3.4(b). The figures show that for small numbers of connections, loss rates remain low across all values ofmax
p
, while only small values ofmax
p
can keep the bottleneck link at full utilization. Thus, to optimize performance over a small number of connections, early detection must be made conservative. In contrast, for large numbers of connections, bottleneck link utilizations remain high across allmax
p
values while only large values ofmax
p
are able to prevent packet loss from occurring. In order to optimize performance in this case, early detection must be made aggressive.0.0 0.2 0.4 0.6 0.8 1.0 max 0.0 2.0 4.0 6.0 8.0 10.0
Loss Rates (Percent)
Drop−tail (4) RED−ECN (4) Drop−tail (8) RED−ECN (8) Drop−tail (32) RED−ECN (32) Drop−tail (64) RED−ECN (64) p 0.0 0.2 0.4 0.6 0.8 1.0 max 85.0 90.0 95.0 100.0 Utilization (Percent) RED−ECN (4) RED−ECN (8) RED−ECN (32) RED−ECN (64) p
(a) Packet loss rates (b) Bottleneck link utilization Figure 3.4: Impact of early detection aggressiveness on RED-ECN
3.2.2 Avoiding deterministic congestion notification
In the previous section,
max
th
is set equal to the queue size so that whenever the early detection algorithm fails, packet loss occurs. By settingmax
th
sufficiently below the queue size, the REDalgorithm can avoid packet losses when early detection fails by deterministically marking every incoming packet. Figure 3.5 shows the queue length plot using the same experiment as in Fig-ure 3.3(b) with a larger bottleneck queue size and a fixed
max
th
of80KB
. When the queue size is 120KB
, the queue length plot shows that even with a fairly significant amount of additional bufferspace, packet loss is not eliminated. The plot also shows that the combined effect of using ECN
and packet drops for signaling congestion notification leads to periods of time whereTCPis able to
impact the sending rates of the sources. This is in contrast to the behavior seen in Figure 3.3(b). In that experiment, a connection which was able to send a packet through the bottleneck link always increased its sending rate even though the bottleneck queue was full. By setting
max
th
sufficiently low and usingECN, all connections receive congestion notification when the queue is full whether it is from an ECN or from a packet loss. Thus, as Figure 3.5(a) shows, after a sustained period ofECN marking and packet loss, the sources back off enough to allow the queue to drain. One of the
problems with deterministic marking is that it often goes overboard in signaling congestion to the end hosts. As the queue length plot shows, periods of congestion are immediately followed by fairly long periods of underutilization where the queue is empty. Furthermore, it takes a large amount of extra buffer space in order to ensure that no loss occurs. Figure 3.5(b) shows the queue length plot
0.0 2.0 4.0 6.0 8.0 10.0 Time (s) 0.0 20.0 40.0 60.0 80.0 100.0 120.0 Queue Length (KB) Actual Length Average Length 0.0 2.0 4.0 6.0 8.0 10.0 Time (s) 0.0 40.0 80.0 120.0 160.0 200.0 240.0 Queue Length (KB) Actual Length Average Length
(a)
Q
size
=120KB
;max
th
=80KB
(b)Q
size
=240KB
;max
th
=80KB
Figure 3.5: Impact of
max
th
and queue sizeusing a queue size of 240
KB
. As the figure shows, even when deterministic marking is done ataverage queue lengths of80
KB
, the actual queue length can more than double before sources havea chance to back off.
3.2.3 Adaptive RED
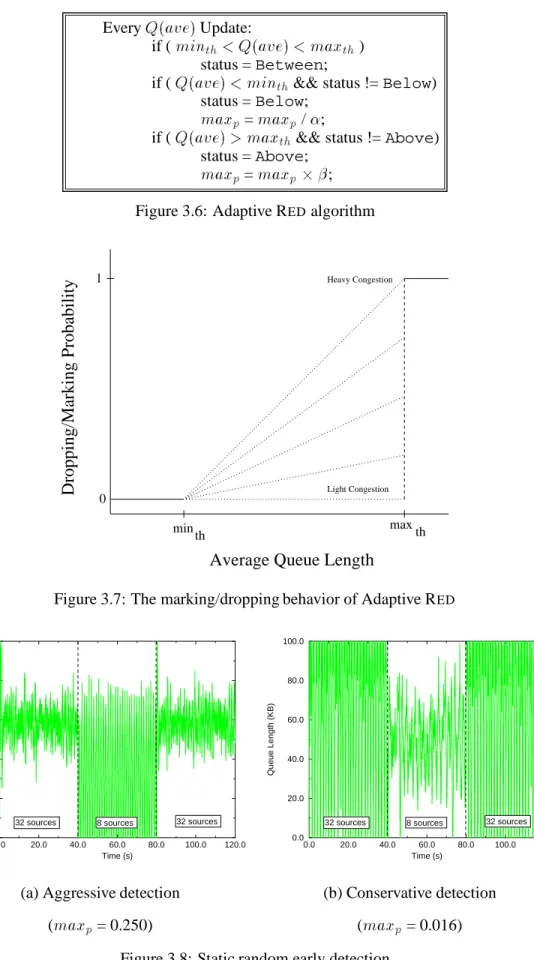
From the previous experiments, it is clear that more aggressive early detection is needed when a large number of flows are active in order to avoid packet loss and deterministic congestion notifi-cation. Similarly, less aggressive early detection is needed when a small number of flows are active in order to prevent underutilization. Because adapting REDparameters can be beneficial to network performance, this section proposes an on-line mechanism for adaptively changing the parameters according to the observed traffic. This algorithm, called Adaptive RED, is shown in Figure 3.6. The
idea behind this algorithm is to infer whether or not REDshould become more or less aggressive by examining the average queue length behavior. If the average queue length continually crosses back and forth over
min
th
, then the early detection mechanism is being too aggressive. If the average queue length continually crosses back and forth overmax
th
, then the early detection mechanism is not aggressive enough. Given the behavior of the average queue length, the algorithm then adjusts its value ofmax
p
accordingly. For this algorithm,max
p
is simply scaled by constant factors of and depending on which threshold it crosses. Figure 3.7 shows how Adaptive RED changes the marking/dropping behavior of RED. In contrast to the original REDalgorithm as shown in Fig-ure 2.3, Adaptive RED’s marking function changes depending on the setting ofmax
p
. In times ofEvery
Q
(ave
)Update:if (
min
th
< Q
(ave
)< max
th
)status =Between;
if (
Q
(ave
)< min
th
&& status !=Below)status =Below;
max
p
=max
p
/;if (
Q
(ave
)> max
th
&& status !=Above)status =Above;
max
p
=max
p
;Figure 3.6: Adaptive REDalgorithm
min
th maxth
0
Average Queue Length
1
Dropping/Marking Probability Light Congestion Heavy Congestion
Figure 3.7: The marking/dropping behavior of Adaptive RED
0.0 20.0 40.0 60.0 80.0 100.0 120.0 Time (s) 0.0 20.0 40.0 60.0 80.0 100.0 Queue Length (KB) 32 sources 8 sources 32 sources 0.0 20.0 40.0 60.0 80.0 100.0 120.0 Time (s) 0.0 20.0 40.0 60.0 80.0 100.0 Queue Length (KB) 32 sources 8 sources 32 sources
(a) Aggressive detection (b) Conservative detection (
max
p
= 0.250) (max
p
= 0.016)0.0 20.0 40.0 60.0 80.0 100.0 120.0 Time (s) 0.0 20.0 40.0 60.0 80.0 100.0 Queue Length (KB) 32 sources 8 sources 32 sources 0.0 20.0 40.0 60.0 80.0 100.0 120.0 Time (s) 0.00 0.05 0.10 0.15 0.20 max p
(a) Queue length (b)
max
p
parameter Figure 3.9: Adaptive REDlight congestion, the marking/dropping probabilities remain quite low until the average queue length reaches
max
th
. In times of heavy congestion, the marking/dropping probabilities increase quickly as the average queue length exceedsmin
th
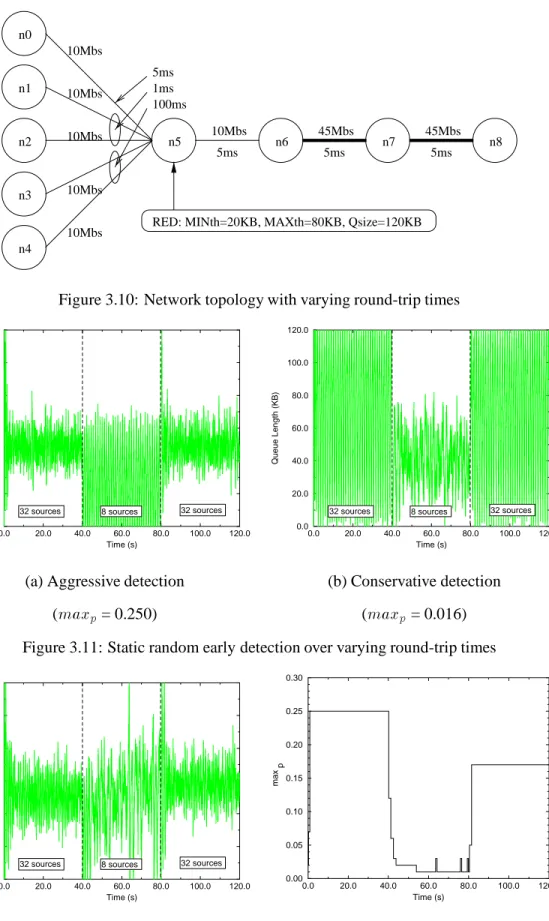
.To show the feasibility of Adaptive RED, another experiment using the same network shown in Figure 3.1 was run, but with RED queues of size100
KB
. In this experiment, the number ofactive connections is varied between 8 and 32 over 40 second intervals. Figure 3.8 shows the queue length plots using REDqueues statically configured to be either aggressive or conservative.
When aggressive early detection is used, as shown in Figure 3.8(a), the REDqueue performs well whenever 32 connections are active. When only 8 connections are active, however, the REDqueue is
too aggressive in its congestion notification, thus causing periodic underutilization where the queue is empty. When conservative early detection is used, as shown in Figure 3.8(b), the REDqueue only
performs well when 8 connections are active. When all 32 connections are active, the RED queue continually fluctuates between periods of sustained packet loss and ECN marking and subsequent
periods of underutilization.
Figure 3.9(a) shows the queue length plot of the same experiment using Adaptive RED with
and set to 3 and 2, respectively.max
p
is initially set to to 0.020 and then allowed to vary according to the algorithm. As the plot shows, after brief learning periods when the experiment starts and when the input traffic changes, the REDqueue is able to adapt itself well. Figure 3.9(b) plots themax
p
parameter as the RED queue adapts it to the input traffic. As expected, its value adapts to reflect the number of active flows. When all 32 connections are active,max
p
increasessignificantly, causing the REDalgorithm to become more aggressive. When only 8 connections are active,
max
p
decreases, causing the REDalgorithm to become less aggressive.3.2.4 Round-trip time sensitivity
In the previous experiments, the round-trip time for all of the connections was kept approxi-mately the same. While this allows for an initial understanding of the problems with RED and the effectiveness of Adaptive RED, a more realistic topology with varying round-trip times can provide slightly different results. In this section, the experimental setup is changed to reflect the presence of connections with a variety of round-trip times going across the bottleneck link. Figure 3.10 shows the network evaluated. In this network, the round trip times are varied by increasing and decreasing the transmission delay across several links. Given this heterogeneity, the round-trip delays between connections when the network is unloaded ranges from32
ms
to230ms
.Using this network, the experiment in the previous section was repeated. Figure 3.11 shows the queue length traces using both aggressive and conservative early detection. The figure shows similar results as before with one small difference. When conservative early detection is used with a large number of sources, deterministic congestion notification does not always cause underutilization of the bottleneck link. One of the reasons behind this is the fact that the varying round-trip times cause sources to react to deterministic congestion notification at different times. Thus, they do not synchronously reduce their transmission rates. Another reason why underutilization is not severe is that sources with extremely small round-trip times (i.e. 32
ms
) are able to ramp up theirtransmis-sion rates quickly after congestion occurs. While this allows such flows to grab a disproportionate amount of the bottleneck link capacity, it also keeps the bottleneck link more fully utilized across time.
Figure 3.12 shows the performance of Adaptive RED over the same experiment. As the figure shows, the ability for Adaptive REDto hit RED’s “sweet spot” is not severely affected by the differ-ence in round-trip time. The
max
p
modification still allows REDto adapt effectively to changes in network load.10Mbs 10Mbs 10Mbs 10Mbs 10Mbs 10Mbs 45Mbs 45Mbs n5 n6 n7 n8 n4 n3 n2 n1 n0 5ms 5ms 5ms
RED: MINth=20KB, MAXth=80KB, Qsize=120KB 100ms
1ms 5ms
Figure 3.10: Network topology with varying round-trip times
0.0 20.0 40.0 60.0 80.0 100.0 120.0 Time (s) 0.0 20.0 40.0 60.0 80.0 100.0 120.0 Queue Length (KB) 32 sources 8 sources 32 sources 0.0 20.0 40.0 60.0 80.0 100.0 120.0 Time (s) 0.0 20.0 40.0 60.0 80.0 100.0 120.0 Queue Length (KB) 32 sources 8 sources 32 sources
(a) Aggressive detection (b) Conservative detection (
max
p
= 0.250) (max
p
= 0.016) Figure 3.11: Static random early detection over varying round-trip times0.0 20.0 40.0 60.0 80.0 100.0 120.0 Time (s) 0.0 20.0 40.0 60.0 80.0 100.0 120.0 Queue Length (KB) 32 sources 8 sources 32 sources 0.0 20.0 40.0 60.0 80.0 100.0 120.0 Time (s) 0.00 0.05 0.10 0.15 0.20 0.25 0.30 max p
(a) Queue length (b)
max
p
parameter Figure 3.12: Adaptive REDover varying round-trip times128 MB 200 MHz Pentium MMX 32 MB 200 MHz Pentium Pro 64 MB 166 MHz Pentium 32 MB 233 MHz Pentium II router2 slow 100Mbs 100Mbs 10Mbs fast router1 Figure 3.13: Testbed 3.2.5 Implementation
To further evaluate Adaptive RED, it has been implemented in FreeBSD 2.2.6 and ALTQ [9]. In the implementation, calls to the genericIF ENQUEUEandIF DEQUEUEmacros fromif output
andif startare changed to replace theFIFOqueueing mechanism typically used in BSD Unix with the Adaptive RED queueing discipline. Using this implementation, several experiments on a small testbed of PCs shown in Figure 3.13 were performed. In the figure, each network node and link is labeled with CPU model and link bandwidth, respectively. Note that all links are shared Ethernet segments. Hence, the acknowledgments on the reverse path collide and interfere with data packets on the forward path. As the figure shows, FreeBSD-based routers using Adaptive RED
connect the Ethernet and Fast Ethernet segments.
To generate load on the system,netperf[49] is used.netperfis a well-known, parameter-izable tool for generating network load in order to evaluate the performance of both end hosts and network elements. In the experiments shown, a variable number of infinitenetperfsessions are run from fasttoslow, the endpoints of the network. The router queue on the congested inter-face onrouter2to the Ethernet segment is sized at 50
KB
using amin
th
of10KB
amax
th
of 40KB
. Amax
p
value of 0.02 is used for the conservative early detection algorithm while amax
p
value of 1.00 is used for the aggressive early detection algorithm. The
max
p
value of Adaptive RED is initially set at 0.02 and allowed to vary according to the algorithm in Figure 3.6. In order to ensure the Adaptive RED modifications did not create bottlenecks in the routers, a number of experiments were run betweenfastandrouter2using Adaptive REDonrouter1to forward packets between both hosts. In all of the experiments, the sustained throughput ofrouter1 was always above70Mbs
. Thus, experiments run fromfasttoslowalways bottleneck at the output0.0 10.0 20.0 30.0 40.0 50.0 60.0 70.0 Number of Connections 6.6 6.8 7.0 7.2 7.4 7.6 Throughput (Mbs) Aggressive Conservative Adaptive 0.0 10.0 20.0 30.0 40.0 50.0 60.0 70.0 Number of Connections 0.0 2.0 4.0 6.0 8.0 10.0 12.0
Percent Packet Loss
Aggressive Conservative Adaptive
(a) Throughput (b) Percent packet loss Figure 3.14: Queue management performance
Figure 3.14 shows the throughput and packet loss rates at the bottleneck link across a range of workloads. The throughput measures the rate at which packets are forwarded through the congested interface. This rate slightly overestimates the end-to-end goodput of thenetperfsessions since retransmissions are counted. The packet loss rate measures the ratio of the number of packets dropped at the queue and the total number of packets received at the queue. In each experiment, throughput and packet loss rates were measured over ten 5-second intervals and then averaged. As Figure 3.14(a) shows, both the conservative and adaptive early detection algorithms maintain high throughput levels across all workloads while the aggressive early detection algorithm achieves a lower throughput for smaller numbers of connections. Note that since the Ethernet segments are shared, acknowledgments on the reverse path collide with data packets on the forward path, thus limiting throughput. Figure 3.14(b) shows the packet loss rates over the same workloads. As the figure shows, both the aggressive and the adaptive early detection algorithms maintain low packet loss rates across all workloads while the conservative early detection algorithm suffers from fairly large packet loss rates as the number of connections increases. When the number of connections is large, an interesting observation is that the marking rate of the adaptive and aggressive early detection algorithms approaches 50%. Because aggregateTCP behavior becomes more aggressive as the number of connections increases, it becomes more and more difficult for the RED queue to maintain low loss rates. Fluctuations in queue lengths occur so abruptly that the RED algorithm
0.0 0.2 0.4 0.6 0.8 1.0 max 4.0 4.5 5.0 5.5 6.0 6.5
Loss Rates (Percent)
Drop−tail RED p 0.0 0.2 0.4 0.6 0.8 1.0 max 8.5 9.0 9.5 10.0 10.5
Loss Rates (Percent)
Drop−tail RED
p
(a) 32 connections (b) 64 connections Figure 3.15: Impact of early detection aggressiveness on RED
and link underutilization. This observation is revisited in Section 3.3 and in Chapter 4.
3.2.6 Using packet loss for congestion notification
The previous experiments examine the use of early detection in its “purest” form where con-gestion notification is free and causes no packet losses. Without support forECN, however, RED
must resort to dropping a packet in order to signal congestion. This leads to an interesting optimiza-tion problem where the RED queue must pick a
max
p
value which minimizes the sum of packet drops due to early detection and packet drops due to buffer overflow. With extremely largemax
p
values, packet loss rates are dominated by drops due to early detection while with extremely smallmax
p
values, packet loss is mostly due to queue overflow. To illustrate this, the experiments in Section 3.2.1 were repeated using a normal RED queue. Figure 3.15 shows the loss rates of REDwith 32 and 64 connections running through the bottleneck link. Again, as
max
p
decreases, the per-formance of REDapproaches a drop-tail queue. However, asmax
p
increases, the drops contributed by the early detection algorithm begin to dominate the loss rate. Both graphs show a cusp at the point which minimizes the sum of the losses contributed by the early detection algorithm and by buffer overflow. This cusp occurs at different values ofmax
p
depending on how many connections are present. As more connections are added, the optimal value ofmax
p
increases.Note that even with a RED queue parameterized to minimize loss, packet loss rates continue to increase with traffic load. Using drops as a means for congestion notification fundamentally limits
the loss rate observed across the Internet. As more connections come on-line, the rate of congestion notification, and thus, the loss rates increase. Steady state analysis of theTCPcongestion avoidance
algorithm [22, 40, 42, 51] gives some insight as to why this is the case. Such analysis has shown that given random packet loss at constant probability
p
, the upper bound on the bandwidth aTCPconnection sees can be estimated as:
BW < MSS
RTT
pC
p
(3.1)where
MSS
is the segment size,RTT
is the round-trip time, andC
is a constant. Using this model, packet loss rates over a single bottleneck link ofL Mbs
can be approximated for a fixed number of connectionsN
. In this situation, the bandwidth delivered to each individual connection is approximately the link bandwidth divided by the number of connections (N
L
). By substituting this into the previous equation and solving forp
, the following is obtainedp <
N
L
MSS
C
RTT
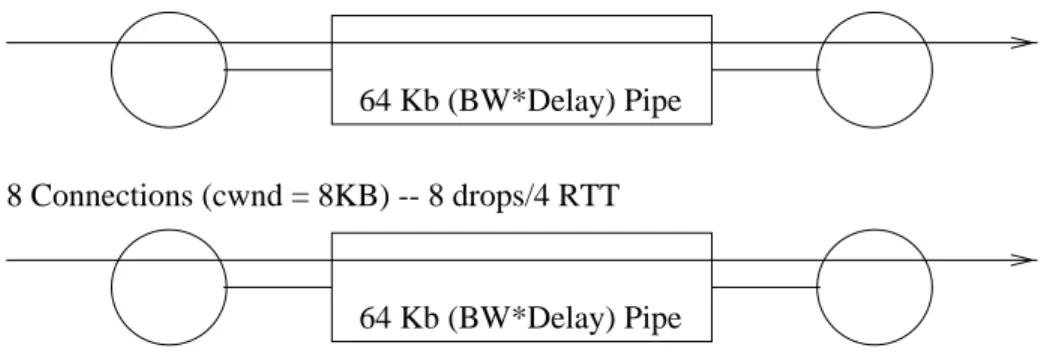
2 (3.2)As the equation shows, when all of the connections are using the TCP congestion avoidance algorithm, the upper bound on the packet loss rate quadratically increases with the number of con-nections present. Intuitively, this phenomenon can be shown using an idealized example. Suppose two identical networks have bandwidth-delay products of64
KB
from a given pair of end points asshown in Figure 3.16. In one network, 4 identical connections are active while in another 8 identical connections are. Given fair sharing amongst the connections, the congestion windows of each con-nection will approximately be the bandwidth-delay product divided by the number of concon-nections present. For 4 connections, each connection will have congestion windows which oscillate near
16
KB
. Assuming normalTCPwindowing and a segment size of1KB
, an individual connection inthis network will typically build its congestion window up to around 16 packets, receive congestion notification in the form of a lost packet, back off its window to about 8 packets and then slowly build its congestion window back up at a rate of one packet per round-trip time. Given this behavior, the loss rate across all connections in this idealized model would then be approximately 4 packet drops every 8 round-trip times or 0
:
5packets
RTT
. Similarly, using the same idealized model, it can be shown that when 8 connections are present, losses occur at a rate of 2packets
RTT
, a quadratic increase.64 Kb (BW*Delay) Pipe
64 Kb (BW*Delay) Pipe 8 Connections (cwnd = 8KB) -- 8 drops/4 RTT 4 Connections (cwnd = 16KB) -- 4 drops/8 RTT
Figure 3.16: Example network
do not quite vary quadratically with the number of connections. From the drop-tail experiments in Figure 3.15, the loss rates observed show a dependence on the number of connections which is somewhere between linear and quadratic. There are several reasons why this is the case. One reason is that the derivation assumes a fair sharing of bandwidth across the bottleneck link. It has been shown that as the number of TCP connections increases, the amount of unfairness between connections increases considerably [48]. Another reason is that the equation does not model the occurrence of retransmission timeouts. By using models ofTCPbehavior which capture retransmis-sion timeouts, loss rates can be predicted more accurately [52].
The results from Equation 3.2 are still significant because they show that as networks become more congested, packet loss rates increase considerably, thus making the probability of congestion collapse more likely. The equation highlights the need for decoupling packet loss from congestion notification through the use of explicit congestion notification. In lieu of explicit congestion notifi-cation, however, the equation also provides some insight on how to improve loss rates given a fixed number of connections. One way is to alter the congestion avoidance mechanism itself so that it does not continually increase its sending rate beyond the network’s capacity. For example, schemes such as Tri-S [66, 67] orTCPVegas [7] can be used to reduce the amount of packet losses observed. Another way is to increase the bottleneck link bandwidth
L
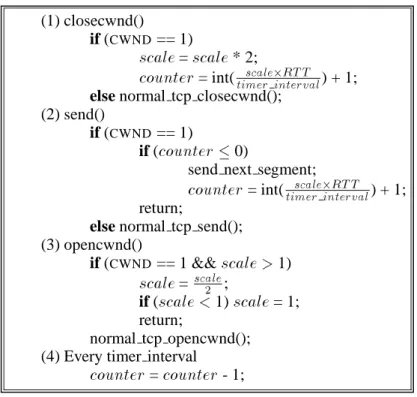
. By increasing the link bandwidth, the effective congestion windows of individual connections increases, thus decreasing the frequency of congestion notification in the scenario above. Reducing the segment size used in the congestion avoidance algorithm can also improve loss rates. The smaller segment size allows the end host to grow its congestion window more slowly, thus decreasing the rate at which it receives congestion notification. Finally, loss rates can be improved by increasing the round-trip time. Increasing the(1) closecwnd()
if (CWND== 1)
scale
=scale
* 2;counter
= int(scale
RTT
timer interval
) + 1;else normal tcp closecwnd();
(2) send()
if (CWND== 1)
if (
counter
0)send next segment;
counter
= int(scale
RTT
timer interval
) + 1; return;else normal tcp send();
(3) opencwnd() if (CWND== 1 &&
scale >
1)scale
=scale
2 ; if (scale <
1)scale
= 1; return; normal tcp opencwnd(); (4) Every timer intervalcounter
=counter
- 1;Figure 3.17: SUBTCPalgorithm
round-trip time, through the use of additional network buffers [65] increases the bandwidth delay product which slows the rate of congestion notification.
3.3
End Host Congestion Control
While properly designed active queue management mechanisms like Adaptive RED can help reduce packet losses, such techniques alone cannot guarantee low loss rates especially when traffic load fluctuates wildly. Instead, intelligent queue management must be combined with intelligent end host congestion control in order to obtain high utilization with a minimal amount of packet loss. If the offered load overwhelms the bottleneck link before congestion notification can be delivered, buffer overflow and packet loss is inevitable. This section describes several weaknesses in TCP
congestion control and how they can cause high loss rates even in the presence of active queue man-agement. Given this behavior, a number of possible modifications toTCP’s windowing mechanism
3.3.1 Adjusting the minimum transmission rate
One of the limitations ofTCP’s congestion control mechanism is that in normal operation, the
minimum transmission rate of a TCP sender is one segment per round-trip time. When a large number of connections are multiplexed over a low bandwidth link, the inability ofTCP to transmit at lower rates causes a significant amount of packet loss and retransmission timeouts [48]. TCP, by exponentially backing off its retransmission timeout interval, do