University of Arkansas, Fayetteville University of Arkansas, Fayetteville
ScholarWorks@UARK
ScholarWorks@UARK
Computer Science and Computer Engineering
Undergraduate Honors Theses Computer Science and Computer Engineering
5-2020
Investigating Machine Learning Techniques for Gesture
Investigating Machine Learning Techniques for Gesture
Recognition with Low-Cost Capacitive Sensing Arrays
Recognition with Low-Cost Capacitive Sensing Arrays
Michael Fahr Jr.Follow this and additional works at: https://scholarworks.uark.edu/csceuht
Part of the Graphics and Human Computer Interfaces Commons Citation
Citation
Fahr Jr., M. (2020). Investigating Machine Learning Techniques for Gesture Recognition with Low-Cost Capacitive Sensing Arrays. Computer Science and Computer Engineering Undergraduate Honors Theses Retrieved from https://scholarworks.uark.edu/csceuht/82
Investigating Machine Learning Techniques for Gesture Recognition with
Low-Cost Capacitive Sensing Arrays
An Undergraduate Honors College Thesis in the
Department of Computer Science College of Engineering University of Arkansas
Fayetteville, AR by
Abstract
Machine learning has proven to be an effective tool for forming models to make predictions based on sample data. Supervised learning, a subset of machine learning, can be used to map input data to output labels based on pre-existing paired data. Datasets for machine learning can be created from many different sources and vary in complexity, with popular datasets including the MNIST handwritten dataset and CIFAR10 image dataset. The focus of this thesis is to test and validate multiple machine learning models for accurately classifying gestures performed on a low-cost capacitive sensing array. Multiple neural networks are trained using gesture datasets obtained from the capacitance board. In this paper, I train and compare different machine learning models on recognizing gesture datasets. Learning hyperparameters are also adjusted for results. Two datasets are used for the training: one containing simple gestures and another containing more complicated gestures. Accuracy and loss for the models are calculated and compared to determine which models excel at recognizing performed gestures.
Contents
1.0 Introduction ...4
2.0 Related Work ...4
3.0 Background ...7
3.1 Capacitive Sensor Board ... 7
3.2 Machine Learning Concepts ... 10
4.0 Experiment ...17
4.1 Data Collection ... 17
4.2 Machine Learning Models ... 18
5.0 Results ...19
6.0 Conclusion ...25
7.0 Future Work ...26
7.1 Personal Contribution ... 26
1.0Introduction
Over the past several decades, the use of machine learning for classifying datasets has increased, with applications including image recognition [1] and predictions of an author’s emotions based on text [2]. Supervised training, a subset of machine learning, maps input data to output labels based on an inferred function developed from a training dataset. Neural networks can be used to achieve a simple mapping in supervised training. However, as datasets become more complex by having multiple dimensions, additional machine learning techniques must be introduced to accurately train these datasets. Several machine learning strategies are used for learning complex datasets, including implementing recurrent neural networks for modeling temporal data and convolutional neural networks for modeling spatial data.
This paper will focus on the testing of multiple differing machine learning models using various machine learning strategies for training gesture datasets created on a capacitive sensing board. The original focus of this paper was to use machine learning with capacitive sensing to recognize gestures in adaptive gaming. The machine learning was to be implemented with datasets consisting of gestures performed by individuals with disabilities. However, due to unforeseen circumstances, the scope of this project was refocused for understanding the accuracy of machine learning with capacitive sensing.
2.0Related Work
focus on touch-based gesture interaction. Pen- and touch-based interactions (“Pen
Computing”) began in the late 1950s/early 1960s, actually predating the mouse and graphical display. The application of this technology to handwriting recognition (as demonstrated in [3, 4, 5]) lays the foundation for classifying arbitrary single- or multi-touch unistroke gestures. One such application is Graffiti, a handwriting recognition system based on single stroke inputs [3]. Graffiti is used in PDAs based on the Palm OS and was designed to be drawn with a stylus on a touch-sensitive pad without visual feedback. The $1 Unistroke Recognizer is a simple project that offers gesture recognition in multiple different environments including design-oriented, scripting, and off-desktop prototyping environments [4]. The $1 Unistroke Recognizer is simple and inexpensive, yet it offers high accuracy in recognizing gestures when few template gestures are stored. EdgeWrite is another unistroke text entry method designed for recognizing
characters using minimal sensing [5]. This application uses four corners arranged in a square for the input, where the character being drawn is determined by the order of corners that are entered.
Machine learning has more recently become a popular tool for constructing and improving models to recognize datasets and has been incorporated in numerous applications for gesture recognition. As shown by Mitra and Archarya [6], multiple different machine learning
approaches have been used for classifying gestures, including applications involving hidden Markov models, finite state machines, particle filtering and condensation, and artificial neural networks.
such as hand and face recognition [6] and speech recognition [7]. HMMs have been used to improve the recognition of real-time American Sign Language [8]. Using a tracking camera to record video data, an HMM can be trained to detect hand signs with an overall low error rate. Similar to HMMs, finite state machines have also been used for hand gesture recognition [9]. However, while the HMM requires a predefined structure of the states, the finite state machine aligns the training data and simultaneously produces the gesture model [9]. The condensation algorithm is another technique for gesture recognition and builds upon concepts of particle filtering. Particle filters are sequential methods that use point mass representation of
probability densities to solve filtering problems [10]. The condensation algorithm, an algorithm that uses weighted samples and observed data to approximate a curve, has been shown to be effective with matching temporal trajectories and recognizing gestures based on stored models [11].
The artificial neural network has also seen use in the field of gesture recognition. Model architectures such as the recurrent neural network and convolutional neural network have proven to be effective in accurately classifying hand gestures [12, 13]. Recurrent neural
networks have been used with accelerometer data and signal predictors for the classification of gestures [12], whereas camera images of human task activities can be recognized using
convolutional neural networks [13].
The research presented in this thesis is similar to the provided related work in that the gestures will need to be recognized in real time. However, this research will differ by using gesture inputs created using a low-cost capacitive sensing array device with neural network architectures such as convolutional and recurrent neural networks.
3.0Background
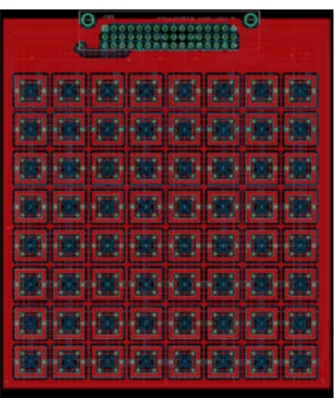
3.1Capacitive Sensor Board
A custom capacitance sensor board is used for constructing the dataset. This board features 64 buttons controlled with 16 microcontroller pins, and a recording rate of greater than 100 samples per second. The capacitance board is connected to a low-power MSP430 microcontroller designed for low-power sensing. The board can detect changes in sensor capacitance due to human interaction, known as capacitive touch sensing. The design of the capacitance board is an 8 by 8 array of capacitive buttons. Figure 2 illustrates the design of the capacitance sensor board.
Each button located on the board is designed with a mutual capacitance sensor [14]. The sensor is formed with two separate electrode structures, each acting as a separate capacitor plate. The electrodes are separated into the transmit electrode (Tx) and the receive electrode (Rx), with interaction measured from the difference in the electrode’s capacitance values. To help prevent noise in the system, the board is designed to reduce parasitic mutual and parasitic ground capacitance. Parasitic mutual capacitance is formed when the Rx and Tx traces are close to each other. This can be reduced by keeping the Rx and Tx traces separated, and if they need to cross, crossing them at a 90-degree angle to minimize the trace area overlap. Parasitic ground capacitance is formed between ground pours and trace lines and is reduced by keeping the electrode and microcontroller trace routing at a minimal length.
Figure 3 below provides an example of the mutual capacitance sensor design. The Tx and Rx are designed in a rectangular shape around the sensor. Noise reduction is achieved by removing parts of the Rx electrode, forcing the electric field lines to concentrate to the corners of the sensor [14].
Figure 3: Design of Mutual Capacitance Sensor [14]
The mutual capacitance sensors are placed on the board to form an 8 x 8 grid. Figure 4 identifies the layout of each sensor on the board. Tightly coupled electric fields reside within each mutual capacitive sensor, allowing the sensors to be grouped together without sensor cross-coupling occurring. There are 8 column and 8 row electrodes that are used to form a mutual capacitance matrix, where each unique Rx and Tx pair form a sensor. The matrix allows the capacitance board to be controlled by 16 microcontroller input pins.
Figure 4: Layout of the Mutual Capacitance Sensors [14]
3.2Machine Learning Concepts
The focus of this project is utilizing machine learning for classifying the gesture dataset. Machine learning, a sub-set of artificial intelligence, is used to construct a mathematical model based on training data to correctly classify each gesture with its corresponding label. Depending on the task being solved, multiple different types of machine learning can be used, including supervised, unsupervised, and reinforcement learning. In supervised learning, the training data contains both the inputs and the desired output for each set of data. For this thesis, each input sequence of data is paired with a gesture label, classifying the learning as supervised learning. Unsupervised learning takes the input data and finds common features to provide structure. This type of learning is used in applications such as improving computer networking [15] and
One of the simplest forms of machine learning architectures for supervised learning is the basic neural network. Neural networks consist of an input layer, a number of hidden layers, and a final layer. The input layer is built from the values obtained from a sample of data in the dataset. For example, the input layer for training a model for image recognition might contain the normalized grayscale value for each pixel flattened into a one-dimensional array. The hidden layers consist of artificial neurons, also known as hidden nodes, where each neuron in the layer is connected with every neuron in the previous and following layer. Each connection between the layers is assigned a weight that is adjusted during the training process. The
number of neurons in each hidden layer is assigned when creating the model, and represents a feature extracted from the dataset. The greater the number of hidden nodes, the more
complex features that can be modeled with the neural network. However, the training time also increases with additional hidden nodes. Research shows that the number of hidden nodes for optimal performance and computational cost with large datasets is equal to log(N), where N is the number of samples used for training [17]. Lastly, the output layer is constructed with the number of neurons equal to the number of desired output classifications. The output of each neuron can be calculated with the following equation (1):
𝑦𝑦 = 𝜑𝜑 (𝐵𝐵 + ∑ 𝑤𝑤𝑗𝑗 𝑚𝑚 𝑗𝑗=1
𝑥𝑥𝑗𝑗)
(1)
An important property for maintaining high accuracy in complex neural networks is the activation function. The activation function takes the neuron’s intermediate signal and converts it into the final output signal. By using an activation function that transforms the linear input into a non-linear output, complex datasets can be modeled and trained more effectively and will have an advantage over linear outputs in high-dimensional settings [18]. Multiple activation functions were tested with the gesture dataset, including the linear, sigmoid, hyperbolic
tangent, and rectified linear unit (ReLU) function. The simplest of the four activation functions is the linear function, such as the identity function. This function maps the input using the following equation (2):
𝑓𝑓(𝑥𝑥) = 𝑥𝑥 (2)
Next, the sigmoid activation function is a non-linear, S shaped function with a range between 0 and 1, and is defined by the following equation (3):
𝑓𝑓(𝑥𝑥) =𝑒𝑒𝑥𝑥𝑒𝑒+ 1𝑥𝑥 (3)
The hyperbolic tangent function is similar to the sigmoid activation function in having a sigmoidal shape, but instead ranges from -1 to 1. The equation (4) is shown below:
𝑓𝑓(𝑥𝑥) =𝑒𝑒𝑒𝑒𝑥𝑥𝑥𝑥+ 𝑒𝑒− 𝑒𝑒−𝑥𝑥−𝑥𝑥 (4)
Lastly, the ReLU activation calculates the max of 0 and input x, resulting in only positive values being output from the neuron. This function features the properties of being non-linear and
having a more efficient computation time due to the use of simple mathematical operations. The equation (5) is shown below:
𝑓𝑓(𝑥𝑥) = max(0, 𝑥𝑥) (5)
A neural network adjusting itself to reduce error generated is known as learning. One of the main methods used for learning is backpropagation, the process of altering the weights and biases in an attempt to reduce the amount of error generated. Backpropagation is split into two main parts, a forward pass and backwards pass. During the forward pass, data from the input layer is used to calculate each neuron’s output in the hidden layers. This is completed through equation (1) using preset weights and biases. Finally, the output layer’s neuron values are calculated, and the correct output vector is compared with these values to calculate loss. Loss, a performance metric for neural networks, is calculated using a loss function such as mean square error or quadratic loss. The backwards pass is performed by calculating the loss function’s gradient and using this data to update the weights and biases through a form of stochastic gradient descent [19]. Hyperparameters such as number of epochs and batch size are used during the backpropagation. In every epoch, the entire dataset is passed through the forward and backward pass once. The batch size is the number of training examples per
iteration, where the gradient and neural network parameters are updated after each iteration. Adam, an algorithm for gradient-based optimization, was used in all models to execute the backpropagation due to its low memory requirements and efficient computation speed [20].
too accurately, causing the model to perform well on the training dataset but not the test dataset. Overfitting is caused due to the artificial network size (number of hidden layers and nodes) being too large and complex. Similarly, overtraining is caused by training the data for too many epochs [21].
The convolutional neural network is a class of neural networks that excels in applications such as image recognition [22] and video detection [23]. Convolutional neural networks are constructed from convolutional layers, pooling layers, and fully connected layers. In the convolutional layers, a kernel matrix is convolved with the data input at a specified stride to produce a feature map. Hyperparameters such as filter size, stride length, and output
dimensionality can be changed to transform the output from the convolutional layer. A pooling layer is used to reduce the dimensionality of the output from convolutional layers. Pooling layers can act either on a small subsection of the feature map, such as a 2x2 grid, or can pool the entire map. There are many different ways of conducting the pooling for the layers, including max pooling, sum pooling, and average pooling. Max pooling takes the artificial neuron’s max value from the chosen subsection and outputs the reduced matrix. In sum pooling, the subsections values are added together for the final matrix, and in average pooling, the average of the subsection is calculated for the matrix. Different pooling techniques can be combined for a neural network model, such as alternating max pooling and average pooling, and can assist with overfitting in the neural network [24].
Another important class of neural networks is the recurrent neural network (RNN). RNNs excel at modeling sequence data and are used in applications such as speech recognition [25] and natural language processing [26]. RNNs model data using timesteps, where each step
has the output fed into the next timestep. A major disadvantage to RNNs is that they suffer greatly from the vanishing gradient problem during backpropagation [27]. The vanishing gradient problem occurs during learning when the calculated gradient becomes very small, preventing the weight from updating its value. To help solve this problem, a special type of RNN architecture called the long short-term memory (LSTM) was developed. LSTM architectures can avoid the vanishing gradient problem using a stored hidden state value that is passed between LSTM cells [28]. Figure 5 shows the layout of an LSTM cell.
A LSTM cell is composed of an input gate, output gate, and forget gate, which all control the information provided by the cell. Each gate is controlled by a sigmoid function, outputting a value between 0 and 1. The following equations (6 - 10) are described by Graves et al [29].
𝑖𝑖𝑡𝑡 = 𝜎𝜎(𝑊𝑊𝑥𝑥𝑥𝑥𝑥𝑥𝑡𝑡+ 𝑊𝑊ℎ𝑥𝑥ℎ𝑡𝑡−1 + 𝑊𝑊𝑐𝑐𝑥𝑥𝑐𝑐𝑡𝑡−1+ 𝑏𝑏𝑥𝑥) (6)
𝑓𝑓𝑡𝑡 = 𝜎𝜎(𝑊𝑊𝑥𝑥𝑥𝑥𝑥𝑥𝑡𝑡+ 𝑊𝑊ℎ𝑥𝑥ℎ𝑡𝑡−1+ 𝑊𝑊𝑐𝑐𝑥𝑥𝑐𝑐𝑡𝑡−1+ 𝑏𝑏𝑥𝑥) (7)
𝑐𝑐𝑡𝑡 = 𝑓𝑓𝑡𝑡𝑐𝑐𝑡𝑡−1+ 𝑖𝑖𝑡𝑡tanh(𝑊𝑊𝑥𝑥𝑐𝑐𝑥𝑥𝑡𝑡+ 𝑊𝑊ℎ𝑐𝑐ℎ𝑡𝑡−1+ 𝑏𝑏𝑐𝑐) (8)
𝑜𝑜𝑡𝑡 = 𝜎𝜎(𝑊𝑊𝑥𝑥𝑥𝑥𝑥𝑥𝑡𝑡+ 𝑊𝑊ℎ𝑥𝑥ℎ𝑡𝑡−1+ 𝑊𝑊𝑐𝑐𝑥𝑥𝑐𝑐𝑡𝑡−1+ 𝑏𝑏𝑥𝑥) (9)
ℎ𝑡𝑡 = 𝑜𝑜𝑡𝑡tanh(𝑐𝑐𝑡𝑡) (10) The input gate decides which values of the cell state are updated and is represented by
equation (6). The forget gate controls what is lost from the cell state and is shown through equation (7). Using the values calculated for the input gate and forget gate, equation (8) can be used to calculate the cell state. In this equation, a candidate value for the cell state is calculated and multiplied by the input gate scaling to determine how much of each state value should be updated. Lastly, the output gate controls which parts of the cells state are filtered for the cell’s output and can be calculated with equation (9). In the gate equations, a peephole value is calculated, represented by a weight multiplied by the cells internal value. However, for the implementations in this paper, a peephole value is excluded from the calculations. Equation
(10) represents the LSTM cell’s finaloutput (ht) for Figure 5 using the output gate and cell state
values.
A major drawback of using an LSTM is that the input needs to be flattened to a 1D vector, losing the spatial aspect of the data. To solve this problem, convolution can be used in
as a convolutional LSTM network, excels at modeling spatiotemporal sequences and is used in applications such as the prediction of rainfall intensity through precipitation nowcasting [30]. The following equations (11-15) are described by Shi et al [30], where ‘*’ denotes the
convolution operator. 𝑖𝑖𝑡𝑡= 𝜎𝜎(𝑊𝑊𝑥𝑥𝑥𝑥∗ 𝑥𝑥𝑡𝑡+ 𝑊𝑊ℎ𝑥𝑥 ∗ ℎ𝑡𝑡−1+ 𝑊𝑊𝑐𝑐𝑥𝑥𝑐𝑐𝑡𝑡−1+ 𝑏𝑏𝑥𝑥) (11) 𝑓𝑓𝑡𝑡= 𝜎𝜎(𝑊𝑊𝑥𝑥𝑥𝑥∗ 𝑥𝑥𝑡𝑡+ 𝑊𝑊ℎ𝑥𝑥 ∗ ℎ𝑡𝑡−1+ 𝑊𝑊𝑐𝑐𝑥𝑥𝑐𝑐𝑡𝑡−1 + 𝑏𝑏𝑥𝑥) (12) 𝑐𝑐𝑡𝑡 = 𝑓𝑓𝑡𝑡𝑐𝑐𝑡𝑡−1+ 𝑖𝑖𝑡𝑡tanh(𝑊𝑊𝑥𝑥𝑐𝑐 ∗ 𝑥𝑥𝑡𝑡+ 𝑊𝑊ℎ𝑐𝑐 ∗ ℎ𝑡𝑡−1+ 𝑏𝑏𝑐𝑐) (13) 𝑜𝑜𝑡𝑡 = 𝜎𝜎(𝑊𝑊𝑥𝑥𝑥𝑥∗ 𝑥𝑥𝑡𝑡+ 𝑊𝑊ℎ𝑥𝑥 ∗ ℎ𝑡𝑡−1 + 𝑊𝑊𝑐𝑐𝑥𝑥𝑐𝑐𝑡𝑡−1+ 𝑏𝑏𝑥𝑥) (14) ℎ𝑡𝑡 = 𝑜𝑜𝑡𝑡tanh(𝑐𝑐𝑡𝑡) (15) 4.0Experiment 4.1Data Collection
Data collection was performed with the capacitance board and microcontroller
interfaced with CapTIvate Design Center. The recorded gestures were saved into multiple CSV files, with each file containing all the recorded attempts of a single gesture type. Each row contained data on the timestamp, mutual capacitance sensor ID, long-term average value, and raw count value. Subtracting the long-term average from the count yielded a delta value, which signified the gestures feature strength located at that capacitance button.
The dataset was initially divided into frames, where each frame contained the data for all 64 capacitance buttons on the board during a timestep. Each gesture recorded was
constructed from multiple frames. The capacitance board continuously recorded data between gestures, resulting in invalid data frames between gestures needing to be removed. To solve
was calculated. A minimum threshold was set, and if the frame’s average was lower than this threshold, the frame was removed. This process removed all blank data frames and left only the frames associated with the recorded gestures. Next, each gesture’s frames needed to be
grouped together. The frames were queried and the distance between timestamps for adjacent frames was calculated. If this distance between frame values was greater than 100ms, all previous frames were grouped and marked as a gesture. While the gestures were being
marked, the highest number of frames required for a recorded gesture was documented. Using this value, the rest of the gesture’s frames were padded to keep each gesture the same length. At this stage, the data was formatted to a three-dimensional shape based on gesture count, frame count, and capacitance button index for each of the 64 frames. The data was finally reshaped to represent the 2D dimensionality of the board, with a shape of gesture count, frame count, capacitance button row index, and capacitance button column index.
Two separate datasets were constructed for testing the machine learning models. The first dataset was created with simple gestures for testing the validity of the model. The gestures in this dataset included a left to right, right to left, up to down, and down to up swipe. The second dataset contained all of the previous gestures in addition to complex gestures, including a tap, rub, northwest to southeast swipe, northeast to southwest swipe, counterclockwise circle, clockwise circle, V shape made with two fingers, and two I’s made with two fingers. Each gesture was recorded 100 times for a total of 400 gestures in the simple dataset and 1,200 in the complex dataset.
The machine learning was coded in Python using TensorFlow, an open-source machine learning library. With the data collection complete, each gesture dataset was split into a training, validation, and testing dataset. Each dataset was shuffled for a random distribution. Multiple machine learning models were tested with both the simple and complex dataset. The first model tested was a basic neural network, constructed of an input layer, hidden layer, and output layer. Next, a recurrent neural network model using an LSTM layer was tested. This model was constructed of an LSTM layer which returned the full output sequence, flattening layer, hidden layer, and a classification layer. The last model tested was a recurrent neural network where the LSTM unit’s matrix multiplication was replaced with 2D-convolution. This model was constructed of a 2D-convolution LSTM layer which returned the full output sequence, flattening layer, hidden layer, and classification layer. Learning hyperparameters, such as number of hidden layers, number of hidden nodes per layer, kernel size, and batch size were altered during the training of the models and the accuracy was compared.
5.0Results
Each model was tested with the simple gestures dataset to verify that the model worked with the constructed datasets. Figure 6 below shows the neural networks accuracy at every epoch, final test accuracy, and final test loss.
Figure 6: Neural network models trained with the basic dataset
Each neural network in this first test used hidden layers with 50 nodes. The basic neural
network and 2D-convolution LSTM network both used ReLU for their activation function, while the LSTM used hyperbolic tangent. The 2D-convolution LSTM used a kernel size of 4x4. The accuracy for each model increased quickly in the initial epochs, and all models ended with a final test accuracy of 100%.
Next, each model was trained and tested with the complex gesture dataset. The results are shown below in Figure 7.
Figure 7: Neural network models trained with the complex dataset
All of the models reached a high test accuracy, with the 2D-convolution LSTM resulting in the highest accuracy of 99.33%.
To observe the effects of kernel size, the LSTM with 2D-convolution model was trained and tested on the complex gesture dataset with a 2x2, 3x3, and 4x4 kernel matrix size. Figure 8 below shows the results of the training.
The results from the training show little difference in the final test accuracy for the different kernel sizes, with the 4x4 kernel having a slightly higher accuracy than the other two models.
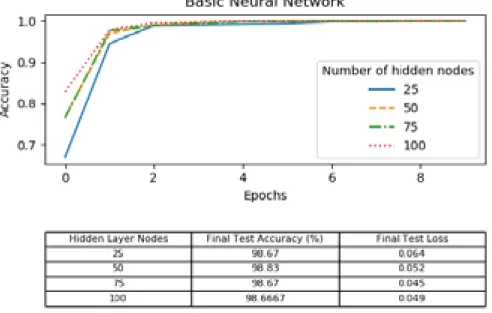
Different sets of hyperparameters were tested with each machine learning model. The effect of changing the number of hidden nodes per layer was observed. Each model was trained with the complex gesture dataset and tested with 25, 50, 75, and 100 nodes in each hidden layer. The results of each network are shown in figures 9 - 11.
Figure 10: Hidden layer node variance on LSTM Neural Network
Figure 11: Hidden layer node variance on LSTM with 2D-convolution Neural Network The number of hidden nodes had a minimal effect on the training and accuracy for the basic neural network, with the final test accuracy peaking at 75 hidden layer nodes for the basic neural network, 50 and 100 for the LSTM network, and 75 and 100 for the 2D-convolution
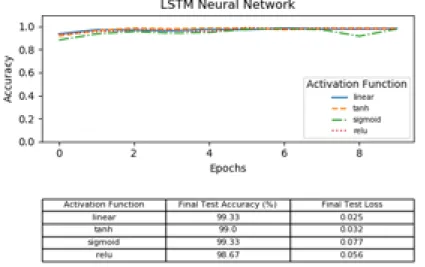
Different activation functions for the hidden layer were tested with the basic and LSTM with 2D-convoloution models. The activation functions tested were the linear, hyperbolic tangent, sigmoidal, and ReLU activation functions. The basic neural network was tested with 10 hidden nodes and the LSTM with 2D-convolution was tested with 50 hidden nodes. The results are shown in figures 12 - 13.
Figure 12: Effects of activation function on basic neural network
Figure 14: Effects of activation function on LSTM with 2D-Convololution neural network In figures 12-14, the activation function is shown having little affect in the training accuracy and final test accuracy. The basic neural network ended with the highest final accuracy when
utilizing the linear activation function, LSTM network with the linear and sigmoid function, and the 2D-convolution network with the tanh and sigmoid.
6.0Conclusion
Machine learning can be used for accurately classifying gesture datasets recorded through a capacitive sensor board. Neural network architectures such as the long short-term memory and convolution layer can both effectively be used to construct machine learning models with high training accuracy. Altering the number of hidden layer nodes for the neural networks’ training caused minimal differences between the models’ training accuracy. Similarly, different
activation functions had little effect on the learning rate for the models. Using a 4x4 kernel size for the 8x8 gesture input data provided a slightly higher accuracy model compared to the 2x2
7.0Future Work
There are several parts of this research that can be expanded upon. With respect to gestures, the trained machine learning models can be integrated with a microcontroller and capacitance board to test real-time classification of gestures. Additional gesture datasets, such as datasets created by people with disabilities, can be processed for relevant training. Gesture datasets constructed around the capabilities of the adaptive gaming audience can be tested to validate the model’s effectiveness. Datasets with noisy and inconsistent gestures can be created to see which machine learning models perform best with this data. Further research can also be explored in the field of machine learning with capacitive sensing. Data collection can be performed on capacitance boards with a varying number of capacitance buttons to observe the effect on training accuracy.
7.1Personal Contribution
The overall scope of this project is to interface the Xbox Adaptive Gaming Controller with a capacitive sensor board to form an input accessory for individuals with disabilities. The
accessory will be integrated with machine learning to recognize certain gestures applicable to the accessory’s user. My main contribution to this project was researching and developing multiple machine learning model’s for recognizing gestures. This process included recording gestures, forming the gesture data into structured datasets for use in the machine learning, creating differing models with varying architectures using the TensorFlow library, and testing
each dataset with these models to discover which ones provided high accuracy for the gesture recognition.
References
[1]
Joutou, T., & Yanai, K. (2009). A food image recognition system with Multiple Kernel Learning. 2009 16th IEEE International Conference on Image Processing (ICIP). doi:
10.1109/icip.2009.5413400. [2]
Alm, C. O., Roth, D., & Sproat, R. (2005). Emotions from text. Proceedings of the Conference on Human Language Technology and Empirical Methods in Natural Language Processing - HLT 05. doi: 10.3115/1220575.1220648
[3]
Fleetwood, M. D., Byrne, M. D., Centgraf, P., Dudziak, K., Lin, B., & Mogilev, D. (2002). An Evaluation of Text-Entry in Palm OS – Graffiti and the Virtual Keyboard. Proceedings of the Human Factors and Ergonomics Society Annual Meeting, 46(5), 617–621. doi:
10.1177/154193120204600504 [4]
Wobbrock, J.O., Wilson, A.D. and Li, Y. (2007). Gestures without libraries, toolkits or training: A $1 recognizer for user interface prototypes. Proceedings of the ACM Symposium on User Interface Software and Technology (UIST '07). Newport, Rhode Island (October 7-10, 2007). New York: ACM Press, pp. 159-168.
[5]
Wobbrock, J.O. (2006). EdgeWrite: A versatile design for text entry and control. Technical Report CMU-HCII-06-104. Ph.D. Dissertation, Carnegie Mellon University, Pittsburgh, PA. 310 pages.
[6]
Bansal, B. (2016). Gesture Recognition: A Survey. International Journal of Computer Applications, 139(2), 8–10. doi: 10.5120/ijca2016909103
[7]
Rabiner, L. R. (1990). A Tutorial on Hidden Markov Models and Selected Applications in Speech Recognition. Readings in Speech Recognition, 267–296. doi: 10.1016/b978-0-08-051584-7.50027-9
[8]
Starner, T., & Pentland, A. (n.d.). Real-time American Sign Language recognition from video using hidden Markov models. Proceedings of International Symposium on Computer Vision -
[9]
Hong, P., Turk, M., & Huang, T. (n.d.). Gesture modeling and recognition using finite state machines. Proceedings Fourth IEEE International Conference on Automatic Face and Gesture Recognition (Cat. No. PR00580). doi: 10.1109/afgr.2000.840667
[10]
A Tutorial on Particle Filters for Online Nonlinear/NonGaussian Bayesian Tracking. (2009). Bayesian Bounds for Parameter Estimation and Nonlinear Filtering/Tracking. doi:
10.1109/9780470544198.ch73 [11]
Black, M. J., & Jepson, A. D. (1998). A probabilistic framework for matching temporal
trajectories: Condensation-based recognition of gestures and expressions. Computer Vision — ECCV98 Lecture Notes in Computer Science, 909–924. doi: 10.1007/bfb0055712
[12]
Bailador, G., Roggen, D., Tröster, G., & Triviño, G. (2007). Real time gesture recognition using continuous time recurrent neural networks. Proceedings of the Second International
Conference on Body Area Networks BodyNets. doi: 10.4108/bodynets.2007.149 [13]
Lin, H.-I., Hsu, M.-H., & Chen, W.-K. (2014). Human hand gesture recognition using a
convolution neural network. 2014 IEEE International Conference on Automation Science and Engineering (CASE). doi: 10.1109/coase.2014.6899454
[14]
Capacitance Board Website PDF
Texas Instruments (2015). 64 Button Capacitive Touch Panel Reference Design [15]
Usama, M., Qadir, J., Raza, A., Arif, H., Yau, K.-L. A., Elkhatib, Y., … Al-Fuqaha, A. (2019). Unsupervised Machine Learning for Networking: Techniques, Applications and Research Challenges. IEEE Access, 7, 65579–65615. doi: 10.1109/access.2019.2916648
[16]
Bouguila, N., & Ziou, D. (2005). Using unsupervised learning of a finite Dirichlet mixture model to improve pattern recognition applications. Pattern Recognition Letters, 26(12), 1916–1925. doi: 10.1016/j.patrec.2005.03.016
[17]
[18]
Barron, A. (n.d.). Approximation Bounds For Superpositions Of A Sigmoidal
Function. Proceedings. 1991 IEEE International Symposium on Information Theory. doi: 10.1109/isit.1991.695141
[19]
Hecht-Nielsen. (1989). Theory of the backpropagation neural network. International Joint
Conference on Neural Networks. doi: 10.1109/ijcnn.1989.118638
[20]
Kingma, D. P. & Ba, J. (2014). Adam: A Method for Stochastic Optimization (cite
arxiv:1412.6980Comment: Published as a conference paper at the 3rd International Conference for Learning Representations, San Diego, 2015)
[21]
Tetko, I. V., Livingstone, D. J., & Luik, A. I. (1995). Neural network studies. 1. Comparison of overfitting and overtraining. Journal of Chemical Information and Modeling, 35(5), 826–833. doi: 10.1021/ci00027a006
[22]
Kumar, P., Chande, S., & Sinha, S. (2019). Convolutional neural network based face recognition approach. TENCON 2019 - 2019 IEEE Region 10 Conference (TENCON). doi:
10.1109/tencon.2019.8929243 [23]
Frizzi, S., Kaabi, R., Bouchouicha, M., Ginoux, J.-M., Moreau, E., & Fnaiech, F. (2016).
Convolutional neural network for video fire and smoke detection. IECON 2016 - 42nd Annual
Conference of the IEEE Industrial Electronics Society. doi: 10.1109/iecon.2016.7793196
[24]
Yu D., Wang H., Chen P., Wei Z. (2014) Mixed Pooling for Convolutional Neural Networks. In: Miao D., Pedrycz W., Ślȩzak D., Peters G., Hu Q., Wang R. (eds) Rough Sets and Knowledge Technology. RSKT 2014. Lecture Notes in Computer Science, vol 8818. Springer, Cham [25]
Graves, A., Mohamed, A.-R., & Hinton, G. (2013). Speech recognition with deep recurrent neural networks. 2013 IEEE International Conference on Acoustics, Speech and Signal
Processing. doi: 10.1109/icassp.2013.6638947
[26]
Zhang, H., Xiao, L., Wang, Y., & Jin, Y. (2017). A Generalized Recurrent Neural Architecture for Text Classification with Multi-Task Learning. Proceedings of the Twenty-Sixth International Joint
![Figure 3: Design of Mutual Capacitance Sensor [14]](https://thumb-us.123doks.com/thumbv2/123dok_us/504807.2559553/10.918.175.736.88.385/figure-design-of-mutual-capacitance-sensor.webp)
![Figure 4: Layout of the Mutual Capacitance Sensors [14]](https://thumb-us.123doks.com/thumbv2/123dok_us/504807.2559553/11.918.269.644.83.465/figure-layout-mutual-capacitance-sensors.webp)
![Figure 5: Long short-term memory cell [19]](https://thumb-us.123doks.com/thumbv2/123dok_us/504807.2559553/16.918.143.760.429.896/figure-long-short-term-memory-cell.webp)