Institutionen för Biovetenskaper och Näringslära
Application of next generation
sequencing in genetic and genomic
studies
AKADEMISK AVHANDLING
som för avläggande av medicine doktorsexamen vid Karolinska
Institutet offentligen försvaras i 9Q Månen, Alfred Nobels Allé 8,
Karolinska Institutet, Huddinge
Fredagen den 9 september, 2016, kl 09.30
av
Jingwen Wang
MSc.
Huvudhandledare: Dr. Hong Jiao Karolinska InstitutetInstitutionen för Biovetenskaper och Näringslära
Bihandledare:
Professor Juha Kere Karolinska Institutet
Institutionen för Biovetenskaper och Näringslära
Dr. Thomas Svensson
Chalmers Tekniska Högskolan
Institutionen för Biologi och Bioteknik
Fakultetsopponent:
Professor Sampsa Hautaniemi Helsinfors Universitet
Medicinska Fakulteten
Betygsnämnd:
Professor Mauno Vihinen Lunds Universitet
Institutionen för Experimentell Medicinsk Vetenskap
Docent Olof Emanuelsson Kungliga Tekniska Högskolan Skolan för Bioteknologi Docent Ingrid Kockum Karolinska Institutet
From Department of Biosciences and Nutrition
Karolinska Institutet, Stockholm, Sweden
APPLICATION OF NEXT GENERATION
SEQUENCING IN GENETIC AND GENOMIC
STUDIES
Jingwen Wang
王靜文
All previously published papers were reproduced with permission from the publisher. Front cover shows the sequence of zebrafish new transcripts discovered and validated in this study. Cover page illustration by Zidong Lin.
Published by Karolinska Institutet. Printed by E-print AB
© Jingwen Wang, 2016 ISBN 978-91-7676-321-6
Application of next generation sequencing in genetic
and genomic studies
THESIS FOR DOCTORAL DEGREE (Ph.D.)
By
Jingwen Wang
Principal Supervisor: Dr. Hong Jiao Karolinska Institutet
Department of Biosciences and Nutrition Co-supervisor(s):
Professor Juha Kere Karolinska Institutet
Department of Biosciences and Nutrition Dr. Thomas Svensson
Chalmers Unversity of Techonology Department of Biology and Biological Engineering
Opponent:
Professor Sampsa Hautaniemi University of Helsinki Faculty of Medicine
Examination Board: Professor Mauno Vihinen Lund University
Department of Experimental Medical Science Docent Olof Emanuelsson
KTH Royal Institute of Technology School of Biotechnology
Docent Ingrid Kockum Karolinska Institutet
As you do not know the path of the wind, or how the body is formed in a mother's womb, so you cannot understand the work of God, the Maker of all things.
獻給我摯愛的父母
感謝他們永不止息的愛
ABSTRACT
Genetic variants that spread along the human genome play vital roles in determining our traits, affecting development and potentially causing disorders. Most common disorders have complex underlying mechanisms involving genetic or environmental factors and the interaction between them. Over the past decade, genome-wide association studies (GWAS) have identified thousands of common variants that contribute to complex disorders and partially explain the heritability. However, there is still a large portion that is unexplained and the missing heritability may be caused by several factors, such as rare or low-frequency variants with high effect that are not covered by GWAS and linkage analysis. With the development of next generation sequencing (NGS), it is possible to rapidly detect large amount of novel rare and low-frequency variants simultaneously at a low cost. This new technology provides vast information on studying the association of genetic variations and complex disorders. Once the susceptibility gene is mapped, model organisms such as zebrafish (Danio rerio) are popular for further investigating the possible function of disease-associated gene in determining the phenotype. However, the genome annotation of zebrafish is not complete, which affects the characterization of gene functions. Accordingly, high-throughput RNA sequencing can be employed for identifying new transcripts.
In our studies, pooled DNA samples were used for whole genome sequencing (WGS) and exome sequencing. In Paper I, we evaluated minor allele frequency (MAF) estimates using three variant detection tools with two sets of pooled exome sequencing and one set of pooled WGS data. The MAFs from the pooled sequencing data demonstrated high concordance (r = 0.88-0.94) with those from the individual genotyping data. In Paper II, exome sequencing implementing pooling strategy was performed on 100 idiopathic scoliosis (IS) patients for mapping susceptibility genes. After validating 20 candidate single nucleotide variants (SNVs), we did not find associations between them and IS. However, the previously reported common variant rs11190870 near LBX1 was validated in a large Scandinavian cohort. In Paper III, we analyzed WGS of pooled DNA samples performed on 19 affected individuals who shared a phenotype-linked haplotype in a dyslexic Finish family. Two of the individuals were sequenced for the whole genome individually as well. The screen for causative variants was narrowed down to a rare SNV, which might affect the binding affinity of LHX2 that regulated dyslexia associated gene ROBO1. In Paper IV, RNA sequencing (RNA-seq) data were analyzed for identifying novel transcripts in zebrafish early development using an in-house pipeline. We discovered 152 novel transcribed regions (NTRs), validated more than 10 NTRs and quantified their expression in early developmental stages.
In our studies, we evaluated and applied a pooling approach for identifying variants susceptible to disease using high-throughput DNA sequencing. Based on RNA sequencing data, we provided new information for genome annotation on model organism zebrafish, which is valuable for studying the function of disease causative genes. In summary, the whole series of studies demonstrate how NGS can be applied in studying the genetic basis of complex disorders and assisting in follow-up functional studies in model organisms.
LIST OF SCIENTIFIC PAPERS
I. Wang J, Skoog T, Einarsdottir E, Kaartokallio T, Laivuori H, Grauers A, Gerdhem P, Hytönen M, Lohi H, Kere J, Jiao H.
Investigation of rare and low-frequency variants using high-throughput sequencing with pooled DNA samples.
Manuscript submitted to Sci Rep. and under review
II. Grauers A†, Wang J†, Einarsdottir E, Simony A, Danielsson A, Åkesson K, Ohlin A, Halldin K, Grabowski P, Tenne M, Laivuori H, Dahlman I, Andersen M, Christensen SB, Karlsson MK, Jiao H, Kere J, Gerdhem P.
Candidate gene analysis and exome sequencing confirm LBX1 as a susceptibility gene for idiopathic scoliosis.
Spine J. 2015 Oct 1;15(10):2239-46. doi: 10.1016/j.spinee.2015.05.013. III. Massinen S, Wand J, Laivuori K, Bieder A, Paez IT, Jiao H, Kere J.
Genomic sequencing of a dyslexia susceptibility haplotype encompassing ROBO1.
J Neurodev Disord. 2016 Jan 27;8:4. doi: 10.1186/s11689-016-9136-y. IV. Wang J, Vesterlund L, Kere J, Jiao H.
Identification of novel transcribed regions in zebrafish (Danio rerio) using RNA-sequencing
Manuscript submitted to PLoS One and under review † Equal contribution to the work
Other publications not involved in this thesis
I. Smialowska A, Djupedal I, Wang J, Kylsten P, Swoboda P, Ekwall K. RNAi mediates post-transcriptional repression of gene expression in fission yeast Schizosaccharomyces pombe.
Biochem Biophys Res Commun. 2014 Feb 7;444(2):254-9
II. Kaartokallio T†, Wang J†, HeinonenS, Kajantie E, Kivinen K, Pouta A, Gerdhem P, Jiao H, Kere J, Laivuori H.
Exome sequencing in pooled DNA samples to identify maternal pre-eclampsia risk variants.
Sci Rep. 2016. In press † Equal contribution to the work
CONTENTS
1 Background ... 1
1.1 Genetic variations ... 1
1.1.1 Different types of genetic variations ... 1
1.1.2 Effects ... 2
1.2 Disorders ... 3
1.2.1 Monogenic disorders ... 3
1.2.2 Complex disorders ... 3
1.3 Gene mapping in disorders ... 4
1.3.1 Linkage analysis ... 5
1.3.2 Association studies ... 5
1.4 Missing heritability of complex disorders ... 6
1.5 Functional studies following identification of disease-causative genes ... 7
1.5.1 In silico ... 8
1.5.2 In vivo – model organisms ... 8
2 Introduction ... 9 2.1 NGS platforms ... 9 2.1.1 Illumina ... 10 2.1.2 SOLiD ... 11 2.1.3 Complete Genomics ... 11 2.2 NGS application ... 11
2.2.1 Whole genome sequencing and exome sequencing ... 11
2.2.2 RNA sequencing ... 14
2.3 Bioinformatic analysis of NGS data ... 15
3 Aims ... 16
4 Materials and methods ... 17
4.1 Study subjects and materials ... 17
4.1.1 Idiopathic scoliosis (IS) case-control cohorts ... 17
4.1.2 Preeclampsia (PE) case-control cohorts and families ... 17
4.1.3 Affected members of a dyslexia family ... 18
4.1.4 A Bull Terrier tail-chasing case-control cohort ... 18
4.1.5 Zebrafish embryos ... 18
4.2 Next generation sequencing ... 19
4.2.1 Pooling strategy ... 19
4.2.2 Library preparation and sequencing ... 20
4.3 Data analysis ... 20
4.3.1 Alignment of sequencing reads ... 20
4.3.2 Detection of genetic variations ... 21
4.3.3 Evaluation of allele frequency estimates ... 22
4.3.4 Annotation and filtering of variants ... 23
4.3.5 Association analysis ... 24
4.3.7 Gene expression ... 25 4.4 Experimental validation ... 25 4.4.1 Genotyping ... 25 4.4.2 PCR ... 26 4.4.3 RT-PCR ... 26 4.4.4 qRT-PCR ... 26 4.4.5 Sanger sequencing ... 26 4.4.6 Functional studies ... 26 5 Results ... 27
5.1 Evaluation of pooling strategy (Paper I) ... 27
5.2 Pooled exome sequencing and candidate gene for studying IS (Paper II) ... 28
5.3 Whole genome sequencing of dyslexia susceptibility haplotype (Paper III) .... 28
5.4 Identification of NTRs using RNA-seq (Paper IV) ... 29
6 Discussion ... 31
7 Conclusion and future perspective ... 33
8 Acknowledgements ... 35
LIST OF ABBREVIATIONS
AAF Alternative allele frequency
AKAP2 A-kinase anchoring protein 2
APP Amyloid beta precursor protein
BAM Binary alignment map
bp base pair
CAGE Cap analysis of gene expression
CEP63 Centrosomal protein 63
CNV Copy number variation
DCDC2 Doublecortin domain containing 2
DD Developmental dyslexia
DNA Deoxyribonucleic acid
dyx1c1 Dyslexia susceptibility 1 candidate 1
EMSA Electrophoretic mobility shift assay
FANTOM Functional ANnoTation Of the Mammalian genome
FBN1 Fibrillin 1
FBN2 Fibrillin 2
GATK Genome Analysis Toolkit
GWAS Genome-wide association study
HapMap Haplotype map
HGP Human genome project
HSPG2 Heparan sulfate proteoglycan 2
INDEL Insertion or deletion
IS Idiopathic scoliosis
kb Kilo base pairs
LBX1 Ladybird homeobox homolog 1
LHX2 LIM homeobox 2
MAF Minor allele frequency
Mb Mega base pairs
NGS Next generation sequencing
OMIM Online Mendelian Inheritance in Man
ORF Open reading frame
PCR Polymerase chain reaction
PE Preeclampsia
POC5 POC5 centriolar protein
PSEN1 Presenilin 1
PSEN2 Presenilin 2
ptk7 Protein tyrosine kinase 7b
qRT-PCR Quantitative reverse transcription polymerase chain reaction
ROBO1 Roundabout guidance receptor 1
RNA Ribonucleic acid
RNA-seq RNA sequencing
RT-PCR Reverse transcription polymerase chain reaction
SAM Sequencing alignment map
SNP Single nucleotide polymorphism
SNV Single nucleotide variant
SMRT Small-molecule real-time
SV Structural variation
S100B S100 calcium binding protein B
TFBS Transcription factor binding site
1 BACKGROUND
“Like father, like son” is probably the best-fitting proverb to describe heredity. Nowadays, almost everyone knows the causation of such patterns is inheritance. What are the factors in determining the variation of inherited characteristics? The first recorded successful attempt to answer the question is from Gregor Mendel, who discovered the law of inheritance and the heredity units, now called “genes”. Genes, lying on the double helix of DNA strands, are composed of four basic elements -- two purines, adenine (A) and guanine (G), and two pyrimidines, thymine (T) and cytosine (C). The combination and order of the four nucleotides cause the diversity of characters and traits in human beings. After the launch of the Human Genome Project (HGP) and release of the human genome sequence (Consortium, 2004; Lander et al., 2001; Venter et al., 2001), we have a clearer vision of the genes encoded in the human genome. At the same time, powerful bioinformatics software have been developed to decode the hidden messages written in our genome. The complete reference sequence and new tools allow us to dig more deeply into genomes for identifying the genes corresponding to or associated with specific phenotypes, especially disorders.
1.1 GENETIC VARIATIONS
The completion of the HGP revealed the sequences of 3 billion base pairs DNA, and more than 25,000 protein coding genes. Over 99% of DNA sequences in the human genome are consistent, while thousands of genetic variations have been observed across the human genome. We can divide them into different types based on their sizes: small-scale sequencing variation and large-scale structural variation.
1.1.1 Different types of genetic variations
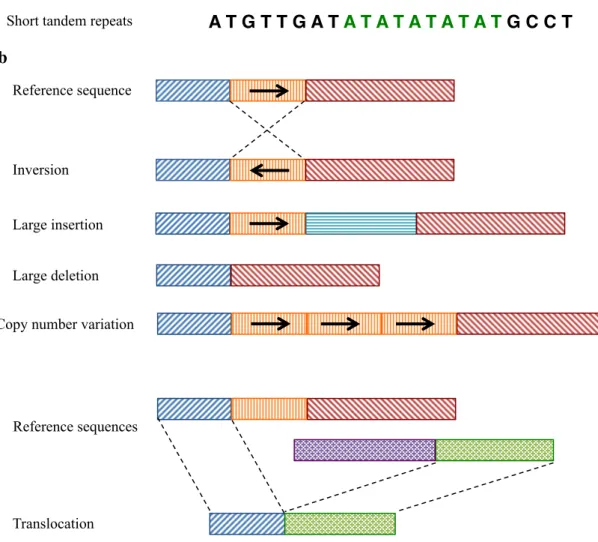
The largest group of small-scale sequencing variations is the single nucleotide variant (SNV) (Figure 1a). An SNV is described as a substitution of a single nucleotide. DNA substitutions are classified as transitions (between two purines or two pyrimidines) and transversions (interchanges of purines for pyrimidines). The majority of the single base pair variations can have two forms of alleles, either transition or transversion. However, some polymorphic sites may be complex, e.g. three to four alternative alleles. SNVs with frequency in population of over 1% were termed as single nucleotide polymorphisms (SNPs). A total number of 1.42 million SNPs were identified in the human genome draft (Sachidanandam et al., 2001). In addition to SNVs, short insertions or deletions (INDELs) and short repeats distribute across all or part of the genome (Figure 1b). An INDEL is a deleted base(s) or extra inserted base(s) ranging from 1 bp to 1 kb in DNA sequencing. Tandem repeats are one kind of short repeats and can be divided into three categories according to the length of repeat units: satellites (over 50 bp), minisatellites (10-50 bp) and microsatellites (less than 10 bp). Most microsatellites have repeats of one to four nucleotides.
Large-scale structural variations (SVs) can be defined as the rearrangement of segments over 1kb (Feuk et al., 2006). Some major structurally abnormal variants include copy number
variations (CNVs), inversions and translocations (Figure 1b). CNVs represent deletions, insertions or duplications of long tandemly repeated sequences. Although SNPs are most abundant in the genome, structural variations actually affect more numbers of nucleotides.
Figure 1. Different types of genetic variations a) Small-scale sequencing variation, b) Large-scale structural variation. Each color block represents a long DNA sequencing over 1kb.
1.1.2 Effects
A single nucleotide substitution in coding regions can change the encoded protein sequence, such as a missense variant. A nonsense mutation generates a stop codon and truncates the protein. A silent variant usually alters DNA sequences but not protein sequences. The point variants that can change the protein sequence are classified as non-synonymous variants, while those that do not affect protein sequence are synonymous variants. Any coding INDEL with a size at a non-integral number of codon causes a shift of open reading frame (ORF), consequently altering the protein sequence. Alternative splicing of primary transcripts can be
Single nucleotide variant Small deletion Small insertion A T G T T G A T G C C T A T G T T G C T G C C T A T G T T G G C C T A T G T T G ATT G C C T
Copy number variation Reference sequence Reference sequence Inversion Large insertion Large deletion Translocation Reference sequences
Short tandem repeats A T G T T G A T A T A T A T A T A T G C C T a
affected by both SNVs and INDELs located near the splicing site. A large-scale structure variation will lead to loss dysfunction or duplication of the genes harbored in the SV regions. The genetic variations at non-coding regions may change the binding of transcription factors or regulation elements and DNA methylation, thus affecting the gene expression nearby. There are more than 3 million genetic variants in two published individual diploid genomes (Levy et al., 2007; Wheeler et al., 2008). According to evolution, most of the variants in the human genome are harmless and do not have known effect on phenotypic traits. Certain genetic variations endow individual person with specific characteristics, e.g. skin color and eye color, body height and blood type. However, others may produce loss or gain of functions and result in disorder or susceptibility to diseases. For example, sickle cell disease and cystic fibrosis are determined by genetic variants in a single gene.
1.2 DISORDERS
1.2.1 Monogenic disorders
A disorder governed by a single gene with a clear pattern of Mendelian inheritance is called a monogenic (Mendelian) disorder. The two diseases mentioned in 1.1.2 are typical examples of monogenic disorders. There are five basic modes of Mendelian inheritance patterns: autosomal dominant, autosomal recessive, X-linked dominant, X-linked recessive and Y-linked. In recessive mode, the phenotype is only expressed when the underlying locus is homozygous. In dominant mode, the phenotype is expressed as long as the underlying locus is heterozygous.
1.2.2 Complex disorders
The inheritance of most common disorders does not always follow Mendelian patterns. Disorders may be governed by multiple genetic loci and environmental factors, therefore defined as complex or multifactorial disorders. For example, most early on-set Alzheimer patients are caused by any mutation in genes PSEN1, PSEN2 or APP in a autosomal dominant inheritance pattern (Bateman et al., 2012), while sporadic cases are affected by the environment as well (Gatz M et al., 2006). Complex disorders are usually determined by several gene loci with small effect (polygenic inheritance) or one locus with a major effect on the phenotype, modified by other genes with minor effects (oligogenic inheritance). Two complex disorders involved in the studies in this thesis are described below.
1.2.2.1 Idiopathic scoliosis
Scoliosis is a three-dimensional deformity of the spine as a lateral curvature of the spine in the coronal plane of more than 10° (Terminology Committee of the Scoliosis Research Society, 1976). It is usually classified into three major types: congenital (spinal abnormity at birth), syndromic (typically related neuromuscular, skeletal or connective tissue disorders) and idiopathic (causes unknown) (Altaf et al., 2013).
Idiopathic scoliosis (IS) constitutes the largest subgroup of human spinal curvatures (Gorman et al., 2012) and affects approximately 2-3% of the population worldwide (Luk et al., 2010; Rogala et al., 1978; Willner and Udén, 1982). The onset age can range from infant to adolescent, especially developing in childhood and adolescence. In a school-screen program, if there is a rib hump visible during an Adam’s forward bend test, the individual will be sent for an X-ray. The clinical diagnosis of scoliosis is confirmed by a standing spinal radiograph showing a lateral curvature of the spine over 10 degrees. Even though the etiology of IS is poorly understood, heredity is recognized as an important contribution factor to it (Grauers et al., 2012; Wynne-Davies, 1968).
1.2.2.2 Developmental dyslexia
Dyslexia refers to a difficulty in reading and writing, in despite of normal senses, intelligence, and adequate education. It can be classified into two types: acquired dyslexia (caused by brain damage) and developmental dyslexia (DD). The typical symptoms of DD include spelling errors, slow naming of letters and words and poor verbal short-term memory. They can be mostly covered by phonological deficits (Ramus and Szenkovits, 2008). According to the epidemiological reports in the 1990s, the prevalence rates of DD range from 5 to 10% and possibly even to 17.5% (Shaywitz, 1998). It is the most common learning disability in childhood and may be diagnosed at school age after parents or teachers notice difficulties in reading and writing. The diagnosis test for dyslexia measures a series of reading-related cognitive skills, involving phonological decoding, phonological awareness, orthographic coding, rapid automatic naming, word recognition and spelling (Francks et al., 2002).
In addition to gender, environmental factors and co-occurrences with many other neurodevelopmental disorders (Friend et al., 2008; Gilger et al., 1992; Katusic et al., 2001; Paracchini, 2011; Rutter M et al., 2004), genetic factors are recognized as playing an important role in the etiology of dyslexia. Several twin studies demonstrate almost twice the concordance in monozygotic twins than that in dizygotic twins, suggesting a significant genetic component in dyslexia (Bakwin, 1973; DeFries et al., 1987; Harlaar et al., 2005; Hawke et al., 2006; Stevenson et al., 1987). In general, dyslexia shows complex genetic patterns: incomplete penetrance (Fagerheim et al., 1999), phenocopy (Nopola-Hemmi et al., 2001), heterogeneity of susceptibility loci in different families and polygenic influence (Fisher and DeFries, 2002).
1.3 GENE MAPPING IN DISORDERS
The crossover of homologous chromosomes usually occurs during prophase of meiosis I, causing recombination. In principle, the loci physically nearby are less likely to be segregated during recombination. Gene mapping aims to identify the underlying determinants of phenotypes based on co-segregation pattern of all loci, which are also called genetic markers. Some genetic variations, e.g. microsatellite and SNP (described in 1.1.1), are used as markers for gene mapping.
1.3.1 Linkage analysis
Linkage analysis focuses on the likelihood of recombination fraction between two loci in a family. The achievement of such analysis requires three parameters: a clear pattern of inheritance, highly polymorphic marker and penetrance of each genotype. Such test is called parametric analysis. In the late 20th century, microsatellites were employed as genetic markers in linkage studies. They were replaced by SNP arrays that can test much denser genetic markers along the genome simultaneously. Parametric analysis succeeds in mapping disease locus in monogenic disorders that show clear Mendelian inheritance patterns. However, it is very difficult to map susceptibility loci to complex disorders because the genotype and phenotype usually are in incomplete correspondence (Altmüller et al., 2001). To overcome this problem, a different approach is to seek the chromosomal segments shared by affected members in the family regardless of inheritance pattern. Since the genetic mode parameter is missing in the analysis, this approach is called non-parametric analysis.
In the case of DD, most cases show a pattern of complex traits. However, some large or multiple small families displayed Mendelian inheritance patterns. Accordingly a series of genetic linkage studies have been performed (Kere, 2011). By far, nine gene loci were pinpointed and considered as dyslexia susceptibilities in the OMIM database (http://omim.org/). In a linkage study of a three-generation Finnish dyslexic family, a 33 Mb region (3p12-q13) on chromosome 3 was found to be associated with dyslexia (Nopola-Hemmi et al., 2001). The same region (3q13) was supported by a genome-wide scan on dyslexic families in the US (Fisher et al., 2002). The susceptibility loci on chromosome 3 were later reported to be linked to speech-sound disorder (Stein et al., 2004). Follow-up studies investigating the linkage region indicated ROBO1 as a susceptibility gene for dyslexia (Hannula-Jouppi et al., 2005; Lamminmäki et al., 2012).
1.3.2 Association studies
Another approach to reveal the incomplete relationship between genotype and phenotype is association study. The rationale of association study is based on linkage disequilibrium (LD), which is a non-random association of allele at two or more loci. As a result of linkage analysis on complex disorders, the susceptibility loci may be several Mb, which normally harbor many genes. For this reason, extra work and effort on studying the candidate genes in the loci need to be addressed. The association study is usually performed on a group of unrelated affected individuals and a group of unrelated controls. If there is an association between a phenotype and genotype, the probability of seeing the specific genotype will be greater than by chance in an individual with the phenotype.
1.3.2.1 Genome-wide association studies
In 2002, the International HapMap Project was launched, aiming to construct a map of common genetic variants in the human genome (Gibbs et al., 2003). The project investigates the genotypes of sequencing variants, their frequencies and the link between them within different populations. It provides vast tag SNPs to capture large proportion of variants for
association study on genome-wide scale. At the same time, the high-throughput microarray enables the investigation of thousands of SNPs simultaneously at an inexpensive cost. A genome-wide association study (GWAS) genotypes a dense set of SNPs across the genome to investigate common variants for their links to disorders and quantitative traits (Hirschhorn and Daly, 2005). Compared with genome-wide linkage scan, a GWAS is more powerful for identifying disease-associated variants with moderate effect (Risch and Merikangas, 1996). Consequently, it is an efficient and powerful tool for analyzing the genetic architecture of complex disorders. When testing multiple SNPs on a genome-wide scale, each SNP represents one hypothesis. Accordingly, the significance levels should be corrected for the number of SNPs. Assuming a power of 0.5, the threshold of genome-wide significance is 5×10⁻⁷.
The first published GWAS was performed on a cohort of about 14,000 cases and 3,000 shared controls (Burton et al., 2007). This study discovered several genome-wide associations (P < 5x10⁻⁷) between genotypes and human complex disorders, e.g. coronary artery disease, Crohn's disease, rheumatoid arthritis, bipolar disorder, type I and type II diabetes. The GWAS catalog (https://www.ebi.ac.uk/gwas/) was initially developed for collecting SNP-trait associations reported from published genome-wide association studies (Hindorff et al., 2009). For the past 10 years, more than 10,000 SNPs were identified to be strongly associated (P< 5x10⁻⁸) with complex traits (Welter et al., 2014).
In the case of IS, a GWAS of a Japanese case-control cohort identified a SNP (rs11190870) near LBX1 significantly associated with IS (Takahashi et al., 2011). The same case and control sample sets demonstrated more association The strong association of LBX1 with IS was replicated in Chinese and Caucasian populations (Fan et al., 2012; Gao et al., 2013; Jiang et al., 2012; Londono et al., 2014). Several other gene regions have been reported to show association with IS in Asian and Caucasian population (Kou et al., 2013; Miyake et al., 2013; Sharma et al., 2011), however they are not easy to replicate in other populations.
1.4 MISSING HERITABILITY OF COMPLEX DISORDERS
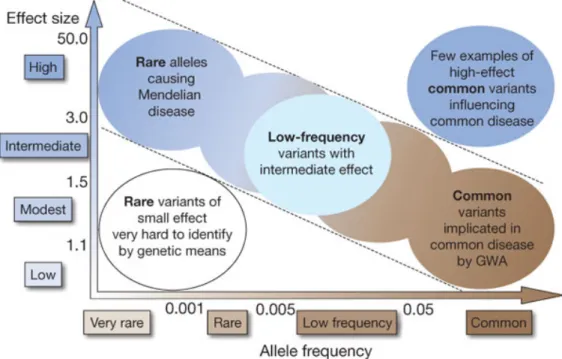
Even though linkage study and genome-wide association study have demonstrated great success in mapping disease-associated genes, the identification of genetic variations that contribute to complex disorders was becoming slow and arduous (Hardy and Singleton, 2009). Linkage analysis provided amounts of knowledge on high-risk rare alleles underlying monogenic disorder. Though those variants have high penetrance, their frequencies in the population are extremely rare. Beyond linkage study, GWAS is based on the hypothesis that common disease may be caused by common variants with high to low effects (Collins et al., 1997). However, the screening for common variants resulted in lower impact of genetic factors on complex traits than we expected. For example, the heritability of age-related macular degeneration may be 50% explained by small amount of common variants that have high effects (Maller et al., 2006). On the other hand, more than 40 genetic loci can only explain about 5% of the heritability of height (Visscher, 2008). According to the minor allele frequency (MAF) in the tested population, genetic variations are categorized into rare (MAF
< 1%), low-frequency (MAF between 1% to 5%) and common variants (MAF > 5%). If we look at Figure 2, monogenic disorder causative rare variants and common variants with high or low impact lying on the corners of the spectrum can be detected by family-based linkage study or GWAS. There is a large portion of low-frequency variants with moderate effect that cannot be covered by traditional genetic approaches.
Figure 2. Feasibility of identifying genetic variants by risk allele frequency and strength of genetic effect (odds ratio). Most emphasis and interest lies in identifying associations with
characteristics shown within diagonal dotted lines. Adapted from (McCarthy et al., 2008). The reprint permission of this figure from (Manolio et al., 2009) was granted by Nature Publishing Group.
Mapping of susceptibility gene in complex disorder is far from a simple task. Several explanations have been suggested for explaining missing heritability (Manolio et al., 2009). Firstly, there may be more common variants with low impact on complex disorders. Secondly, aside from common variants, rare and low-frequency variants likely contribute to phenotype with large effects that are poorly detected. Thirdly, the structure variations that affect larger regions than point mutations are poorly captured by SNP arrays. In addition, low power to detect gene-gene interaction and inadequate estimation for shared environment are other potential sources of missing heritability. For these reasons, there is a large demand for developing a new technique to investigate rare and low-frequency variants, as well as structure variation.
1.5 FUNCTIONAL STUDIES FOLLOWING IDENTIFICATION OF DISEASE-CAUSATIVE GENES
To understand the effect of genetic variants and susceptibility genes on a disorder, many approaches at different levels have been applied. The computational predictions based on experimental data are usually the first step to study the function of genetic variants. In addition to computational approaches, experimental investigation is more than required for understanding gene function. Manipulating cultured human cell lines is a standard method in
detecting the consequence of genetic variants and gene function in vitro. Furthermore, to mimic the gene regulations in vivo, animal models are widely used for studying human disorders.
1.5.1 In silico
The function of genetic variation can be predicted according to the genomic location. Missense, nonsense, splicing mutation and frame-shift INDEL directly change the protein sequence. Several tools have been developed for predicting the effect of amino acid substitution on protein structure and function based on machine, e.g. SIFT, PolyPhen-2 (Adzhubei et al., 2010; Ng and Henikoff, 2001; Ramensky et al., 2002), based on either the conservation of homolog protein sequence or the physical property of amino acid. To investigate variants in non-coding regions that may be involved with regulation of gene expression, the information from ENCODE (Encyclopedia of DNA Elements) project can be employed. ENCODE provides a variety of data generated with different assays to understand functional elements in the human genome, including DNA methylation, transcription factor binding site (TFBS) and RNA binding site, etc. (Consortium, 2012b).
1.5.2 In vivo – model organisms
Even though the functional study in cells has provided insight into gene regulation, it cannot mimic the interactions between different types of cells in a living organism. Moreover, certain types of cell line are very difficult to culture. Therefore, it is necessary to study gene function and simulate the dysfunction of candidate genes in model organisms. One approach to perform genetic manipulation in model organisms is to make a transgenic animal by introducing an exogenous DNA with a genetic mutation into zygotes. Another way is to modify the target sequence in an endogenous gene with a mutant version. To investigate the consequence of deletion and translocation, a candidate gene is knocked out by site-specific recombination, RNAi pathway or blocking their expression by using morpholino antisense oligonucleotides.
Because of its short generation time and large amount of eggs, zebrafish has become a principle vertebrate model for characterizing the function of genes involved in development and disease, especially when the sample of functional tissue is not available to access in a living human. To understand the function of certain susceptibility genes in dyslexia and IS, several studies have already been performed on zebrafish. The dyslexia candidate gene orthologue in zebrafish dyx1c1 proved to control cilia growth, axonemal dynein assembly and cilia motility (Chandrasekar et al., 2013; Tarkar et al., 2013). The zebrafish ptk7 mutants developed distinct spinal deformities, and later ptk7 appeared to be involved in cilia mobility that is required for spine morphogenesis (Grimes et al., 2016; Hayes et al., 2014). Three functional variants on human IS-associated POC5 were examined on the zebrafish model and the expression of those variant RNAs demonstrated spine deformity (Patten et al., 2015). Moreover, the overexpression of lbx1 homologs in zebrafish causes body axis deformation, including defective convergent extension movement and body curvature (Guo et al., 2016).
2 INTRODUCTION
A technique developed for sequencing DNA enabled the reading of the nucleotide sequence of a whole gene in the 1970s (Sanger et al., 1977). This technique was applied in the HGP for sequencing the human genome in the 1990s, and it took more than 10 years to complete the HGP. The Sanger-based method was regarded as the first generation of DNA sequencing. In the last decade a new technique that can produce millions or billions of DNA sequence fragments in a short time has been innovated to replace the slow and laborious first generation sequencing with limited output at a high cost. Accordingly the new method is referred to as next generation sequencing (NGS).
2.1 NGS PLATFORMS
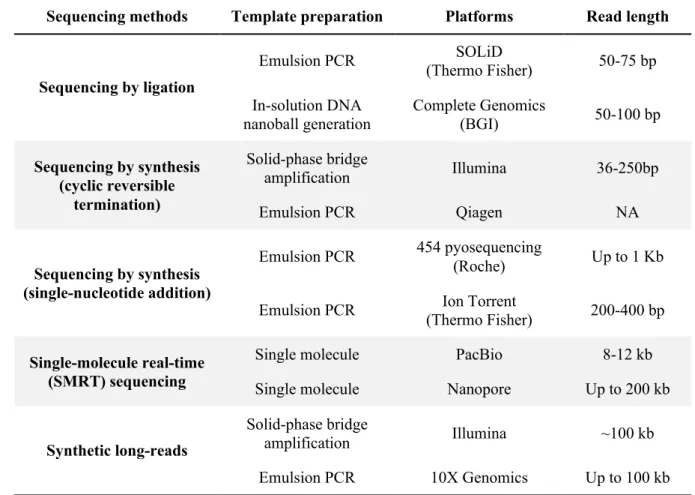
The procedure of NGS is composed of two major parts: 1) DNA template preparation and 2) sequencing and imaging. The first step for preparing template is fragmentation. DNA templates were randomly sheared into small-size fragments. For short-read NGS, the length of fragment ranges from 50 bp to 400 bp, depending on platform and library kit, while the long reads could be up to 100 or 200 kb in length for long-read NGS (Table 1). The template fragments were then ligated to adaptors for amplification (except SMRT method) and sequencing. Illumina, SOLiD and Complete Genomics platforms are employed for genetic and genomic studies in this thesis, so the sequencing approaches are briefly described below. Table 1. Brief summary of NGS platform, adapted from (Goodwin et al., 2016)
Sequencing methods Template preparation Platforms Read length
Sequencing by ligation Emulsion PCR SOLiD (Thermo Fisher) 50-75 bp In-solution DNA nanoball generation Complete Genomics (BGI) 50-100 bp Sequencing by synthesis (cyclic reversible termination) Solid-phase bridge amplification Illumina 36-250bp Emulsion PCR Qiagen NA Sequencing by synthesis (single-nucleotide addition) Emulsion PCR 454 pyosequencing (Roche) Up to 1 Kb
Emulsion PCR Ion Torrent
(Thermo Fisher) 200-400 bp
Single-molecule real-time (SMRT) sequencing
Single molecule PacBio 8-12 kb
Single molecule Nanopore Up to 200 kb
Synthetic long-reads
Solid-phase bridge
amplification Illumina ~100 kb
2.1.1 Illumina
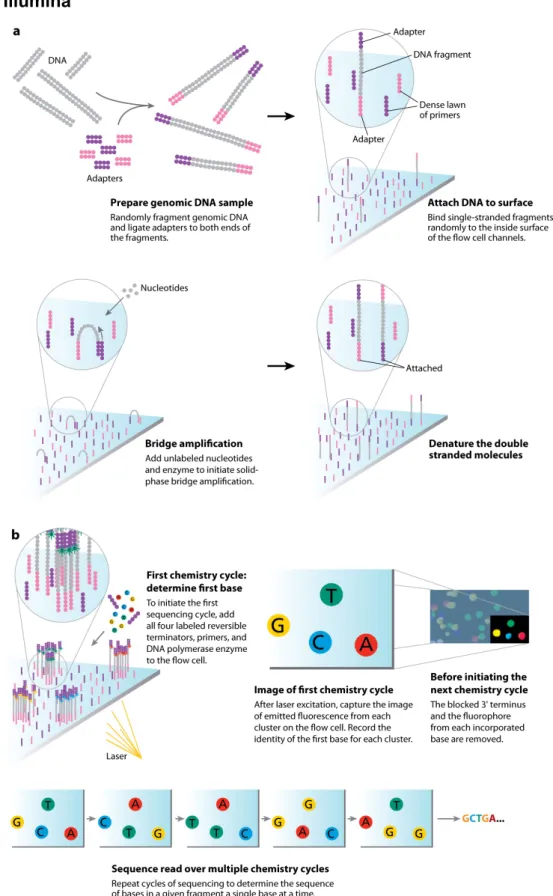
Figure 3. The Illumina sequencing-by-synthesis approach. Cluster strands created by bridge amplification are
primed and all four fluorescently labeled, 3’-OH blocked nucleotides are added to the flow cell with DNA polymerase. The cluster strands are extended by one nucleotide. Following the incorporation step, the unused nucleotides and DNA polymerase molecules are washed away, a scan buffer is added to the flow cell, and the optics system scans each lane of the flow cell by imaging units called tiles. Once imaging is completed, chemicals that effect cleavage of the fluorescent labels and the 3’-OH blocking groups are added to the flow cell, which prepares the cluster strands for another round of fluorescent nucleotide incorporation. (Mardis, 2008)
In the Illumina platform, the adapted DNA templates are randomly ligated on the solid slide surface of a flow cell. The inside surface contains both forward and reversed primers complementary to the adaptors of the DNA template. Then the bridge amplification is then performed to enrich the spatially separated DNA template clusters (Figure 3a). After detaching one end of primer, the DNA clusters are sequenced by cyclic reversible termination approach. Four 3’-blocked deoxynucleotides (dNTPs) labeled with fluorescent and DNA polymerase are simultaneously added to the flow cell channel. After the incorporation of a dNTP to a template cluster, the emitted fluorescent is captured to determine the identity of the incorporated nucleotide of each cluster in the current cycle (Figure 3b). Before moving to next cycle, a cleavage step is performed to remove the terminus and the fluorescent label, together with an additional wash.
2.1.2 SOLiD
In the SOLiD platform, the DNA templates attached with adaptors are ligated to magnetic beads that are located on the glass slide. The emulsion PCR is performed to enrich the template sequence on beads. The sequencing by ligation approach used in SOLiD involves hybridization and ligation of primed template and fluorescently labeled anchor-probe with known base(s). DNA ligase is added to join the labeled probe to the primer where the probe was hybridized to the template. Those free probes are then washed away. In each cycle, the emitted fluorescence of ligated probe is captured for imaging the template. Unlike other sequencing platforms, SOLiD utilizes two-base-encoding probes, in which each ligation signal represents two bases of nucleotides, defined as color-space. After removing the probe-anchor complex, a new round of hybridization and ligation cycle starts again.
2.1.3 Complete Genomics
Complete Genomics is an approach performing template enrichment in solution, through the process of rolling cycling amplification. In this case, DNA sample is processed to create a circular template with four distinct adaptor regions, and then amplified to generate DNA nanoballs that are immobilized on a flow cell (Drmanac et al., 2010). The sequencing procedure is similar to the SOLiD platform, but uses one-base-encoding probes, so each fluorescent signal can directly represent one single nucleotide.
2.2 NGS APPLICATION
In recent years, high-throughput NGS technology has revolutionized genetic and genomic studies by providing the opportunity for interrogating different properties of cellular processes at massive scale. It covers genome re-sequencing, whole genome and transcriptome de novo assembly, transriptome profiling, DNA-protein interaction, and epigenetic characterization. Below are three types of NGS applied in this thesis.
2.2.1 Whole genome sequencing and exome sequencing
Whole genome sequencing (WGS) is to determine the complete DNA sequencing of a whole genome of any organism at one time. Using this method, an entire human genome can be
re-sequenced within a single day, instead of a decade spent in the HGP with Sanger-based sequencing. The cost of sequencing per base pair nucleotide is dramatically reduced as well (Metzker, 2010; Shendure and Ji, 2008). In addition to the benefits associated with the time and costs of sequencing whole genome, the new method also facilitates the discovery of novel genetic variations that cannot be accomplished by DNA arrays with pre-defined probes. High though-put exome sequencing was designed to re-sequence the entire exome in a human genome (Mamanova et al., 2010). It needs an extra step in DNA library preparation to capture the exons of annotated genes. Exome sequencing covers roughly 1% of the entire human genome (Hodges et al., 2007), and enable the target re-sequencing on more samples in a sequencing run with high coverage and depth at a limited cost.
2.2.1.1 Population
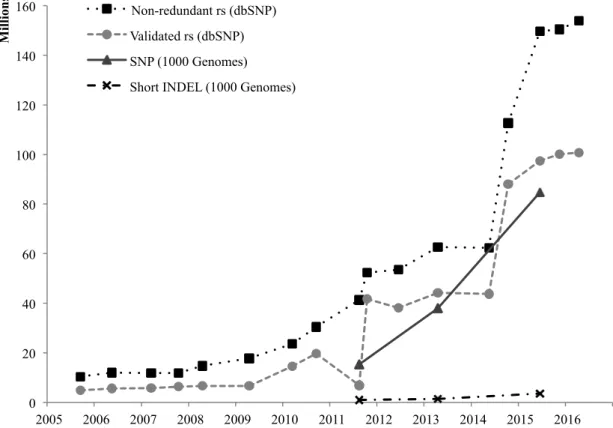
A major advantage of high though-put WGS and exome sequencing is to identify new genetic variations. In the dbSNP database (http://www.ncbi.nlm.nih.gov/SNP/), an increased trend in the total numbers of variant records has been observed over the past ten years (Figure 4).
Figure 4. Rate of growth in dbSNP database and 1000 Genomes project (Human) The statistic summary was retrieved from the dbSNP database and publications of 1000 Genomes project (Consortium, 2010, 2012a; The 1000 Genomes Project Consortium, 2015).
In 2010, the 1000 Genomes project was released, aiming to provide a characterized map of human genetic variations. From the WGS of 179 individuals in four populations, the exome sequencing of 697 individuals in seven populations and the deep sequencing of two family trios, 15 million SNPs, 1 million INDELs, and 20,000 structural variations were discovered (Consortium, 2010). The genome locations, allele frequencies in populations and haplotypes
0 20 40 60 80 100 120 140 160 2005 2006 2007 2008 2009 2010 2011 2012 2013 2014 2015 2016 M il li on s Non-redundant rs (dbSNP) Validated rs (dbSNP) SNP (1000 Genomes) Short INDEL (1000 Genomes)
were described about those variations, most of which were not annotated previously. After five years, the project has dramatically expanded to 2504 individuals from 26 populations, more than half of which have been performed whole genome and exome sequencing. The total numbers of genetic variants rose to 88 million (Figure 4) (Sudmant et al., 2015; The 1000 Genomes Project Consortium, 2015). More sequencing with large sample sets on population levels have been performed in the UK and Iceland (Gudbjartsson et al., 2015; The UK10K Consortium, 2015), as well as in Finland (http://www.sisuproject.fi). The insight into population genetic properties of variants provided references and facilitated identifying variants associated with human disease in a specific population. In our case, the references of allele genotype and frequency in European and Finnish populations played important roles in filtering candidate variants for validation.
2.2.1.2 Disorders
Both WGS and exome sequencing have successfully identified disease-associated variants, especially in Mendelian disorders (Bamshad et al., 2011; Ng et al., 2010). One of the earlier publications using exome sequencing for identifications of disease causative genes was reported on a study of Freeman-Sheldon syndrome (Ng et al., 2009). High-thoughput DNA sequencing was also utilized for clinical or molecular diagnosis (Choi et al., 2009; Lupski et al., 2010). In trio studies, the exome sequencing method also helped identify de novo mutations associated with complex disorders (Iossifov et al., 2014; O’Roak et al., 2011; Sanders et al., 2012; Vissers et al., 2010). There were also several NGS studies of IS and DD. Exome sequencing has been performed on individual samples in families or in cohorts. Some rare coding variants were discovered in AKAP2, FBN1, FBN2, HSPG2, POC5 and six musculoskeletal collagen genes showing genome-wide significance associate with IS, (Baschal et al., 2015; Buchan et al., 2014; Haller et al., 2015; Li et al., 2016; Patten et al., 2015). A novel mutation in CEP63 was identified in a Swedish family co-segregating with dyslexia by exome sequencing (Einarsdottir et al., 2015). A missense polymorphism in DCDC2 and a non-coding variant in S100B were reported to be associated with dyslexia by using high-throughput sequencing on candidate genes (Matsson et al., 2015).
2.2.1.3 Pooled DNA sequencing
WGS and exome sequencing are becoming increasingly popular in genetic studies because of their wide coverage and single-base resolution. However, in association study, sequencing each individual in the population scale is still costly, laborious and time-consuming. An alternative approach is to pool a number of individual DNA samples and sequence the pooled DNA, which can efficiently increase sample size and sequencing depth at a reduced cost and effort in library preparation. This approach only uses one library for entire pooled samples instead of separate libraries as sequencing individuals. Pooled DNA sequencing is designed for different purpose, such as genotype-phenotype mapping, domestication, genome evolution and cancer study (Schlötterer et al., 2014). The key for genotype and phenotype mapping is to compare the allele frequency between groups of individuals. If the individuals are divided into pools according to their phenotype, the phenotype-linked variants will show
large differences in frequency between pools (Sham et al., 2002). Meanwhile, the essence of pooling strategy is the allele frequency estimates in a group of individuals. Therefore, pooled DNA sequencing is appropriate for detecting phenotype-associated variants at a large scale and low cost. It can be applied in WGS, exome sequencing and target sequencing on restriction sites.
The pooling strategy showed good performance in fine mapping complex traits in model organisms (Axelsson et al., 2013; Bastide et al., 2013). Furthermore, pooled DNA sequencing demonstrated excellent performance in detecting rare variants when exploring candidate genes in human samples as well (Bansal et al., 2010; Druley et al., 2009; Out et al., 2009). In addition, certain pooled DNA sequencing studies at the whole exome scale have also discovered low-frequency variants associated with human complex disorders (Flanagan et al., 2013; Jiao et al., 2014).
2.2.2 RNA sequencing
RNA sequencing, so-called “RNA-seq”, is a method to study mRNA expression levels in a transcriptome-wide range using deep sequencing technology. The library preparation in RNA-seq requires converting a population of total RNA or polyA-tailed RNA to a library of cDNA fragments. With or without amplification, the cDNA fragments were then sequenced in a high-throughput approach. Before the era of NGS, large-scale gene expression studies were performed using microarrays, which has limitations in accuracy of low-abundant gene expression measurement and background level of hybridization (Marioni et al., 2008; Wang et al., 2009). This technique also requires the existing knowledge of genome annotation for profiling the whole transcriptome. Unlike microarrays, RNA-seq does not rely on the pre-determined probe and is thus able to detect transcription start sites, capture alternative splicing patterns and construct novel transcripts (Ozsolak and Milos, 2011; Wang et al., 2009).
RNA-seq has been applied to profiling mouse and human transcriptomes (Mortazavi et al., 2008; Sultan et al., 2008), especially during early developmental stages at single-cell resolution (Töhönen et al., 2015; Xue et al., 2013; Yan et al., 2013). In addition to the profiling of mammalian transcriptomes, RNA-seq has been utilized for transcriptome characterization and genome annotation on other model organisms (Derrien et al., 2011; Derti et al., 2012; Tan et al., 2013). As an invaluable model organism mentioned in section 1.5, zebrafish was used for understanding vertebrate development and human disease. To study gene expression at early development, several RNA-seq studies have been performed on zebrafish (Aanes et al., 2011, 2013; Vesterlund et al., 2011; Yang et al., 2013), from which novel transcripts and isoforms were discovered before and after zygotic genome activation. In addition, tag-based approach, cap analysis of gene expression (CAGE), was employed to map the transcription initiation and predict the transcription start sites in zebrafish embryo development (Nepal et al., 2013). RNA-seq has provided a large volume of data for identifying novel transcribed regions (NTRs) and isoforms of known genes. Before RNA-seq was used for annotating the zebrafish genome, there were 28717 transcripts in Ensembl
genome annotation release 54 (reference genome Zv8) in early 2009. Until the end of 2014, the total number of transcripts was almost double (56754) in Ensembl genome annotation release 79 (reference genome Zv9). The new zebrafish genome annotation is still under construction based on reference genome GRCz10. The total number of transcripts has so far increased to 57866 (release 84).
2.3 BIOINFORMATIC ANALYSIS OF NGS DATA
In the Illumina platform, the raw reads generated by sequencing machine are displayed in FASTQ format, regarded as the standard layout format of sequencing reads. Except for the de novo assembly purpose, the raw reads are usually aligned to the reference genome. The alignment procedure is also called mapping. The color-space reads generated by SOLiD platform are in different formats. When performing mapping, the reference genome should be converted to color-space to be consistent with sequencing reads. The mapped reads are usually presented in SAM format and further compressed to BAM format (Li et al., 2009). The BAM file contains information about the mapping quality and position of short reads. PCR duplicate removal is usually conducted on mapped DNA sequencing reads. A best practice workflow recommends INDEL realignment and base quality score recalibration on mapped reads (DePristo et al., 2011). After the pre-processing steps, the mapped reads are utilized for further analysis with diversity of purpose, e.g. variant detection, gene expression profiling, and new transcripts identification.
WGS and exome sequencing has been widely used in genetic research for identifying novel causal variants associated with rare diseases and susceptibility genes to common diseases. The capacity of sequencing instruments is now becoming increasingly large. A huge volume of both raw and analyzed data have been generated for the past several years and continue to increase especially when the sequencing cost drops dramatically (Goodwin et al., 2016). How shall we store large datasets, to evaluate the accuracy and precision, and to prioritize candidate genes? Data maintenance, analysis and interpretation are big challenges for handling NGS applications.
3 AIMS
The study projects presented in the thesis focused on the application of NGS technology in dissecting the genetics of complex diseases and annotating the model organisms used for functional study.
Paper I Assess the reliability of rare and low-frequency variant discovery and evaluate the accuracy of minor allele frequency estimates with pooled DNA sequencing
Paper II Identify susceptibility variants to scoliosis by exome sequencing of IS patients with a severe phenotype
Investigate the association of previously reported SNPs with IS in a Scandinavian cohort by a candidate gene study
Paper III Find the genetic variants within previously identified susceptibility locus that could explain the dysfunction of ROBO1 by re-sequencing the whole genome
Paper IV Discover NTRs in zebrafish by using RNA sequencing data and an in-house pipeline
4 MATERIALS AND METHODS
4.1 STUDY SUBJECTS AND MATERIALS
4.1.1 Idiopathic scoliosis (IS) case-control cohorts
Between 2004 and 2013, IS patients were invited to participate in the IS and Genetics in Scandinavia (ScoliGeneS) project (Andersen et al., 2006; Grauers et al., 2013, 2014). It is a multi-center study involving Karolinska University Hospital in Stockholm, Sahlgrenska University Hospital in Gothenburg, Sundsvall and Härnösand County Hospital, Umeå University Hospital and Middelfart Hospital in Denmark. Until the end of 2013, 1885 individuals were eligible and available for inclusion in the Scoliosis and Genetics in Scandinavia (ScoliGeneS) project and DNA samples were successfully extracted from 1739 of them (blood from 98% of the samples and saliva from 2% of the samples). The controls are composed of two cohorts: 909 elderly women from the OPRA cohort and 903 young women from the PEAK-25 cohort living in Malmö, Sweden (Gerdhem and Akesson, 2007; McGuigan et al., 2007). DNA samples were extracted from the blood of the controls.
In Paper I and II, 100 severe IS patients in the ScoliGeneS cohort (24 male and 76 female) were selected for exome sequencing with pooling strategy and validation by individual genotyping. In Paper II, 1739 cases and 1812 controls were used for studying the association of LBX1 with IS by genotyping. The ethical permits for sample collection and genetic study were approved by the Lund university Research Ethics Committee, the Regional Ethical Board in Skåne, the Karolinska Institutet Research Ethics Committee, the Regional Ethical Board in Stockholm and the Regional Committees on Health Research Ethics for Southern Denmark.
4.1.2 Preeclampsia (PE) case-control cohorts and families
The Finnish Genetics of Pre-eclampsia Consortium (FINNPEC) case-control cohort (Kaartokallio et al., 2014) was collected from five Finnish university hospitals from 2008 to 2011: Turku University Central Hospital, Oulu University Hospital, Helsinki University Central Hospital, University of Helsinki and Kuopio University Hospital. In Paper I, 90 severe PE patients with early onset or high proteinuria from the FINNPEC cohort were selected for exome-sequencing. In addition, 10 PE patients recruited from Kainuu and Helsinki were also included in exome sequencing. They belong to separate families chosen from previous family studies (Laivuori et al., 2003; Majander et al., 2013). The genomic DNA was extracted from the whole blood of the 100 samples. In addition to exome sequencing, they were also used for validation by individual genotyping. The ethical permits for sample collection and genetic study were approved by the Karolinska Institutet Research Ethics Committee and the Coordinating Ethics Committee of The Hospital District of Helsinki and Uusimaa.
4.1.3 Affected members of a dyslexia family
A multiplex three-generation family segregating dyslexia in an autosomal dominant fashion was identified in Helsinki, Finland (Nopola-Hemmi et al., 2001, 2002). All dyslexic and normal individuals in the family were native Finnish speakers. Twenty-one pedigree members affected with dyslexia were included for genotyping. Linkage analysis found out 19 of them shared the same haplotype on chromosome 3. In Paper III, the 19 affected individuals were included for whole genome sequencing using pooling strategy. In addition, two of them were selected for whole gnome sequencing individually. The ethical permits for sample collection and genetic study were approved by the Karolinska Institutet Research Ethics Committee and the Coordinating Ethics Committee of The Hospital District of Helsinki and Uusimaa.
4.1.4 A Bull Terrier tail-chasing case-control cohort
In a previous study about environmental effects on behavior, DNA samples were collected from tail-chasing Bull Terriers and controls (Tiira et al., 2012). To determine the tail-chasing behavior, detailed questionnaires were developed for dog owners. In Paper I, the DNA samples extracted from the blood of 10 Bull Terriers with tail chasing (3 male, 7 female) and 10 Bull Terriers without such phenotype (3 male, 7 female) were selected for whole genome sequencing. The same materials were used for validation by individual genotyping. The ethical permits for DNA collection and genetic studies were approved by the Finnish National Animal Ethics Committee.
4.1.5 Zebrafish embryos
The RNA-seq was performed using zebrafish material described in previous publication (Vesterlund et al., 2011). In brief, the eggs were collected immediately after fertilization, further staged by developmental time and observations of developmental stage: 1-cell, 16-cell, 512-cells and 50% epiboly. In each embryonic stage, total RNA was extracted from approximately 150 embryos. In Paper IV, we re-use the RNA-seq data for novel transcript identification. For experimental validation of putative NTRs, zebrafish cDNA from 50% epiboly was used as the template. Three biological replicates of each developmental stage were used for validating and measuring the expressions of randomly selected NTRs. The ethical permits for material collection and gene expression studies were approved by the Stockholm Animal Research Ethical Board.
In order to investigate the functions of candidate genes and the effects of genetic variants on non-coding regions, cell lines are usually employed to test the loss or gain of putative protein binding site on mutated loci. In Paper III, various types of cell lines were employed for functional study, which are describe in detail in the published paper.
4.2 NEXT GENERATION SEQUENCING 4.2.1 Pooling strategy
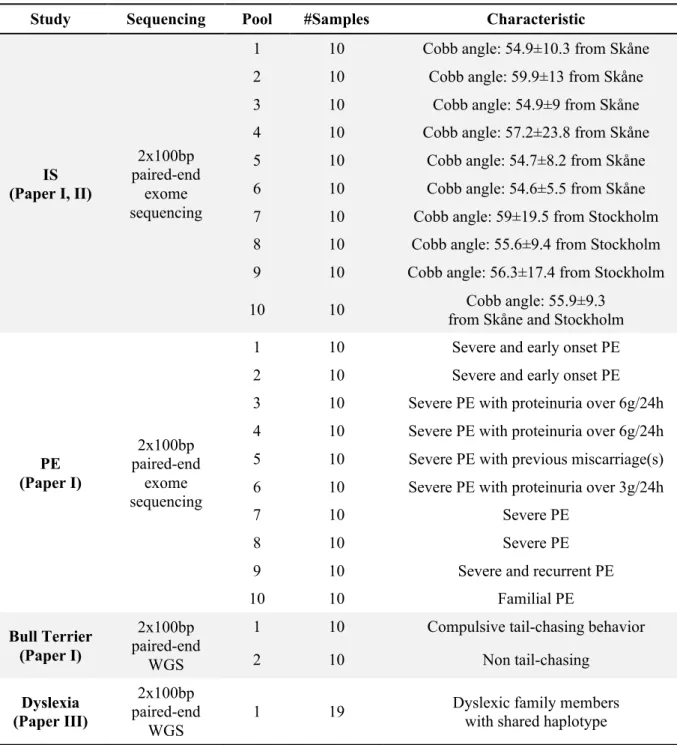
In Paper I and II, every 10 of a total of 100 IS patient samples were pooled together for exome sequencing. The same pooling scheme was utilized in Paper I for pooling the 100 severe PE patient samples and 20 Bull Terrier samples according to their characteristics (Table 2). In both exome sequencing studies of IS and PE, 800 ng of DNA extracted from individual samples was used for pooling. In the WGS study of Bull Terriers, 1 µg of DNA extracted from each Bull Terrier was used for pooling. The concentration and purity of DNA in the samples were controlled using a Nanodrop spectrophotometer, agarose gel electrophoresis and Qubit fluorometer. In Paper III, the same amount of DNA samples from 19 dyslexic family members were pooled together for whole genome sequencing.
Table 2. Pooling scheme for whole genome sequencing and exome sequencing
Study Sequencing Pool #Samples Characteristic
IS (Paper I, II) 2x100bp paired-end exome sequencing
1 10 Cobb angle: 54.9±10.3 from Skåne
2 10 Cobb angle: 59.9±13 from Skåne
3 10 Cobb angle: 54.9±9 from Skåne
4 10 Cobb angle: 57.2±23.8 from Skåne
5 10 Cobb angle: 54.7±8.2 from Skåne
6 10 Cobb angle: 54.6±5.5 from Skåne
7 10 Cobb angle: 59±19.5 from Stockholm
8 10 Cobb angle: 55.6±9.4 from Stockholm 9 10 Cobb angle: 56.3±17.4 from Stockholm
10 10 Cobb angle: 55.9±9.3
from Skåne and Stockholm
PE (Paper I) 2x100bp paired-end exome sequencing
1 10 Severe and early onset PE
2 10 Severe and early onset PE
3 10 Severe PE with proteinuria over 6g/24h 4 10 Severe PE with proteinuria over 6g/24h 5 10 Severe PE with previous miscarriage(s) 6 10 Severe PE with proteinuria over 3g/24h
7 10 Severe PE
8 10 Severe PE
9 10 Severe and recurrent PE
10 10 Familial PE Bull Terrier (Paper I) 2x100bp paired-end WGS
1 10 Compulsive tail-chasing behavior
2 10 Non tail-chasing Dyslexia (Paper III) 2x100bp paired-end WGS
4.2.2 Library preparation and sequencing
For pooled exome sequencing in Paper I and II, the pooled genomic DNA samples were sheared to 300bp using a Covaris S2 instrument (Covaris, MA, USA). The libraries were prepared using SureSelectXT Reagent kits (Agilent Technologies, CA, USA) and an Agilent NGS workstation according to the manufacturer's instructions (SureSelectXT Automated Target Enrichment for Illumina Paired-End Multiplexed Sequencing, version A). The SureSelectXT Human All Exon 50 Mb capture library was used for the targeted enrichment. Because of the high PCR duplication rate in the first round in the scoliosis DNA samples, technical replications were performed with the same library in eight pools.
For pooled WGS in Paper I and III, TruSeq DNA kits (Illumina Inc., CA, USA.) were used for preparing DNA libraries according to the manufacturer’s instructions except for the following changes. An MBS 1200 pipetting station (Nordiag AB, Stockholm Sweden) was used for automating protocols and substitutive magnetic bead clean-up methods were used for purification and gel-cut (Borgstrom et al., 2011; Lundin et al., 2010). The clustering was performed on a cBot cluster generation system using a HiSeq paired-end read cluster generation kit (Illumina Inc.) The technical replication of each Bull Terrier pooled sample was performed WGS with a different DNA library preparation.
In Paper I, II and III, Pooled whole genome and exome sequencing were performed on an Illumina HiSeq 2000 (Illumina Inc.) as paired-end reads to 100 bp at SciLifeLab Core Facility (Stockholm, Sweden). The base conversion was done using OLB v1.9 (Illumina Inc.). In Paper III, the whole genome sequencing of two dyslexic male individuals was performed at Complete Genomics Inc. (CGI, CA, USA) using their protocols.
As described in the previous publication (Vesterlund et al., 2011), RiboMinus™ Eukaryote Kit (Thermo Fisher Scientific, MA, USA) was used for depleting rRNA from total RNA, and then RNA was fragmented by RNase III (Thermo Fisher Scientific) in Paper IV. Using 200 ng of fragmented RNA as input, RNA-Seq library was constructed according to the Small RNA Expression Kit protocol (Thermo Fisher Scientific), and sequenced using SOLiD Opti Fragment Library Sequencing kit Master Mix 50 chemistry (Thermo Fisher Scientific) giving 50 bp reads on a SOLiD System Sequencing platform version 3 plus (Thermo Fisher Scientific). We performed a total of three runs of RNA-seq, with two biological replicate runs and one technical replicate runs.
4.3 DATA ANALYSIS
4.3.1 Alignment of sequencing reads
Paired-end Illumina sequence reads from pooled human samples in Paper I, III and III were aligned to the reference genomes with Burrows-Wheeler Aligner (BWA) (Li and Durbin, 2009) version 0.6.1 for each pool. We used the National Center for Biotechnology Information (NCBI) human reference genome build 37 (GRCh37/hg19) as the reference genome. The same mapping software was applied for mapping Bull Terrier whole genome
sequencing reads with Canis lupus familiaris genome assembly CanFam3.1 as reference. SAMtools (Li et al., 2009) was used for PCR duplicate removal in each pool (the WES studies: version 0.1.18; the WGS study: version 0.1.19) (Figure 5). In Paper I and III, Genome Analysis Toolkit (GATK) (McKenna et al., 2010) version 2.7.2 was applied for local realignment and base recalibration, taking variants from dbSNP 137 as reference. For the whole genome sequencing on Complete Genomics platform in Paper III, the CGI production pipeline aligned original data to NCBI reference genome build 37 with Complete Genomics Analysis Tools (CGA™ Tools).
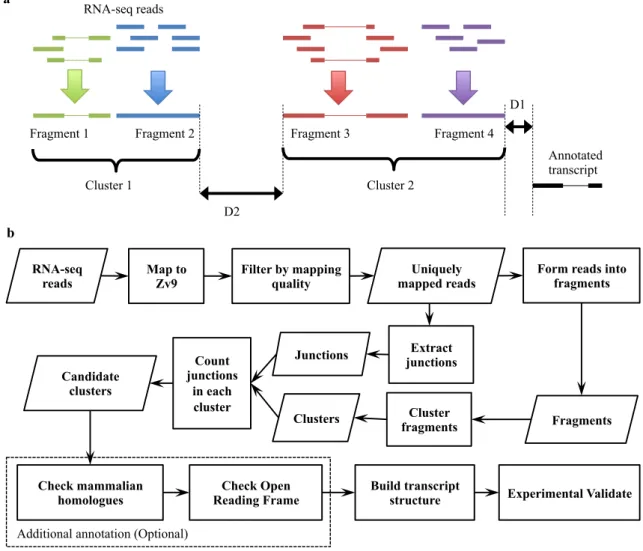
In Paper IV, Tophat (Trapnell et al., 2009) v2.0.4 that applies Bowtie (Langmead et al., 2009) v.0.12.8 was utilized for mapping color space reads generated by the SOLiD platform. Sequencing reads from three runs at four stages were individually aligned to the zebrafish reference genome danRer7/Zv9 assembly from Ensembl. All uniquely mapped reads with mapping quality (MQ) equal to or greater than 20 were applied for further analysis.
Figure 5. Workflow of evaluating pooling strategy with DNA sequencing data
4.3.2 Detection of genetic variations
In Paper I, we applied three programs: SAMtools mpileup function (version 0.1.19), GATK UnifiedGenotyper (UG) module (version 2.7.2 for the WES studies and version 3.2.2 for the WGS study) and Freebayes (Garrison and Marth, 2012) (version 0.9.21), to detect SNVs (Figure 5). Besides the default diploid setting in SAMtools and GATK UG, we also applied a
Figure S1. Workflow of pooled DNA sequencing processes
Mapping to reference genomes (separately) …... …... Pool 2 sequencing reads Pool 1 mapped reads Pool 2 mapped reads Pool n mapped reads SAMtools SNV calling Freebayes SNV calling Total MAF estimating GATK SNV calling MAF estimating by pools Pool 1 sequencing reads Pool n sequencing reads MAF estimating by pools Total MAF estimating Total MAF estimating
PCR duplicates removal, local realignment and base recalibration (separately)
ploidy setting of 20 when using GATK UG and Freebayes for detection. All uniquely aligned reads with high quality (MQ ≥ 20) from 10 pools in WES were simultaneously taken as input for variant detection.
To evaluate the detection of SNV from WGS in Paper I, the genotypes of 20 dogs from the Illumina array (in section 4.4.1) were taken as the true condition. The measurements used are defined as follows:
Sensitivity or true positive rate (TPR): Specificity (SPC) or true negative rate: Precision or positive predictive value (PPV): Negative predictive value (NPV):
Accuracy (ACC):
True positive (TP): the number of SNVs detected by both the WGS and the Illumina arrays; True negative (TN): the number of monomorphic loci that did not show SNVs in either the WGS or the Illumina array; False positive (FP): the number of SNVs detected by the WGS, but monomorphic in the Illumina array; False negative (FN): the number of SNVs detected by the Illumina array, but monomorphic in the WGS.
In Paper II, SAMtools mpileup (version 0.1.18) was employed for detecting variants in pooled exome sequencing samples with default setting. The uniquely mapped reads with high quality (MQ ≥ 20) from 10 pools were separately taken as input for calling variants in each pool. In Paper III, SNV and INDEL discovery was conducted in pooled samples using the default setting of GATK based on high quality data (MQ ≥ 20).
4.3.3 Evaluation of allele frequency estimates
In Paper I, when using GATK and Freebayes with ploidy setting, the alternative allele frequency of every variant in each pool was estimated based on allele counts. The minor allele counts from genotype information were extracted in each pooled sample, and then divided by total alleles in the pool (n=20). The total alternative allele frequency (AAF) was the ratio of alternative allele counts to total allele counts (n=200). In Paper I and II, another approach based on read depth was also utilized for estimating the allele frequency. SAMtools, GATK and Freebayes supplied coverage information at each variant site. The total AAF was the percentage of reads supporting the alternative allele across all 10 pools. (Figure 6)
For evaluating estimated allele frequency from WES in Paper I, root-mean-square deviation (RMSD) was employed to measure the difference between estimated MAF from exome sequencing and experimentally validated MAF by genotyping. The RMSD was calculated accordingly: TP TP+FN TN FP+TN TP TP+FP TN TN+FN TP+TF TP+FP+TN+FN